Metallicity Analysis of MACHO Galactic Bulge RR0 Lyrae stars from their Lightcurves
Abstract
We present metallicities of 2690 RR0 Lyrae stars observed toward the MACHO Survey fields in the Galactic Bulge. These values are based upon an empirically calibrated relationship that uses the Fourier coefficients of the light curve and are accurate to 0.2 dex. The majority of the RR0 Lyrae stars in our sample are located in the Galactic Bulge, but 255 RR0 stars are associated with Sagittarius dwarf galaxy. We find that the RR0 Lyrae stars that belong to the Galactic Bulge have average metallicities 1.25, with a broad metallicity range from 2.26 to . The RR0 stars from Sagittarius dwarf galaxy have lower average metallicity of , with an intrinsic dispersion of 0.25 dex, similar to that in the bulge. A correlation between metallicity and galactocentric distance is found, in a sense that for the metal-poor RR0 Lyrae stars ( 1.5 dex), the closer a star is to the Galactic center, on average, the more metal rich it is. However, for the metal-rich RR0 Lyrae stars ( 1.2 dex), this trend is reversed. Using mean magnitudes of MACHO RR Lyrae stars, we searched for the evidence of the Galactic bar, and found marginal evidence of a bar. The absence of a strong bar indicates that the RR Lyrae in the bulge represent a different population than the majority of the bulge stars, which are metal rich and are part of a bar.
1 Introduction
The bulge RR Lyrae variables are likely to be among the oldest and most metal poor stars in the bulge, so their metal abundances are of considerable importance in determining the mix of populations in the Galactic Bulge, and vital to our understanding of the nature of the bulge itself (Walker & Terndrup, 1991). Studying abundances of RR Lyrae stars lets us probe early chemical evolution of the Milky Way and allows the chemical history of the the oldest population of the bulge to be traced out.
Direct studies of the bulge are difficult due to the severe crowding toward the central regions of the Galaxy and the large, patchy, reddening along the line of sight. Therefore, astronomical literature contains limited spectroscopy of RR Lyrae stars toward the bulge and most spectroscopic studies focus on Baade’s window (BW) centered roughly on the globular cluster NGC 6522 at . Butler et al. (1976) measured abundances (Preston, 1959) for nine RR Lyrae stars in BW and derived a mean metallicity of from a broad abundance distribution. Gratton et al. (1986) measured values for 17 BW variables and found . Again the results suggested a wide range of abundance. Walker & Terndrup (1991) found a somewhat lower abundance of . from 59 RR Lyrae variables in BW. In contrast to other studies, they concluded that the RR Lyrae stars in BW had a relatively narrow range in abundance.
In this paper, we determine iron metallicities of bulge RR0111RR0 stars have been traditionally called RRab stars and are simply fundamental pulsators. See Alcock et al. (2000) for further explanation on the more intuitive nomenclature. Lyrae stars determined indirectly from pulsational properties of the variables. A number of studies have shown that Fourier parameters of light curves of RR Lyrae stars are related to their physics properties, including the metallicity (Simon & Clement, 1993). Jurcsik & Kovács (1996) used spectroscopic and photometric observations of field RR0 stars to calibrate a relationship between the of RR0 Lyrae stars and Fourier parameters. Because of the accurate fit of the Fourier formula to the observed metallicities of the RR0 Lyrae field stars, it appears to be very attractive to use this on various large databases. Recently, Kinemuchi et al. (2006) applied the Jurcsik & Kovács (1996) formula to find photometric metallicities of 433 of 1188 RR0 Lyrae stars in the Northern Sky Variability Survey. Although this method has been used frequently and appears to be reasonably reliable, there has been some question as to the validity of the Jurcsik & Kovács (1996) method (see discussions in Di Fabrizio et al, 2005; Gratton et al., 2004). This is investigated in detail in Appendix A where it is demonstrated that the derived from MACHO LMC RR0 Lyrae lightcurves using Jurcsik & Kovács (1996) method agrees well with spectroscopic determinations from Gratton et al. (2004) and Borissova et al. (2006). We utilize the Fourier coefficients for 2690 RR0 Lyrae stars in the MACHO bulge survey to derive abundances of these variables.
This paper first addresses the observational data and Fourier Coefficients in §2. Next, the derivation of , along with various tests, is described in §3. The presentation of bulge and Sgr metallicities and implications regarding these metallicities follow in §4. Using reddenings determined from the minimum V-band light of the RR0 Lyrae stars, in §5, trends coinciding with distance are elucidated. A summary is presented in §6.
2 Data
The observations of the Galactic Bulge were made by the MACHO team with a 1.27-meter telescope at Mount Stromlo Observatory, Australia (e.g. Alcock et al., 1997). In total, 7 seasons (1993-1999) of useful data were collected in the 94 Galactic Bulge fields. The two pairs of four 2k x 2k CCDs produced simultaneous imaging in non-standard blue and red passbands. Cook, Kunder, & Popowski present 3674 RR0 Lyrae stars toward the Galactic Bulge based on these observations. Kunder et al. (2008) use this database to find reddenings along the line of site to 3525 RR0 Lyrae Stars. Each RR0 Lyrae star in their catalog has a two-filter light curve with several hundred photometric measurements.
To convert the MACHO instrumental magnitudes and to standard Johnson’s and Kron-Cousins , we adopted the following relations:
| (1) |
and
| (2) |
These are taken from Alcock et al. (1999) under the assumptions of average airmass and no corrections for small scale focal plane effects. Almost all conclusions in this paper are derived using Johnson ; only in a few cases where colors of the RR0 Lyrae stars are needed, we refer to the Kron-Cousin .
3 Determination of the metallicity
3.1 The method
The phased light curve (here presented in terms of magnitudes ) is represented with its -th order Fourier decomposition:
| (3) |
where is the period and is the phase (see Petersen, 1986; Simon & Lee, 1981; Kunder et al., 2006, provides more details).
These coefficients are converted to phase and amplitude parameters that coincide with a pure sine Fourier series fit, and the Jurcsik & Kovács (1996) period-phase- relation can be applied. Figure 1 shows a representative star from our sample.
A deviation parameter, , defined by Jurcsik & Kovács (1996), represents a quality test on the regularity of the shape of the light curve. Kovács & Kanbur (1998) have updated values for the deviation parameters, which are employed in this analysis. In Appendix A, we demonstrate that a and a fourth order Fourier decomposition is best suited for the analysis of the data in this paper. The Jurcsik & Kovács (1996) period-phase- relation is:
| (4) |
where is the period, and is the Fourier phase difference, . Sandage (2004) scaled the metallicities obtained from the Jurcsik & Kovács (1996) period-phase- relation to the Zinn & West (1984) system, and we adopt his scaling relation:
| (5) |
The metallicity scale adopted throughout this paper is on the Zinn & West (1984) scale.
Figure 2 shows the location of our calibration stars in the plane. These stars include 61 RR0 Lyrae field stars from the Jurcsik & Kovács (1996) sample, 116 RR0 Lyrae stars from the clusters Omega Cen, M68, IC 4499, NGC 6171, M3 and M92 and 53 MACHO LMC RR0 Lyrae stars, all which have spectroscopic measurements. These calibration stars are discussed in more detail in the Appendix. The solid lines in Figure 2 enclose the area in which the calibration stars fall and is the region in which we take Equation 5 to be valid. In this paper, we will exclusively use the RR0 Lyrae stars that fall within this region. The completeness implications of this period- criterion is discussed in the §4.
3.2 The deviation parameter selection effect
Here we examine what stars are most affected by implementing the criteria and how that would affect statistical properties of the sample. Large values of the deviation parameter can be due to RR Lyrae which have intrinsically unusual lightcurves, or simply poorly sampled and/or noisy observational data. Especially the later effect could introduce a bias when determining the average metallicity of the sample.
We first look for a spatial bias by binning the RR0 Lyrae stars by Galactic coordinates. We define a completion ratio (), as the fraction of stars with a 4.5. A careful inspection of the resulting completeness map found no trend in the completion-ratio with location in the sky.
Figure 3 is a Period--amplitude (PA) diagram that encompasses the range of all the 3260 MACHO bulge RR0 Lyrae stars. The RR0 Lyrae stars are binned in the Period--amplitude plane so that each bin has 100 RR0 Lyraes, and the bins are represented by boxes.
The shaded boxes illustrate regions where , and hence where RR0 Lyrae stars are most affected by the criteria. These bins have 450 stars in them, or 14 % of the sample. The bins where comprise 30 % of the sample.
Stars with short periods and small amplitudes (P 0.5 d, -amp 0.8 mags), as well as the stars with long periods (P 0.7 d) are likely to have too high of a deviation parameter to be included in a metallicity determination. There are three bins in the bulge sample with -ratios of 0.35, 0.46, and 0.34 that have an average photometric metallicity from Equation 5 that are more metal rich than the average metallicity of 1.3 dex. If all the stars in these bins that currently have 4.5 (and hence are not included in our metallicity analysis) are given a equal to that of the average metallicity of their respective bin, then the average metallicity of the bulge RR0 Lyrae sample would increase by 0.025 dex and the dispersion would increase by 0.004.
Similarly, there are two bins in the bulge sample with -ratios of 0.18 and 0.21 that have average photometric metallicities more metal poor than = 1.3 dex. The stars in these bins are 5% of our sample, and the bias from either an incorrect or no metallicity estimate is again small. By and large, the completion ratio is large over the PA-diagram. There may be some incompletion effects with the long period stars, as well as the small amplitude/short period stars, but there are few stars in these bins, and the mean properties of the sample won’t change significantly.
4 Analysis of results
There are 2690 RR0 Lyrae stars with a that fall within the period- calibration region. Most of the RR Lyrae stars have magnitudes that peak at 15, which places them at a distance of 8 kpc. A few, however, are more than twice as far away, and these distant stars belong to the neighboring Sagittarius dwarf galaxy (Sgr). In order to separate these two populations, the RR0 Lyrae stars are dereddened using the Kunder et al. (2008) reddenings, and the dereddened color-magnitude diagram is shown in Figure 4. The two populations are separated at 16.9, where the smaller (brighter) magnitudes represent the bulge RR Lyrae stars; the fainter RR Lyrae stars belong to the Sagittarius dwarf galaxy. The 16.9 division is somewhat arbitrary, but changing the dividing line has no major impact on the conclusions drawn here. Following this procedure, 2435 RR0 Lyrae stars are assigned to the bulge and 255 RR0 Lyrae stars are assigned to Sgr dwarf galaxy.
4.1 Galactic Bulge RR Lyrae Stars
Figure 5 shows the location of MACHO Bulge RR0 Lyrae stars in the plane with the same enclosed region as discussed in §3 over-plotted. There are 360 Bulge RR0 Lyrae stars, or 15% of the bulge sample, which fall outside this area; only 80 of those (3 %) have a 4.5. The -ratio, or fraction of stars with a 4.5, significantly decreases outside the calibration region. Thus, the average is not significantly affected by the criterion.
The top histogram in Figure 6 shows the metallicities of the 2435 Galactic Bulge RR0 Lyrae stars. We find that RR0 Lyrae stars in the bulge have . This average is consistent with the spectroscopic one (Walker & Terndrup, 1991), and is also near the lower limit for the distribution of K giant abundances in the same field (Rich 1998; Geisler & Friel 1990). The dispersion found from the Galactic Bulge RR0 Lyrae stars is 0.30 dex. Using our metallicity error of dex, we obtain the intrinsic metallicity dispersion of the bulge RR0 stars of 0.22 dex. Note that the dispersion of the RR Lyrae variables is larger than expected from the measuring errors alone, which is evidence for a real abundance range. Due to the nature of horizontal branch evolution, RR Lyrae stars preferentially come from metal poor populations, and so the may be biased compared to the general population of old stars in the bulge.
The central 99% of the RR0 Lyrae metallicities range from to 0.15 dex. This is a wider spread than that found by Walker & Terndrup (1991), who took spectra of 59 RR Lyrae variables in BW. However, our sample is 40 times greater and covers a larger area. Our results are in reasonable agreement with Blanco (1984), who determined abundances indirectly for 51 RR0 variables in BW by extrapolating from the positions of the M3 and M15 variables in the period-amplitude diagram (Sandage, Katem, & Sandage 1981; Sandage 1982) and found a distribution ranging from to dex. Our bulge metallicity distribution is also consistent with Zoccali et al. (2003), who analyzed near IR photometry of 513 bulge giants and inferred metallicities from to +0.7 dex.
The bulge RR0 stars are separated into three metallicity bins and plotted according to their position in the sky in Figure 7. It is suggestive from Figure 7 that the fields with and have 833% RR0 Lyrae stars with between and dex. The fields outside this range consist of RR0 Lyrae stars of which 782% have an intermediate metallicity. This is slight indication that RR0 Lyrae stars further from the central bulge ( and ), seem to vary more in their metallicities.
It is an interesting question how our metallicities compare not just on average but on a star-by-star basis. Walker & Terndrup (1991) took low-resolution spectra of 42 RR0 Lyrae stars in BW, and via the method derived metallicities for these stars. Based on position in the sky and period, 32 MACHO RR0 stars could be matched with the ones from their sample. Five of these had deviation parameters too large for an accurate metallicity derivation; this leaves us with 27 Walker & Terndrup (1991) RR0 stars available for a comparison. Rodgers (1977) find the of 27 stars in the Palomar-Groningen fields 2 and 3 of the galactic nuclear bulge. Two of the stars in this sample overlap with stars in the MACHO bulge sample. Using Rodgers (1974) dependence of on , (their Table 2), a can be assigned to each of these stars, and their can be found.222The same - relation used in Walker & Terndrup (1991) is employed here. This relation is from Butler (1975) on the Zinn & West (1984) metallicity scale.
Figure 8 shows the comparison between the metallicity based on observations (Walker & Terndrup, 1991; Rodgers, 1977) and that from our Fourier coefficients. There are some large differences between the determined here, and determined from the S measurements of Walker & Terndrup (1991). In particular, we determine a smaller range of abundances than that found by Walker & Terndrup (1991). The dispersion about the line of unity is 0.42 dex. Unlike spectroscopic methods that rely upon measurements of the CaII K-line, the Fourier method does not require a knowledge of the interstellar K-line strength. Those lines can be strong enough to sometimes be a significant source of uncertainty in the application of the S method to bulge RR Lyrae stars. The agreement between the MACHO LMC photometric determinations and the LMC spectroscopy from Borissova et al. (2006) and Gratton et al. (2004) as discussed in the Appendix, provides evidence that the photometric metallicities here are reliable. More spectra of RR0 Lyrae stars in the bulge, especially intermediate or high-resolution spectra, is needed to clarify this discrepancy.
4.1.1 Presence of two different populations
The elongation of the bulge and its barred structure was clearly shown by the DIRBE IR maps (Dwek et al., 1995), and by the clump giants (Stanek et al., 1994). Cabrera-Lavers et al. (2007) use the red-clump population to show that two very different large-scale triaxial structures coexist in the inner Galaxy, a thick bulge and a long thin bar. The long thin bar is constrained to , whereas the thick bulge extends to at least . Although RR Lyrae stars are classical tracers of old metal-poor populations, a RR Lyrae barred distribution is not as clear as that of bulge clump giants. For example, Alcock et al. (1998) found evidence of a bar using red clump stars in the MACHO fields, but showed that the bulk of RR Lyrae stars do not follow the expected barred distribution. A small barred structure may be present in the bulge RR Lyrae population (Collinge, Sumi & Fabrycky 2006), but other studies (Alard, 1996; Wesselink, 1987) find no bar in the RR Lyrae distribution. In fact, as Alcock et al. (1998) point out, the RR Lyrae stars analyzed by Wesselink (1987) tended to be fainter and, therefore, more distant than those at negative longitudes, when forcing a triaxial fit to his low-latitude data.
The absence of a strong bar in the RR Lyrae population would indicate that they represent a different population than the metal rich bulge. Using the effect of metallicity in the period-amplitude plane, Alcock et al. (1998) separated RR Lyrae stars into three bins containing the metal-rich, intermediate, and metal-poor stars. Only for the metal-rich subsample could a barred distribution not be ruled out within their errors.
We look at the mean RR0 Lyrae magnitudes falling within . For a barred distribution with a standard inclination angle, one would expect that RR Lyrae stars at positive Galactic longitudes would be brighter since they would be nearer than those at negative longitudes. Reddening-independent magnitudes are used to avoid uncertain reddening corrections and are defined as , where the factor 4.3 is the selective extinction coefficient derived by Kunder et al. (2008). The dominant error in the MACHO photometry comes from zero-point uncertainties between different MACHO fields. For example, Cook et al. estimate a error in the -magnitudes from overlap RR0 Lyrae stars in the MACHO fields. To remove systematic magnitude errors that occur between fields, the RR Lyrae magnitudes are binned by MACHO field; the statistical error associated with each magnitude bin is 0.16 mags.
Figure 9 shows the mean reddening-independent magnitudes in each of the MACHO bulge fields with . In each field, there are between 4 and 100 RR0 Lyrae stars. Assuming no positional error in each bin, the weighted on galactic L regressions to all the stars shows that the RR0 Lyrae stars show a slight signature of the expected barred distribution with a slope of (0.015). Restricting the sample to include only those stars with , the barred signature becomes stronger with a slope of . Both of these values are in agreement with the barred signature found in the Red Clump stars (0.037 mag/∘ Stanek et al., 1994) and in the OGLE Bulge RR0 Lyrae stars (0.038 mag/∘ Collinge et al., 2006).
Given the uncertainties in the MACHO -band photometry, the RR Lyrae absolute magnitude dispersion, and the depth of the bulge, a simple Monte Carlo analysis is performed to see if a bar could in fact be seen in the MACHO data. A Gaussian dispersion about 14.5 mags is generated for each MACHO field that takes into account an RR Lyrae absolute magnitude dispersion of 0.1 mags, a bulge distance spread of 0.29 mags (which corresponds to a 1 kpc distance spread), and the 0.16 mag photometric error. Next a slope of is assigned to this data. We find that the given slope is recovered from the simulated values with a 5-sigma detection. The 2-sigma barred detection found in the MACHO data is indication that the RR Lyrae stars only weakly trace out the bar.
The MACHO Bulge RR0 Lyrae stars were separated into metal-rich, intermediate, and metal-poor metallicity bins and the procedure is repeated. This reduces the amount of RR Lyrae stars in each field, however, and the Monte Carlo analysis predicts that no conclusive bar-signature would be seen. Indeed a quantitative analysis of the RR0 Lyrae stars in these bins reveals no slope for either populations.
Although a barred slope potentially could be seen with the MACHO data, no strong bar signature is seen with the RR0 Lyrae stars here. This is further evidence that the majority of the RR Lyrae stars do not belong to the triaxial bulge, but belong to the extension of the Galactic halo in the inner regions. The absence of a strong bar in even the RR Lyrae population needs to be considered when forming scenarios on the formation of the Milky Way bulge.
4.2 RR Lyrae Stars from Sagittarius dwarf galaxy
The Sagittarius dwarf spheroidal galaxy (Sgr) is a nearby satellite of the Milky Way and one of the galaxies that is currently disrupting under the strain of the Galactic tidal field. (Ibata et al. 1994, 1997, Monaco et al. 2004, Majewski et al. 2003). It spans a large area and contains a mix of stellar populations. Sixteen Sgr RR0 Lyrae stars, or 6% of the Sgr sample, fall outside the criterion shown in Figure 2 and discussed in §3. As none of these stars have a favorable , the average is not affected. Figure 10 shows the location of the Sgr stars in the MACHO sample relative to the center of the galaxy, assumed to be M54. The RR0 Lyrae stars are separated according to their metallicity in this figure, and no trend of metallicity with location in the sky is apparent.
The mean metallicity of the RR0 stars in area of the Sgr covered by the MACHO survey is . This is based on 255 RR0 Lyrae stars with a dispersion of 0.31. The intrinsic SGR metallicity dispersion is 0.25 dex, identical to that in the bulge, and identical to the internal dispersion found by Alard (2001) of giant branch stars. The metallicity range for the central 99% stars is to 0.76. These results are consistent with Alard (2001) and Ibata et al. (1994). It is also in agreement with Mateo et al. (1995), who used OGLE RR Lyrae stars to find that the properties of the Sgr giant branch and upper main sequence is consistent with a mean metallicity of .
5 Distances to the Stars
RR Lyrae stars are well known standard candles and play an important step in the distance ladder. It has long been known that their absolute magnitude is a function of metallicity, and it has normally been assumed that the absolute magnitude of an RR Lyrae star has a linear dependence on (e.g. Krauss & Chaboyer, 2003). In recent work, it has been suggested that this linear dependence is not suitable for the most metal-rich ( 0.7 dex) field variables (Bono, Caputo, & di Criscienzo 2007). We use the quadratic relation from Bono et al. (2007):
| (6) |
to find the absolute magnitude of each star. This is valid over the entire metallicity range of to 0.
Using Equation 6 the mode of the Bulge RR0 Lyrae star sample is 8.02 kpc 0.05 where the error indicates the uncertainty in determining the mode only. Taking a reasonable error in the RR Lyrae absolute magnitude- zero-point calibration (0.08 mags) and propagating it linearly with the MACHO zero-point and calibration error, the estimated error in the distance to the Galactic Bulge is 0.3 kpc. Therefore, our estimated distance to the Galactic Bulge is 8.0 0.3 kpc. This is in reasonable agreement with Eisenhauer et al. (2005), who found 7.62 0.32 kpc from the orbit of one star around the Milky Way’s central black hole. It is also in agreement with Groenewegen, Udalski & Bono (2008) who found 7.94 0.26 kpc from K-band magnitudes of Population-II Cepheids.
We deredden each star using the minimum-light color of each RR0 Lyrae star, and convert color excess to using an of 4.3 (Kunder et al., 2008). We find the galactocentric distance to each RR0 Lyrae star:
| (7) |
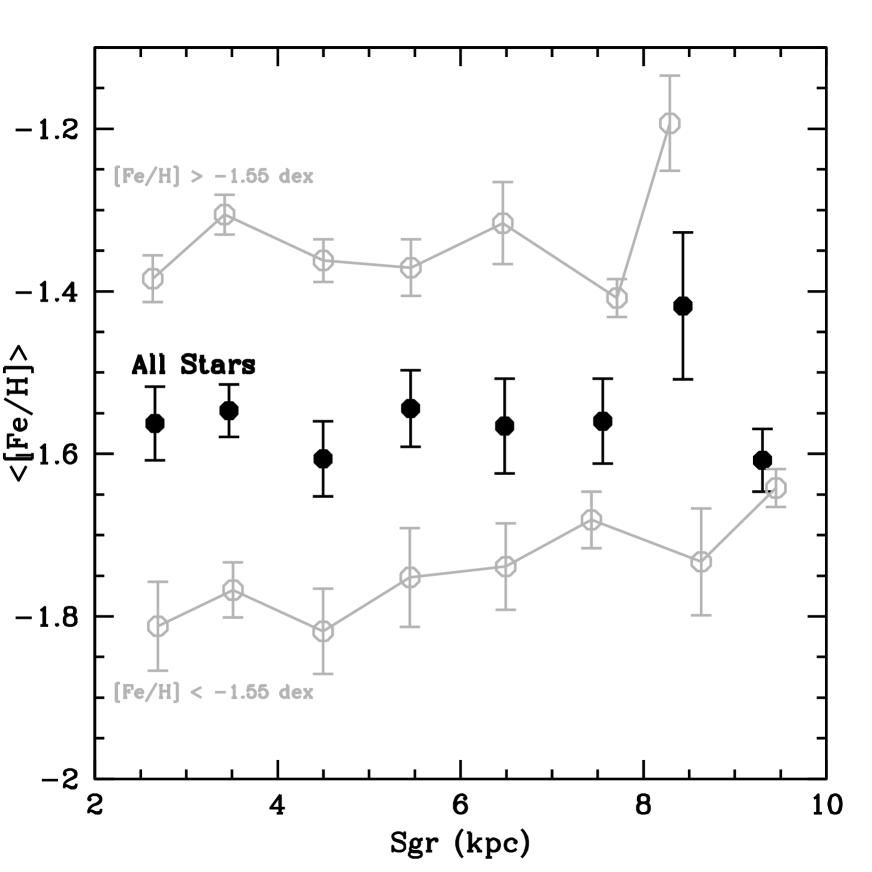
where is the galactocentric distance in parsecs, is the distance from the Sun to the Galactocenter, and and are Galactic latitude and longitude, respectively. The mode of our RR0 Lyrae sample is used as . The average of all stars lying within a 1.0 kpc bin is calculated, and plotted against the galactocentric distance in Figure 11. Next, the bulge RR Lyrae stars are separated according to metallicity, and the same procedure is implemented for two metal-rich cuts (1.0 dex and 1.2 dex) and two metal-poor RR Lyrae star cuts (1.2 dex and 1.5 dex).
There is a correlation of with radial distance depending on the metallicity of the RR0 Lyrae stars. At further distances from the bulge, the metallicity in general decreases for the metal-poor stars. However, this trend is reversed for the metal-rich bulge stars. Once the metal-rich stars approach 1.5, the trend with Galactocentric distance diminishes. From the spectra of the Galactic Bulge red giant population, Minniti (1996) found that the velocity dispersion of the metal-rich giants decreases with increasing Galactocentric distance, whereas the velocity dispersion of the metal poor giants shows no trend. The result obtained here, that the metal-rich and metal-poor RR Lyrae stars show a different trend in galactocentric distance, is similar in spirit.
There may be some substructures in this versus radial distance plot. Between 4.0 and 6.5 kpc, there is the first “break” in a linear metallicity curve. By looking at the Cepheid galactic gradient, Kovtyukh, Wallerstein & Andrievsky (2005) speculate that near 6 kpc, a transition from the young-disk population to the outer regions of the Galactic Bulge population occurs. Perhaps we see such a signature using bulge RR0 Lyrae stars as well.
It is also interesting to consider if there are any trends with in the Sgr galaxy. Coordinate transformations with the origin at the center of the Sgr galaxy are performed to determine the distance to each Sgr RR0 Lyrae star from the center of the Sgr galaxy. We take M54 to be the nucleus of Sgr (Monaco et al., 2005) and use Layden & Sarajedini (2000) M54 RR0 Lyrae sample, combined with Equation 7, to determine the distance to M54 as 27 kpc. This distance to the center of Sgr is based on RR0 Lyrae stars using the same relationship adopted in this work to minimize systematic effects. However, the coordinate transformations to the Sgr frame will be somewhat sensitive to the exact value of the distance to Sgr’s center.
The average of all Sgr stars lying within a 1.0 kpc bin is calculated and plotted against the distance of the center of Sgr in Figure 12. The metal-poor Sgr RR0 Lyrae stars show a slight correlation of with radial distance. On average, the further from the center of Sgr, the more metal-rich the RR0 Lyrae star. The metal-rich and intermediate RR0 Lyrae stars do not display a metallicity gradient. Cseresnjes (2001) did not find evidence for a spatial metallicity gradient in the RR Lyrae population of Sgr when carrying out a period analysis on 3700 Sgr RR Lyrae stars located just a little south, in galactic coordinates, of the MACHO fields. Some of the RR Lyrae stars in their study actually overlap with the MACHO fields.
The correlation of with radial distance within the metal-poor stars is in the opposite direction to the metallicity gradient found from giant stars by Alard (2001); Marconi et al. (1998); Bellazzini et. al (1999). However, metallicity gradients in Sgr may depend on the type of the stellar population under investigation.
6 Conclusion
Metallicity measurements of 2690 RR0 Lyrae stars are presented from the MACHO bulge database using the Fourier coefficients of their light curves, with an error of 0.20 dex. Parameters derived for individual stars are available electronically in Table 1 for the bulge stars and Table 2 for Sgr stars. We find that RR0 stars in the Galactic Bulge span a broad metallicity range from to dex, and have an average metallicity of 1.25. This compares favorably to other bulge metallicity studies.
Using mean magnitudes of MACHO RR Lyrae stars we searched for the evidence of the Galactic bar, and found a slight signature of a Galactic bar with Galactic latitude . The most straightforward interpretation of the absence of a strong bar is that the metal-rich RR Lyrae in the bulge represent a different population than the metal-poor majority. As we also found that the average metallicity in this region is considerably less varied and diverse, we conclude that there is evidence indicating the presence of a population belonging to the inner extension of the halo, which is relatively metal-poor and which could be among the oldest known stars in our Galaxy.
The RR0 Lyrae stars believed to be in the northernmost extension of the Sgr galaxy have a 1.53 which is on average more metal poor than the RR0 Lyrae stars from the bulge. This value lies within the range of metallicity of Marconi et al. (1998), and agrees well with the metallicity found for the -magnitude data of RR0 stars given by Mateo et al. (1995).
Based on metallicities of RR0 Lyrae stars, we estimate their absolute magnitude and distances to all stars. The distance to the Galactic Center is 8.0 0.3 kpc, where the error takes into account the estimated error in the MACHO photometry calibration as well as the zero-point in the RR0 Lyrae absolute magnitude relation. A correlation between metallicity and galactocentric distance is found. For metal-poor RR Lyrae stars the closer a star is to the Galactic center, on average, the more metal rich it is. However for the metal-rich RR0 Lyrae stars, we find that this is not the case; instead, on average, the closer a star is to the Galactic center, the more metal poor it is. The result that the metal-rich and metal-poor RR0 Lyrae stars show a different trend in galactocentric distance needs to be addressed when modeling the chemical evolution of the Milky Way.
The Sgr RR0 Lyrae stars do not show a strong metallicity gradient. However, the metal-poor Sgr RR0 Lyrae stars do indicate a metallicity gradient of +0.15 dex from 2 kpc to 10 kpc of the galaxy. (The further the RR0 Lyrae star from the center of Sgr, the more metal rich.) This metallicity gradient is in the opposite direction as that found using giant stars by Alard (2001); Marconi et al. (1998); Bellazzini et. al (1999).
Appendix A Spectroscopic versus photometric abundances
Some recent work has suggested that the Fourier parameter-based [Fe/H] calibration gives discrepant results, especially in the low metallicity regime (see discussions in Di Fabrizio et al, 2005; Gratton et al., 2004; Nemec, 2004). In Kovács (2005), the iron abundances of 79 RR0 Lyrae stars derived from the Fourier parameters were compared with those obtained from low-dispersion spectroscopy. It was shown that almost all discrepant estimates are the results of some defects or peculiarities either in the photometry or in the spectroscopy (i.e. spectroscopic abundances based on only two measurements or high noise in light curve).
Here a comparison is made between spectroscopic and Fourier metallicities to asses the accuracy of our determination. Such an analysis has been performed by Jurcsik & Kovács (1996) and in a variety of other papers thereafter, (e.g. Schwarzenberg-Czerny & Kałużny, 1998; Kovács, 2005) the calibration stars used here differs in many respects. First, a variety of globular clusters with RR Lyrae lightcurves which have previously over over- or under-estimated the published cluster metallicities when using the Jurcsik & Kovács (1996) metallicity formula, are addressed. Second, this set includes MACHO LMC lightcurves with low resolution spectroscopy in the bar of the Large Magellanic Cloud. As a by product of this analysis, the best deviation parameter for our particular Fourier decomposition is found.
A.1 Star by star comparisons
Figure 13 shows a star-by-star comparison of the metallicity obtained here photometrically () versus published spectroscopic metallicities () of a variety of field, cluster, and LMC RR0 Lyrae stars. The spectroscopic metallicities of the 61 RR0 Lyrae field stars come from the Jurcsik & Kovács (1996) sample and references therein. The spectroscopic metallicities of the globular clusters are discussed in turn below. The lightcurves of these stars come from Jurcsik & Kovács (1996); Borissova et al. (2006); Gratton et al. (2004); Olech et al. (2003), and Andrew Layden’s website 333http://physics.bgsu.edu/l̃ayden/ASTRO/DATA/rrl_data.htm. The root mean square residual of the fit is consistent with 0.2 dex for RR Lyrae stars with and a Fourier decomposition with a fit order of four. Figure 14 shows the difference between the photometric and spectroscopic metallicities as a function of the spectroscopic metallicity. Discrepant values do not seem to favor a particular metallicity regime.
A.2 The metal-poor end
Jurcsik & Kovács (1996) acknowledged that the equation overestimated for the metal poor clusters M68, M92 and the LMC cluster NGC 1841. Some years later, Nemec (2004) reached a similar conclusion in an investigation of NGC 5053. However, in the Jurcsik & Kovács (1996) calibration sample, a significant number of metal poor field RR0 Lyrae stars are used to test their metallicity formula. The sample extends to stars slightly more metal poor than 2.0 on the Jurcsik & Kovács (1996) metallicity scale, which corresponds to 2.3 on the Zinn & West (1984) metallicity scale. The metal poor field RR0 Lyrae stars show no increase in deviation from the Jurcsik & Kovács (1996) period-phase- relation. Thus the globular cluster discrepancy is puzzling.
On the Zinn & West (1984) scale, the Jurcsik & Kovács (1996) photometric metallicity of M92 is 2.28 dex. Recent high dispersion spectroscopy found that M92 has = 2.38 dex (Kraft & Ivans 2003, on the Zinn & West 1984 scale), as opposed to the -2.63 dex value assumed in Jurcsik & Kovács (1996). This is in agreement with Jurcsik & Kovács (1996).
Lee, Carney & Habgood (2005) used high-resolution spectroscopy to find 0.02 for M68 as opposed to the 0.03 value cited by Jurcsik & Kovács (1996) for M68. This value is closer to the metallicity originally derived by Jurcsik & Kovács (1996) of 2.05 dex (on the Zinn & West 1984 scale). Kraft & Ivans (2003) find 2.43 dex. We perform a fourth, fifth and eighth order Fourier decomposition to the M68 RR0 Lyrae star lightcurves, and calculate a deviation parameter. The fourth order Fourier decomposition results in five stars with a 4.5, and the average is 0.12, in excellent agreement with the most recent M68 metallicity value. Increasing the deviation parameter significantly increases the scatter in average photometric metallicity for this cluster. The eighth order Fourier decomposition is similar in result to the fifth order Fourier decomposition, and yields a value almost identical to the value of M68 found for M68 in Jurcsik & Kovács (1996) of 2.05 dex. We therefore adopt a fourth order Fourier decomposition and a 4.5 criteria for use in this paper.
NGC 5053 is known to have an extremely low metal abundance of 2.4 dex (Kraft & Ivans 2003, which is based upon Ca II triplet observations). Nemec (2004) obtained photometry of 10 RR Lyrae stars in this cluster and used Jurcsik & Kovács (1996) metallicity formula to find their photometric metallicities. They find the mean = -2.1 dex on the Zinn & West (1984) scale, about 0.3 dex more metal rich than it’s published metallicity. It is notable, however, the Nemec (2004) photometry shows scatter in the phased lightcurve. Perhaps the difference of the derived photometric metallicities in NGC 5053 is a function of the quality of these lightcurves as opposed to a failure in the method.
A.3 The metal-rich end
The Jurcsik & Kovács (1996) calibration sample also contained a significant number of metal rich field stars (up to = +0.08 dex). The metal rich field RR0 Lyrae stars show no increase in deviation from the Jurcsik & Kovács (1996) period-phase- relation. However recent papers have suggested that the RR0 Lyrae stars in the metal rich clusters of NGC 6441 and NGC 6388, ( 0.11 and 0.15, respectively; Armandroff & Zinn 1988), give photometric metallicities that are much more metal poor than the spectroscopic metallicity of the cluster (Pritzl et al., 2001, 2002). Since then, using the Hubble Space Telescope, Pritzl et al. (2003) found that their previous ground based photometry of the NGC 6441 RR Lyrae stars in the center of the cluster is largely affected by blends, resulting in photometry errors of up to 1.5 magnitudes in the -band. Unfortunately, there are not enough -band lightcurve points from the Pritzl et al. (2003) data to derive with a small deviation parameter.
There are two Pritzl et al. (2001) RR0 Lyrae stars in NGC 6441 with a 4.5, and both of these stars give -1.3 dex. One of these stars is only 32” from the center and therefore is most likely affected by blending. There is one RR0 Lyrae star in the Pritzl et al. (2002) NGC 6388 data with a 4.5. This star, V22, gives -1.3 dex for the fairly metal-rich globular cluster of NGC 6388. Using low-resolution spectra, Clementini et al. (2005) finds that the RR0 Lyrae variables in NGC 6441 range from -0.46 to -1.37 dex. This range does allow for somewhat higher metal abundances of RR0 Lyrae stars in NGC 6441.
The RR0 Lyrae variables in NGC 6441 and NGC 6388 tend to have longer periods than a typical RR0 Lyrae star (as long as P = 0.9 d), and no stars with periods longer than 0.8 days are used in the Jurcsik & Kovács (1996) calibration sample. Indeed, it is easy to see the the Jurcsik & Kovács (1996) metallicity formula cannot give a metallicity larger than 0.6 dex on the Zinn & West (1984) scale for a variable with a period of 0.8 days. There are no RR0 Lyrae stars in the MACHO sample used in this paper with a period greater than 0.8 days. Thus, there are relatively few RR0 stars in our sample with have similar properties to those in NGC 6388 and NGC 6441, for which the Fourier estimate of [Fe/H] is likely biased.
A.4 The intermediate metallicity stars
There is not as much discussion about the validity of the Jurcsik & Kovács (1996) metallicity formula for the intermediate-metallicity stars, as it appears to to be robust for these stars. Using 110 stars from the All Sky Automated Survey (ASAS) database, Kovács (2005) found that with the current fitting accuracy of 0.17 dex of the Fourier formula, the overall prediction accuracy, (i.e., the standard deviation of the predicted ) is 0.12 dex. This sample does include metal-rich and metal-poor stars, but the majority of them have an intermediate metallicity, most centered around = 1.2.
However, Schwarzenberg-Czerny & Kałużny (1998) noted that no obvious correlation exists between the Butler, Dickens & Epps (1978) low-dispersion metallicities of RR0 Lyrae stars in intermediate metallicity cluster Centauri and their photometric metallicities. Rey et al. (2000), however, did find a correlation when using metallicities derived from their Caby photometry. Recently, Sollima et al. (2006) presented new high-resolution spectroscopic metal abundances for 74 RR Lyrae stars in Cen obtained with FLAMES, 36 of these being RR0 Lyrae stars. Twenty- eight of these RR0 Lyrae stars had a 4.5 and Fourier parameters obtained from Olech et al. (2003). The Olech et al. (2003) Fourier parameters come from light curves obtained by the Cluster AgeS Experiment (CASE) project and have between 200 - 600 observations per light curve. The photometric and spectroscopic metallicities of the 28 RR0 Lyrae stars, which range from 2.1 to 1.2 dex, are in excellent agreement, exhibiting a 0.16 dex dispersion around the line of unity.
A.5 MACHO lightcurves
The MACHO survey used non-standard filters which are converted from MACHO instrumental magnitudes and , to Johnson . An error in the conversion process in these bands would lead to the incorrect shape of the lightcurve. This in turn would affect the values of Fourier coefficients and lead to an incorrect estimate of metallicity. MACHO LMC RR0 Lyrae stars can be used to address this concern.
Gratton et al. (2004) find metallicities for 98 RR Lyrae from low resolution spectroscopy in the bar of the Large Magellanic Cloud with typical errors of 0.17 dex. Using their positions in the sky and their periods, forty-two of these stars are found to match with a MACHO LMC RR0 Lyrae stars from Alcock et al. (2003) . Borissova et al. (2006) measured spectroscopic metallicities (in a similar manner to Gratton et al., 2004), for 50 MACHO RR Lyrae stars in the LMC. Fifteen of these stars are included in the published Alcock et al. (2003) sample. The Gratton et al. (2004) and Borissova et al. (2006) metallicities are on the Harris (1996) metallicity scale and are shifted by 0.06 dex to also place them on the Zinn & West (1984) scale (Gratton et al., 2004). The MACHO photometry is used to determine . All 15 RR0 Lyrae stars from Borissova et al. (2006) and 38 RR0 Lyrae stars from Gratton et al. (2004) have a 4.5. Thus, there are 53 LMC stars with spectroscopic abundances that also have MACHO lightcurves. The top plot in Figure 13 shows a star-by-star comparison of the MACHO photometric LMC metallicities and the earlier published spectroscopic metallicities. The fit is a linear with a reduced mean scatter (rms) of 0.22 dex around the line of unity, with an average difference of 0.21 dex. Increasing the order of the Fourier series does not show any significant changes of the (lower) Fourier coefficients when using the MACHO data.
Di Fabrizio et al (2005) use 29 RR0 Lyrae stars to derive the average difference between their photometric and spectroscopic metallicities to be 0.3 dex. As this difference is larger than what we obtained in the previous paragraph, we match 20 light curves in the Di Fabrizio et al (2005) sample with MACHO LMC lightcurves stars that also have Gratton et al. (2004) metallicities. A photometric metallicity is determined for these 20 stars using both the Di Fabrizio et al (2005) light curves and the MACHO LMC light curves. The rms about the line of unity is 0.34 dex between the spectroscopic and the Di Fabrizio et al (2005) photometric metallicities, similar to the result found by Di Fabrizio et al (2005). However, when the MACHO lightcurves are used, the rms scatter is reduced to 0.22 dex between the spectroscopic and MACHO photometric metallicities, which is in line with our estimated error. This is most likely due to the fact the MACHO light curves have 7-9 times as many data points as the Di Fabrizio et al (2005) light curves.
References
- Alard (1996) Alard, C. 1996, Ph.D. thesis, Obs. De Paris
- Alard (2001) Alard, C. 2001, A&A, 377, 389
- Alcock et al. (1997) Alcock, C., et al. 1997, ApJ, 474, 217
- Alcock et al. (1998) Alcock, C., et al. 1998, ApJ, 492, 190
- Alcock et al. (1999) Alcock, C., et al. 1999, PASP, 111, 1539
- Alcock et al. (2000) Alcock, C., et al. 2000, ApJ, 542, 257
- Alcock et al. (2003) Alcock, C., et al. 2003, ApJ, 598, 597
- Armandroff & Zinn (1988) Armandroff, T.E. & Zinn, R. 1992, AJ, 96, 92
- Bellazzini et. al (1999) Bellazzini, M., Ferraro, F., & Buonanno, R. 1999, MNRAS, 307, 619
- Blanco (1984) Blanco, B.M. 1984, AJ, 89, 1836
- Bono et al. (2007) Bono, G., Caputo, F., di Criscienzo, M. 2007, A&A, 476, 779
- Borissova et al. (2006) Borissova, J., Minniti, D., Rejkuba, M., & Alves, D. 2006, A&A 460, 459
- Butler (1975) Butler, D. 1975, ApJ, 200, 68
- Butler et al. (1976) Butler, D., Carbon, D., Kraft, R.P. 1976, ApJ, 210, 120
- Butler et al. (1978) Butler, D., Dickens, R.J, Epps, E. 1978, ApJ, 225, 148
- Cabrera-Lavers et al. (2007) Cabrera-Lavers, A., Hammersley, P. L., Gonzlez-Fernndez, C., Lpez-Corredoira, M., Garzn, F., Mahoney, T. J. 2007, A&A, 465, 825
- Clementini et al. (2005) Clementini, G. Gratton, R. Bragaglia, A., Ripepi, V., Fiorenzano, A.F.M., Held, E.V. & Carretta, E. 2005, ApJ, 630L, 145
- Collinge et al. (2006) Collinge, M.J., Sumi, T. & Fabrycky, D. 2006, ApJ, 651, 197
- Cseresnjes (2001) Cseresnjes, P. 2001, A&A, 375, 909
- Di Fabrizio et al (2005) Di Fabrizio, L., Clementini, G., Maio, M., Bragaglia, A., Carretta, E., Gratton, R., Montegriffo, P., & Zoccali, M. 2005, A&A 430, 603
- Dwek et al. (1995) Dwek, E., Arendt, R.G., Hauser, M.G., Kelsall, T., Lisse, C.M., Moseley, S.H., Silverberg, R.F., Sodroski, T.J. & Weiland, J. L. 1995, ApJ, 445, 716
- Eisenhauer et al. (2005) Eisenhauer, F., Genzel, R., Alexander, T., Abuter, R., Paumard, T., Ott, T., Gilbert, A., Gillessen, S., Horrobin, M., Trippe, S., Bonnet, H., Dumas, C., Hubin, N., Kaufer, A., Kissler-Patig, M., Monnet, G., Strőbele, S., Szeifert, T., Eckart, A., Schődel, R., & Zucker, S. 2005, ApJ, 628,
- Geisler et al. (1990) Geisler, D., & Friel, E.D. 1990, in ESO Conf. Ser., Bulges of Galaxies, eds. B. Jarvis & D.M. Terndrup, 77
- Gratton et al. (2004) Gratton, R. G., Bragaglia, A., Clementini, G., Carretta, E., Di Fabrizio, L., Maio, M. & Taribello, E. 2004, A&A 421, 937
- Gratton et al. (1986) Gratton, R.G., Tornambé, A., & Ortolani, S. 1986, A&A 169, 111
- Groenewegen et al. (2008) Groenewegen, M. A. T., Udalski, A., & Bono, G. A&A, 481, 441
- Harris (1996) Harris, W. 1996, AJ, 112, 1487
- Ibata et al. (1994) Ibata, R.A., Gilmore, G., & Irwin, M.J. 1994, Nature, 370, 194
- Ibata et al. (1997) Ibata, R.A., Wyse, R.F.G, Gilmore, G., Irwin, M.J., & Suntzeff, N.B. 1997, AJ, 113, 634
- Jurcsik & Kovács (1996) Jurcsik, J., & Kovács, G. 1996, A&A, 312, 111
- Kinemuchi et al. (2006) Kinemuchi, K., Smith, H.A., Woźniak, P.R., McKay, T.A., & The ROTSE Collaboration 2006, AJ, 132, 1202
- Kovács (2005) Kovács, G. 2005, A&A, 438, 227
- Kovács & Kanbur (1998) Kovács, G., & Kanbur, S. M. 1998, MNRAS, 295, 834
- Kovtyukh, Wallerstein & Andrievsky (2005) Kovtyukh, V.V., Wallerstein, G., & Andrievsky, S.M. 2005, PASP 117, 1173
- Kraft & Ivans (2003) Kraft, R.P. & Ivans, I. I. PASP, 115, 143
- Krauss & Chaboyer (2003) Krauss, L.M. & Chaboyer, B. 2003, Science, 299, 65
- Kunder et al. (2006) Kunder, A.M., Chaboyer, B., Popowski, P., Nikolaev, S., & Cook, K.H. 2006, ASPC 349, 273
- Kunder et al. (2008) Kunder, A.M., Popowski, P., Cook, K.H., & Chaboyer, B. 2008, AJ, 135, 631
- Layden & Sarajedini (2000) Layden, A. & Sarajedini, A. 2000, AJ, 119, 1760
- Lee et al. (2005) Lee, Y., Carney, B. Habgood, M.J. 2005, AJ, 129, 251
- Majewski et al. (2003) Majewski, S.R., Skrutskie, M.F., Weinberg, M.D. & Ostheimer J.C. 2003, ApJ, 599, 1082
- Marconi et al. (1998) Marconi, G., Buonanno, R., Castellani, M., et al. 1998, A&A, 330, 453
- Mateo et al. (1995) Mateo, M., Udalski, a. Szyma’nski, M., Kałużny, J., Kubiak, M. & Krzemiński, W. 1995, AJ, 109, 588
- Minniti (1996) Minniti, D. 1996, ApJ. 459. 175
- Minniti et al. (1995) Minniti, D., Olszewski, E. W., Liebert, J., White, S. D. M., Hill, J., & Irwin, M. 1995, MNRAS, 277, 1293
- Monaco et al. (2005) Monaco, L., Bellazzini, M., Ferraro, F. R., &Pancino, E. 2005, MNRAS, 356, 1396
- Nemec (2004) Nemec, J.M. 2004, AJ 127, 2185
- Olech et al. (2003) Olech, A., Kaluzny, J., Thompson, I.B. & Schwarzenberg-Czerny, A. MNRAS, 345, 86 62, 104
- Petersen (1986) Petersen, J.O. 1986, A&A, 170, 59
- Preston (1959) Preston, G.W. 1959, ApJ, 130, 507
- Pritzl et al. (2001) Pritzl, B. J., Smith, H. A., Catelan, M., & Sweigart, A. V. 2001, AJ, 122, 2600
- Pritzl et al. (2002) Pritzl, B. J., Smith, H. A., Catelan, M., & Sweigart, A. V. 2002, AJ, 124, 949
- Pritzl et al. (2003) Pritzl, B. J., Smith, H. A., Stetson, P.B., Catelan, M., Sweigart, A. V., Layden, A.C. & Rich, R.M. 2003, AJ, 126, 1381
- Rey et al. (2000) Rey, S., Young-Wook, L., Jong-Myung J., Walker, A., & Scott B. 2000, AJ, 119, 1824
- Rich (1998) Rich, R.M. 1998, AJ, 95, 828
- Rodgers (1974) Rodgers, A.W. 1974, ApJ, 191, 433
- Rodgers (1977) Rodgers, A.W. 1977, ApJ, 212, 117
- Sandage (1982) Sandage, A. 1982, ApJ, 252, 574
- Sandage (2004) Sandage, A. 2004, AJ, 128, 858
- Sandage et al. (1981) Sandage, A., Katem, B., & Sandage, M. 1981, ApJS, 46, 41
- Schwarzenberg-Czerny & Kałużny (1998) Schwarzenberg-Czerny, A., & Kałużny, J. 1998, MNRAS, 300, 251
- Simon & Clement (1993) Simon, N.R., & Clement, C.M. 1993, ApJ, 410, 526
- Simon & Lee (1981) Simon, N.R., & Lee, A.S. 1981, ApJ, 248, 291
- Sollima et al. (2006) Sollima, A., Borissova, J., Catelan, M., Smith, H. A., Minniti, D., Cacciari, C., & Ferraro, F. R. 2006, ApJ, 640, L43
- Stanek et al. (1994) Stanek K. Z., Mateo M., Udalski A., Szymanski M., Kaluzny J., Kubiak M., 1994, ApJ, 429,
- Stanek et al. (1996) Stanek, K. Z., Mateo, M., Udalski, A., Szymański, Kałużny, J., Kubiak, M., Krzemiński, W. 1996, IAUS, 169, 103
- Walker & Terndrup (1991) Walker, A.R., & Terndrup D.M. 1991, ApJ, 378, 119
- Wesselink (1987) Wesselink, T.J.H. 1987, Ph.D. thesis, Katholieke Univ. Nijmegen
- Zinn & West (1984) Zinn, R., & West, M.J. 1984, ApJS, 55, 45
- Zoccali et al. (2003) Zoccali, M., Renzini, A., Ortolani, S., Greggio, L., Saviane, I., Cassisi, S., Rejkuba, M., Barbuy, B., Rich, R.M., & Bica, E. 2003, A&A, 399, 931
| Star ID | Gal | Gal | Period | mag | mag | ||
|---|---|---|---|---|---|---|---|
| 101.20648.645 | 3.286 | -2.904 | 0.59006304 | 17.58 | 16.77 | -1.14 | 1.47 |
| 101.20649.500 | 3.357 | -2.820 | 0.57013899 | 17.11 | 16.46 | -1.34 | 3.78 |
| 101.20650.531 | 3.385 | -2.821 | 0.55754501 | 17.29 | 16.44 | -1.57 | 3.09 |
| 101.20650.965 | 3.363 | -2.829 | 0.50520098 | 18.38 | 17.57 | -1.40 | 0.65 |
| 101.20653.526 | 3.597 | -2.702 | 0.46992201 | 17.26 | 16.53 | -1.04 | 4.42 |
| Star ID | Gal | Gal | Period | mag | mag | ||
|---|---|---|---|---|---|---|---|
| 101.21175.1970 | 3.799 | -2.887 | 0.56146103 | 19.25 | 18.55 | -1.64 | 2.91 |
| 102.22720.1340 | 3.341 | -4.066 | 0.70013201 | 19.05 | 18.38 | -2.27 | 3.85 |
| 104.20510.6338 | 2.773 | -3.113 | 0.57012099 | 19.29 | 18.52 | -1.44 | 2.65 |
| 110.22187.2215 | 2.450 | -4.291 | 0.64345598 | 19.48 | 18.75 | -1.70 | 2.67 |
| 110.23227.1734 | 2.734 | -4.749 | 0.54225904 | 19.24 | 18.57 | -1.66 | 1.84 |