11email: kjhp@mssl.ucl.ac.uk
Highly Ionized Fe X-ray Lines at Energies 7.7–8.6 keV
Abstract
Context. Fe xxv lines at 1.85 Å (6.70 keV) and nearby Fe xxiv satellites have been widely used for determining the temperature of the hottest parts of solar flare and tokamak plasmas, though the spectral region is crowded and the lines are blended during flare impulsive stages.
Aims. The aim of this work is to show that similarly excited Fe lines in the 7.7–8.6 keV (1.44–1.61 Å) region have the same diagnostic capability with the advantage of not being so crowded.
Methods. Spectra in the 7.7–8.6 keV range are synthesized using the CHIANTI spectral package for conditions (temperature, turbulent velocities) appropriate to solar flares.
Results. The calculated spectra show that the Fe lines in the 7.7–8.6 keV are well separated even when turbulent velocities are present, and Fe xxiv/Fe xxv line ratios should therefore provide valuable tools for diagnosing flares and tokamak plasmas.
Conclusions. Fe lines in the 7.7–8.6 keV range are ideal for the measurement of flare temperature and for detecting the presence of low-energy nonthermal electrons present at flare impulsive stages. An indication of what type of instruments to observe this region is given.
Key Words.:
Line: identification – Plasmas – Sun: abundances – Sun: corona – Sun: flares – Sun: X-rays, gamma rays1 Introduction
The diagnostic potential of highly ionized iron lines at Å ( keV) was recognized by Gabriel (1972) who pointed out that Fe xxiv satellite lines with transitions (), with upper levels formed by dielectronic recombination of He-like iron (Fe+24), have fluxes which, relative to the Fe xxv resonance line () at 1.851 Å (6.699 keV), depend on electron temperature , roughly as . This has proved extremely useful for understanding the hottest parts of solar flare plasmas (Doschek, 1990) and tokamak plasmas (Bitter et al., 1979). The most intense satellites include (in the notation of Gabriel (1972)) (1.867 Å, 6.642 keV) and (1.864 Å, 6.652 keV) which are resolved from other nearby lines by crystal spectrometers with spectral resolution 0.001 Å (4 eV). The most intense satellites include the , pair at 1.852 Å (6.695 keV), which are on the long-wavelength side of line (Bely-Dubau et al., 1979a), while satellites are progressively less separated from the line (Bely-Dubau et al., 1979b). At the onset of solar flares, X-ray lines show a broadening which is commonly attributed to turbulence resulting from the impact of nonthermal electrons accelerated at the flare impulsive stage. The broadening may amount to 0.03 Å (0.11 keV, equivalent to a few hundred km s-1) which leads to a blurring of the satellite line structure, so determinations of temperatures become less certain. Also, satellites with on the long-wavelength side of the Fe xxv line including the , pair may be indistinguishable from . A method for searching for low-energy, nonthermal electrons proposed by Gabriel & Phillips (1979), involving the comparison of temperatures derived from the ratios and , is thus made difficult to apply. In addition to the turbulent broadening, a short-wavelength (“blue-shifted”) component is generally present for disk flares, making the determination of temperatures from line flux ratios even less certain.
While the spectral region 1.851–1.940 Å (6.391–6.699 keV), which includes all dielectronic satellites emitted by Fe xxiv and lower ionization stages of Fe, has been very well studied with high-resolution spectrometers, the region 1.44–1.60 Å (7.7–8.6 keV) has hardly received any attention. This range contains higher- Fe xxv lines with transitions (, 4, 5 etc.) and associated Fe xxiv satellites with transitions () which are well separated from each other, even when turbulent velocities of a few hundred km s-1 are present. The purpose of this paper is to point out that these lines are more suitable for the determination of temperatures from the hottest part of solar flares, and may prove particularly useful for searching for nonthermal electrons during flare impulsive stages.
2 Spectral region 7.7 - 8.6 keV
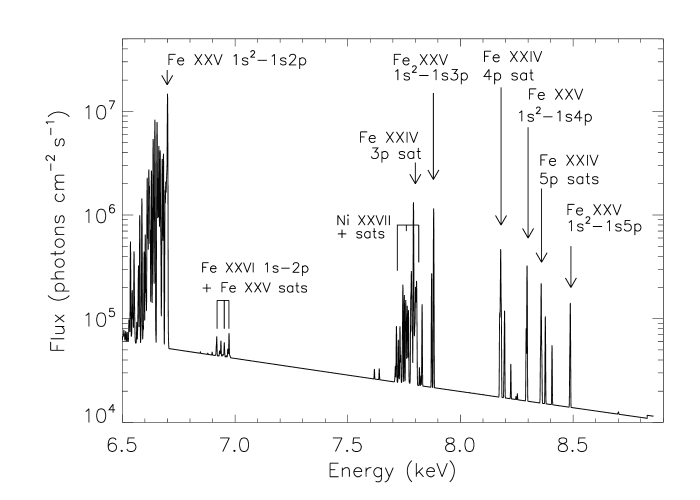
A selection of lines in the spectral range 7.7–8.6 keV is given in Table 1. The principal Fe xxv lines with transitions (, 4, 5) are labelled , , , and the much weaker subsidiary lines with transitions are labelled , , , following nomenclature of Phillips et al. (2006a) for corresponding Si lines observed with the RESIK spectrometer on CORONAS-F. Wavelengths (Å) and photon energies (keV) are listed, the data being from Phillips (2004) and the CHIANTI database and software (Dere et al., 1997; Landi et al., 2006) (v. 5.2.1). (Note that from hereon, we specify lines by photon energies in keV.) Figure 1 shows a synthetic spectrum (logarithmic flux scale) in the range 6.5–8.8 keV, so includes the Fe xxv line and associated Fe xxiv satellites. The spectrum was synthesized using CHIANTI (v. 5.2.1), and assumes coronal excitation and ionization conditions and coronal abundances from Feldman et al. (1992) (these are negligibly different from those of the later work of Feldman & Laming (2000)). The effective collisional excitation rates used in CHIANTI for the Fe xxv and Ni xxvii lines are from the intermediate-coupling calculations including auto-ionizing resonances of Zhang & Sampson (1987). The principal Fe xxv lines with transitions (, 4, 5) are important in the 7.7–8.5 keV region, as are groups of Fe xxiv satellites with transitions () covering small energy ranges. In Fig. 1 they are labelled “3p sat”, “4p sat”, “5p sat”. The energy of each satellite group is approximately 0.15–0.17 keV less than that of the corresponding “parent” Fe xxv line with transition . Also present are Ni xxvii lines, including line , and associated Ni xxvi () satellites, blending with the group of Fe xxiv satellites. The temperature assumed in Figure 1 is MK, a typical peak flare temperature measured from the Fe lines near 6.7 keV. For higher temperatures, the Fe xxiv satellites (labelled 3p, 4p, 5p) are correspondingly less intense than the corresponding Fe xxv parent lines.
| Energy (keV) | Wavelength (Å) | Ion | Line label | Transition | Fluxa |
|---|---|---|---|---|---|
| 7.7573 | 1.598 | Ni XXVI | 285 | ||
| 7.7822 | 1.593 | Fe XXIV | 520 | ||
| 7.7915 | 1.591 | Fe XXIV | 2810 | ||
| 7.7924 | 1.591 | Fe XXIV | 370 | ||
| 7.8052 | 1.589 | Ni XXVII | 409 | ||
| 7.8721 | 1.575 | Fe XXV | 589 | ||
| 7.8811 | 1.573 | Fe XXV | 2650 | ||
| 8.1785 | 1.516 | Fe XXIV | 1030 | ||
| 8.1812 | 1.516 | Fe XXIV | 230 | ||
| 8.2917 | 1.495 | Fe XXV | 151 | ||
| 8.2956 | 1.495 | Fe XXV | 724 | ||
| 8.3554 | 1.484 | Fe XXIV | 83 | ||
| 8.3582 | 1.483 | Fe XXIV | 473 | ||
| 8.3610 | 1.483 | Fe XXIV | 68 | ||
| 8.3763 | 1.480 | Fe XXIV | 87 | ||
| 8.3768 | 1.480 | Fe XXIV | 132 | ||
| 8.4064 | 1.475 | Fe XXIV | 95 | ||
| 8.4852 | 1.461 | Fe XXV | 63 | ||
| 8.4875 | 1.461 | Fe XXV | 296 |
Each group of Fe xxiv satellites in the 7.7–8.6 keV range is not only fairly widely separated from its parent line, but is dominated by one particular satellite, with transition . The next most intense satellite, with transition , is at least a factor 2 less intense. The grouping of such satellites in Si was noted by Sylwester et al. (2003) and in laboratory spectra by Feldman et al. (1974).
There are very few solar flare observations of the spectral region 7.7–8.6 keV, but one, reported by Neupert (1971), was made during a large (optical class 2B) flare on 1969 February 27. The spectral range in question was covered by a crystal spectrometer using LiF crystal ( Å). The spectrum shows a prominent line feature at keV ( Å, assuming a linear wavelength scale in the figure shown by Neupert (1971)), and although identified as Ni xxvii it is more likely to be the Fe xxv () line. Broad-band flare spectra in this region have been observed by the PIN (solid-state detector) part of the X-ray Spectrometer (XRS) on the Near Earth Asteroid Rendezvous (NEAR)–Shoemaker spacecraft (Goldsten et al., 1997) with spectral resolution of 600 eV at 5.9 keV. At this resolution, the 6.7 keV line feature, which includes the Fe xxv line and satellites, is unresolved as the “Fe-line feature”, while the higher- Fe xxv lines and associated Fe xxiv satellites appear as a broad structure, with the group of lines at keV barely resolved from the lines at 8.2–8.5 keV. This can be seen from the spectrum shown in Figure 2 taken during a large flare on 1998 January 15. Superimposed on the NEAR-PIN spectrum, which extends over the range 1.2–9.7 keV, are spectra from the Yohkoh Bragg Crystal Spectrometer (BCS) which had narrow spectral windows centred on groups of lines due to He-like S (S xv), Ca (Ca xix), and Fe (Fe xxv). BCS calibration factors were taken from data given by Culhane et al. (1991) and incorporated in standard IDL BCS analysis software. The continuum levels in the BCS and NEAR-PIN spectra are within 40 % (the BCS peak fluxes of the lines are much higher than the corresponding bumps in the NEAR-PIN spectra owing to the higher spectral resolution of the BCS).
Other broad-band spectral observations are available from the Reuven Ramaty High-Energy Solar Spectroscopic Imager (RHESSI) with energy range keV to 17 MeV (Lin et al., 2002). For seven of its nine detectors in the 4–10 keV range the spectral resolution is about 1 keV. During the onset of a solar flare, attenuators are inserted over the detectors so that the attenuator states during a large flare go from A0 (no attenuator), through A1 (thin attenuators inserted) to A3 (thin and thick attenuators inserted). The Fe-line feature is generally clearly visible in A1 and A3 spectra, analysis of which has led to coronal Fe abundance determinations (Phillips et al., 2006b). In A3 spectra, an emission line feature at keV is tentatively attributed to the cluster of Fe xxv lines, Fe xxiv satellites, and Ni xxvii lines to form the “Fe/Ni-line feature”, though the nearby Fe-line (6.7 keV) feature and an instrumental line feature at keV makes this line feature difficult to measure.

3 Diagnostic potential of lines
3.1 Temperature estimates
Figure 3 shows spectra synthesized from CHIANTI in the 7.7–8.6 keV range (linear flux scale) for MK, 20 MK, and 25 MK, typical of moderate to very intense solar flares. The spectral resolution chosen was equal to the thermal Doppler width (FWHM) for ion temperature equal to , i.e. eV, 3.5 eV, and 3.9 eV respectively. The Fe xxiv satellites with transitions are labelled , , and for , 4, 5, by analogy with the Fe xxiv satellite ( at 6.642 keV. Clearly, the fluxes of the Fe xxiv satellites relative to the corresponding Fe xxv , , and lines decrease as increases.

Excitation of the satellite lines proceeds by dielectronic recombination of the He-like stage, Fe+24. This occurs first by dielectronic capture:
| (1) |
(the left arrow indicating that the reverse, autoionization process may occur), followed by stabilizing transitions:
| (2) |
where . If the configuration is , , the transition energy of one of the satellite lines in the , or groups.
The satellite line flux is then proportional to the density of electrons and Fe+24 ions, to the dielectronic capture rate which by the principle of detailed balance is proportional to ( the auto-ionization rate), and to a branching ratio indicating the relative probability of a radiative transition occurring after the dielectronic capture process in Eq. 1 (see Gabriel (1972)). It is also proportional to where is the excitation energy of the doubly excited configuration above the Fe+24 ground state ( is Boltzmann’s constant). Thus
| (3) |
The flux of the corresponding Fe xxv parent line, transition , which is mostly collisionally excited from the ground state, is
| (4) |
where is the collisional rate coefficient, corrected by a factor to allow for high- satellites blending with the parent line. is approximately given by
| (5) |
where is the effective collision strength of the transition, a slowly varying function of , and is the parent line excitation energy. Thus, the flux ratio
| (6) |
where the constant includes all atomic constants. For typical flare temperatures, is rather small compared with so the satellite line-to-parent line flux ratio is close to . Incidentally, for these satellites at solar flare densities ( cm-3), inner-shell excitation of the upper levels, e.g. from the , levels, does not contribute significantly owing to the small population of these levels at solar flare densities.

Figure 4 shows the line ratios of , , satellite groups to their corresponding parent lines plotted against (ratio scale logarithmic). The Fe xxiv satellites have been taken to be all those within 4 eV of the , , satellite which is the one that dominates each satellite group , , . Thus, measurements of the line ratios are assumed to be made with an instrument having a spectral resolution eV. The ratios have again been estimated from line fluxes given by CHIANTI. The Fe xxv parent lines have been taken to include both the allowed and intercombination lines , (transitions , ), but not unresolved satellites with which are not included in CHIANTI. The fall-off of the ratio is not quite as owing to the slight temperature variation of the factor.
The Fe xxiv satellite group is blended with the Ni xxvii lines and associated Ni xxvi satellites, and this needs to be taken account of in Fig. 4. The dotted line shows the ratio of the Fe xxiv satellite group with the Ni lines occurring within 4 eV of the Fe xxiv line. The Fe/Ni coronal abundance is 18 (Feldman & Laming, 2000), so the contribution of the Ni lines is always small, increasing with .
Although the satellites in the 7.7–8.6 keV range would appear to have little advantage in the measurement of flare temperatures over that provided by the lines in the 6.7 keV range, the larger separation of the , , and satellites from their parent lines means that they are always much better resolved than the satellites near the line at 6.70 keV. Figure 5 illustrates how at the flare impulsive stage a spectrometer with good resolution – in this case the BCS on SMM – only partly resolves the satellite line structure in the range 6.60–6.69 keV, including the Fe xxiv and lines. Fig. 5 () is the BCS spectrum during the impulsive stage of a limb flare on 1980 June 29. Although there is no significant blue-shifted component, the presence of turbulence means that the and lines are sufficiently smeared with neighbouring satellites that temperature estimation must be uncertain. A few minutes later (Fig. 5 ()), the satellite lines are well resolved and temperatures can be accurately estimated. However, the temperature during the impulsive stage is of more importance for comparison with flare models involving electron beam fluxes for which temperature, bulk and turbulent velocities are predicted. Figure 6 shows CHIANTI simulations of the 7.7–8.6 keV region. In panel (), the spectral resolution is 8 eV, equivalent to the 170 km s-1 turbulent velocity that is estimated from SMM BCS analysis software for the spectrum in Fig. 5 (); in panel (), the spectral resolution is 6 eV, equivalent to the smaller turbulent velocity (130 km s-1) in Fig. 5 (). In both cases, the , , and satellite groups are well resolved from their parent lines. In the case of Fig. 5 (), an estimate of the Ni xxvii line contribution to the Fe xxiv satellites could be made by line-fitting techniques.


3.2 Low-energy nonthermal electrons
The method of Gabriel & Phillips (1979) to search for nonthermal electrons with energy of a few keV relies on the comparison of temperature measurements using the , , and line ratios. Figure 7 shows (right side) the energy level diagram for Li-like Fe (Fe+23) and (left side) He-like Fe (Fe+24) plus a free electron. Transitions forming the Fe xxv , , , and lines are shown. The excitation energies of the upper levels of these lines are indicated on the energy scale shown on the left-side of the diagram (energy of the ground state equal to 0). Also shown is a Maxwell-Boltzmann distribution appropriate to the free electron for MK, a typical peak flare temperature. Excitation of any of the Fe xxiv satellites occurs by dielectronic capture of the free electron to give the doubly excited upper levels of the satellites , , , , ( …5). The free electron must have energies (to within the auto-ionizing widths, eV) of 4.68 keV, 5.81 keV, 6.20 keV, and 6.38 keV for the excitation of the …5 levels respectively. De-excitation occurs from the levels either to the level or to the level. Taking the case , the transition corresponds to the satellite at 6.694 keV, the transition to the satellite at 7.792 keV. Note that the line (transition ) is blended with , and has a flux of .
Formation of the doubly excited states by dielectronic capture “samples” the Maxwell-Boltzmann distribution at energies 4.68 keV, 5.81 keV, 6.20 keV, and 6.38 keV. The method of Gabriel & Phillips (1979) was to estimate from the ratio () or from the ratio () and compare with the temperature from the ratio (). If the flaring plasma can be assumed to be isothermal but if and are significantly higher than , nonthermal electrons may be implied at higher energies, e.g. keV, as are commonly deduced from hard X-ray spectra during the flare impulsive stage. If the number of nonthermal electrons is insignificant at energies less than the threshold energy of the line excitation (6.702 keV), temperature is the true flare temperature (again, on the isothermal assumption) since it is measured by the numbers of electrons at energies 4.68 keV and 5.81 keV (upper levels of and ).
In practice, it has been found that, at the flare impulsive stage when nonthermal electrons are expected to be present, line broadening due to turbulence is such that the satellite feature is blended with line (see the SMM BCS spectrum, Fig. 5 ()). However, some success in applying the Gabriel & Phillips (1979) method has been achieved using synthetic spectra to match observed spectra during flare impulsive stages by Seely et al. (1987). These authors used nonthermal electron distributions of the form
| (7) |
where is the gamma function. When the parameter , reduces to the Maxwell-Boltzmann distribution with . The flux ratios , , and can be related to expressions that are functions of and . The Fe xxv and Fe xxiv lines at keV were observed with the SOLFLEX instrument on P78-1 during three flares, with hard X-ray bursts at the impulsive stages independently indicating the presence of nonthermal electrons. Very high values of () were derived in the impulsive stages which decreased to during the flare thermal phases. Seely et al. (1987) attribute these to departures from Maxwell-Boltzmann distributions and not to non-isothermal (differential emission measure) effects since the feature is expected to be excited by more energetic electrons than the satellite but during the flare impulsive stage the feature is actually enhanced relative to .
Clearly, observation of the Fe xxiv , , and satellite groups in the 7.7–8.6 keV region have the distinct advantage of not suffering from blending with their parent lines, even during flare impulsive stages, as well as the fact that for typical flare temperatures (15–20 MK) the satellites have comparable fluxes to the parent lines. This is illustrated by the SMM BCS spectra for a limb flare shown in Figure 5 (), in which the weak line feature is completely blended with the Fe xxv line , but for the same amount of line broadening for the 7.7–8.6 keV range all the satellite groups show as strong features well separated from the parent lines. Note that for disk flares, a short-wavelength component attributed to rising plasma would give rise to increased blending with the 6.7 keV lines at the resolution of the BCS. Even a spectrometer with perfect spectral resolution would have blending problems for the 6.7 keV line group because of the presence of turbulence-broadened lines and short-wavelength components.
Thus the , , and satellite line groups are available for searching for nonthermal electrons since the upper levels of the satellites in each group are excited by mono-energetic electrons. In the case of the , , and satellites (see Figure 7), the upper levels are , , 4, 5, with excitation energies 5.81 keV, 6.20 keV, 6.38 keV respectively. The method of Gabriel & Phillips (1979) can therefore be applied to these three satellites which are in practice always strong relative to the Fe xxv parent lines and well resolved, even during flare impulsive stages.

4 Future observations
The 7.7–8.6 keV range has not been selected for solar flare spectrometers in the past presumably because the Fe xxv lines are appreciably weaker than the very strong Fe xxv line at 6.70 keV – CHIANTI simulations indicate that for a temperature 20 MK, with the line having unit total flux (photon units), the , , and lines have total fluxes of 0.08, 0.02, 0.01. However, as is shown here, the diagnostic potential of this range is considerable, and only modest spectral resolution is needed to obtain line flux ratios to obtain the temperatures of the hottest regions of flares and information about low-energy nonthermal electrons. Spectra in this region could also be of importance for diagnosis of tokamak plasmas.
The range is available to crystal spectrometers, particularly those with bent geometries such as were used for the SMM Bent Crystal Spectrometer and the Yohkoh Bragg Crystal Spectrometer since their effective areas are much higher than equivalent scanning flat crystal spectrometers. Possible diffracting crystals include germanium (Ge 422), with spacing equal to 2.31 Å, though its integrated reflectivity is a factor 2 lower in the required range than at 6.70 keV, and lithium fluoride, LiF (420) with Å. The development of X-ray microcalorimeters (instruments sensing tiny heat pulses created by incident X-ray photons) offers some possibilities for observing this range. The recent X-ray Spectrometer (XRS) on the Suzaku spacecraft (Kelley et al., 2007) consisted of an array of microcalorimeters, and was designed to observe non-solar sources in the spectral range 0.3–12 keV with a resolution of only 6 eV, easily enough to resolve the Fe xxiv satellite line structure at 6.55–6.70 keV. Although it did not successfully make any observations owing to an early loss of liquid helium cryogen needed to maintain a temperature of 60 mK, the designed spectral resolution was apparently achieved (Kelley et al., 2007). An instrument like this, capable of observing the 7.7–8.6 keV region with a time resolution high enough to follow the hard X-ray bursts at the onset of solar flares, would be ideal for the temperature determination of the hottest parts of the flare plasma and detection of nonthermal electrons.
Acknowledgements.
I am grateful for helpful discussions with Janusz Sylwester (Polish Academy of Sciences, Wrocław, Poland) and Brian Dennis (NASA Goddard Space Flight Center), and for permission to use NEAR-Shoemaker PIN data granted by Richard Starr (GSFC). CHIANTI is a collaborative project involving Naval Research Laboratory (USA), University College London and Cambridge University (UK), George Mason University (USA), and Florence University (Italy).References
- Acton et al. (1980) Acton, L. W., et al. 1980, Solar Phys., 65, 53
- Bely-Dubau et al. (1979a) Bely-Dubau, F., Gabriel, A. H., & Volonté, S. 1979, MNRAS, 186, 405
- Bely-Dubau et al. (1979b) Bely-Dubau, F., Gabriel, A. H., & Volonté, S. 1979, MNRAS, 189, 801
- Bitter et al. (1979) Bitter, M., et al. 1979, Phys. Rev. Lett., 43, 129
- Culhane et al. (1991) Culhane, J. L., et al. 1991, Solar Phys., 136, 89
- Dere et al. (1997) Dere, K. P., Landi, E., Mason, H. E., Monsignori Fossi, B. C., & Young, P. R. 1997, A&AS, 125, 149
- Doschek (1990) Doschek, G. A. 1990, ApJ, 73, 117
- Feldman et al. (1974) Feldman, U., Doschek, G. A., Nagel, D. J., Cowan, R. D., & Whitlock, R. R. 1974, ApJ, 192, 213
- Feldman & Laming (2000) Feldman, U., & Laming, J. M. 2000, Phys. Scripta, 61, 222
- Feldman et al. (1992) Feldman, U., Mandelbaum, P., Seely, J.L., Doschek, G.A., Gursky H. 1992, ApJSS, 81, 387
- Gabriel (1972) Gabriel, A. H. 1972, MNRAS, 160, 99
- Gabriel & Phillips (1979) Gabriel, A. H., & Phillips, K. J. H. 1979, MNRAS, 189, 319
- Goldsten et al. (1997) Goldsten, J. O., et al. 1997, Space Sci. Rev., 82, 169
- Kelley et al. (2007) Kelley, R. L., et al. 2007, PASJ, 59, S77
- Landi et al. (2006) Landi, E., Del Zanna, G., Young, P. R., Dere, K. P., Mason, H. E., & Landini, M. 2006, ApJS, 162, 261
- Lin et al. (2002) Lin, R. P., et al. 2002, Solar Phys., 210, 3
- Neupert (1971) Neupert, W. M. 1971, Solar Phys., 18, 474
- Phillips (2004) Phillips, K. J. H. 2004, ApJ, 605, 921
- Phillips et al. (2006a) Phillips, K. J. H., Dubau, J., Sylwester, J., & Sylwester, B. 2006a, ApJ, 638, 1154
- Phillips et al. (2006b) Phillips, K. J. H., Chifor, C., & Dennis, B. R. 2006b, ApJ, 647, 1480
- Seely et al. (1987) Seely, J. F., Feldman, U., & Doschek, G. A. 1987, ApJ, 319, 541
- Sylwester et al. (2003) Sylwester, J., Sylwester, B., Culhane, J. L., Doschek, G. A., Oraevsky, V. N., & Phillips, K. J. H. 2003, in Proc. ISCS Symp. (ESA SP-535; Noordwijk: ESA), 733
- Tanaka (1982) Tanaka, K., Watanabe, T., Nishi, K., & Akita, K. 1982, ApJ, 254, L59
- Zhang & Sampson (1987) Zhang, H., & Sampson, D. H. 1987, ApJS, 63, 487