The UV luminosity function and star formation rate of the Coma cluster.
Abstract
We present estimates of the GALEX near-ultraviolet (NUV) and far-ultraviolet (FUV) luminosity functions (LFs) of the Coma cluster, over a total area of 9 deg2 (25 Mpc2), i.e. from the cluster center to the virial radius. Our analysis represents the widest and deepest UV investigation of a nearby cluster of galaxies made to date. The Coma UV LFs show a faint-end slope steeper than the one observed in the local field. This difference, more evident in NUV, is entirely due to the contribution of massive quiescent systems (e.g. ellipticals, lenticulars and passive spirals), more frequent in high density environments. On the contrary, the shape of the UV LFs for Coma star-forming galaxies does not appear to be significantly different from that of the field, consistently with previous studies of local and high redshift clusters. We demonstrate that such similarity is only a selection effect, not providing any information on the role of the environment on the star formation history of cluster galaxies. By integrating the UV LFs for star-forming galaxies (corrected for the first time for internal dust attenuation), we show that the specific star formation rate (SSFR) of Coma is significantly lower than the integrated SSFR of the field and that Coma-like clusters contribute only 7% of the total SFR density of the local universe. Approximately 2/3 of the whole star-formation in Coma is occurring in galaxies with M1010 M⊙. The vast majority of star-forming galaxies has likely just started its first dive into the cluster core and has not yet been affected by the cluster environment. The total stellar mass accretion rate of Coma is (0.6-1.8) 1012 M⊙ Gyr-1, suggesting that a significant fraction of the population of lenticular and passive spirals observed today in Coma could originate from infalling galaxies accreted between 1 and 0.
keywords:
galaxies: clusters:individual: Coma (Abell1656)–galaxies: fundamental parameters–galaxies: evolution–galaxies: luminosity function–ultraviolet: galaxies1 Introduction
Star formation is probably the most fundamental of all astrophysical processes regulating galaxy evolution: not only the properties of galaxies depend on how their stars were formed, but the properties of the interstellar medium (ISM) are controlled to a large extent by the various feedback effects of star formation. The overall evolution of galaxies depends on the rate at which their interstellar gas is converted into stars and the star formation rate (SFR) depends on the rate at which diffuse interstellar matter is collected into star forming regions. Consequently, it is of great importance for galaxy evolution studies to understand how stars form and what determines their properties.
The cluster environment is well known to affect both the star formation activity and morphology of the member galaxies, resulting in the morphology-density (e.g. Dressler 1980; Whitmore et al. 1993) and star formation-density (e.g. Lewis et al. 2002; Gómez et al. 2003; Gavazzi et al. 2002b; Boselli & Gavazzi 2006) relations. The scale over which the number density of elliptical galaxies increases toward the center of rich clusters is very small ( 0.5 Mpc), while the one over which the star formation activity and the fraction of late-type galaxies decrease is much larger (a few Mpc). This indicates that separate processes contribute to shaping these relations. The mechanism involved in the early-type central enhancement is probably connected to the early phases of structure formation (e.g. De Lucia et al. 2006; Ellis et al. 1997; Stanford et al. 1998; Renzini 2006), while the progressive quenching of the star formation and lack of spirals toward the center of rich clusters could represent a separate, diluted in space and time, process probably related to the cluster accretion history (e.g. Dressler 2004; Boselli & Gavazzi 2006; Cortese et al. 2006b; Poggianti et al. 2006).
Although the effects of the environment on the star formation activity of cluster galaxies are gradually being unveiled (e.g. Boselli & Gavazzi 2006; Boselli et al. 2006; Dressler 2004; Moore et al. 1996; Poggianti et al. 1999, 2006; Vollmer et al. 2001), we still know very little about the contribution of clusters of galaxies to the whole star formation history (SFH) and the stellar mass growth of the universe. The cosmic SFR dramatically decreases from z1 to the present epoch (Lilly et al. 1996; Madau et al. 1996), but we do not know if this drop varies with the environment (Kodama & Bower 2001; Cooper et al. 2008; Finn et al. 2008), what fraction of the cosmic SFR takes place in cluster galaxies and how this number evolves with redshift.
In addition, a significant increase from 1 to 0 in the stellar mass density of the universe has been observed (e.g. Borch et al. 2006; Drory et al. 2005; Fontana et al. 2006). Interestingly very little growth is found in the stellar mass of blue sequence galaxies, and the vast majority of stars formed since 1 appears to inhabit galaxies which, at the present epoch, lie in the red sequence (e.g. Cimatti et al. 2006; Bell et al. 2007; Brown et al. 2007; Faber et al. 2007). This automatically implies that a significant fraction of star-forming galaxies has migrated from the blue to the red sequence. The mechanism responsible for the quenching of the star formation in blue galaxies is still unknown and remains one of the greatest challenges for modern extragalactic astronomy. However, it is interesting to note that a similar migration, from star-forming to passive galaxies, is usually observed in high density environments (e.g. Boselli et al. 2008), perhaps suggesting that the environment might play an important role.
In order to clarify these issues, it is therefore crucial to quantify the contribution of galaxy clusters to the total SFR and stellar mass budget of the universe, and their evolution with redshift.
To reach this goal we need to determine the SFR, luminosity and mass functions of the cluster population up to the virial radius, avoiding bias in our determination of the global cluster properties by observing a population that is not representative of the whole cluster environment.
This kind of study has become possible only recently thanks to the advent of wide field surveys.
In particular, the Galaxy Evolution Explorer (GALEX, Martin et al. 2005) is providing for the first time precise UV photometry of galaxies over large stretches of the sky, opening a new era of extragalactic UV astronomy.
The UV emission is dominated by young stars of intermediate masses (25 M⊙, e.g. Kennicutt 1998) and thus represents an ideal tracer to identify and quantify the star formation activity of clusters.
Surprisingly, very few statistical studies of galaxy clusters in UV have been carried out so far and great part of what we know
about UV properties of cluster galaxies is still based on pioneering observations by the FAUST telescope (e.g. Deharveng et al. 1994; Brosch et al. 1997)
and the balloon-borne UV telescopes SCAP and FOCA (e.g. Andreon 1999; Cortese et al. 2003a; Donas et al. 1987, 1995).
For example, we still lack an accurate
determination of the UV LFs in high density environments.
The FOCA UV LFs were in fact affected by large statistical errors due to the insufficient redshift coverage for UV-selected galaxies and to the uncertainty in the UV background counts.
Moreover, the only GALEX UV LF for a nearby cluster presented so far (Abell1367, Cortese et al. 2005) does not sample the whole cluster region and suffers from low number statistics at high luminosities.
Thus, in order to investigate the UV properties of nearby clusters we carried out a wide panoramic survey in near-ultraviolet (NUV) and far-ultraviolet (FUV) of the nearby Coma cluster of galaxies.
Coma (Abell 1656) is one of the nearest richest clusters, and it is considered
as the prototype of evolved, relaxed cluster of galaxies.
In the last decades, it has been one of the main laboratory for environmental studies at all
wavelengths (e.g. see Boselli & Gavazzi 2006 and references therein)
and more recently it has become the focus of a Hubble/ACS Treasury survey
(Carter et al. 2008) making it an ideal target for a deep census of UV properties in a nearby cluster up to
its virial radius.
In this paper, we present the determination of the near-ultraviolet (NUV) and far-ultraviolet (FUV) LFs, the total SFR of the Coma cluster and its contribution to the SFR density in the local universe.
We assume a distance modulus of = 35.0 mag for the Coma cluster, corresponding to a distance of 100 Mpc and a scale of 1.67 Mpc deg-1 for =70 Mpc-1 km s-1.
2 The Data
GALEX provides FUV ( = 1539 Å, = 442 Å) and NUV ( = 2316 Å, = 1069 Å) images with a circular field of view of 0.6 deg radius. The spatial resolution is 4-5 arcsec. Details of the GALEX instrument can be found in Martin et al. (2005) and Morrissey et al. (2005, 2007).
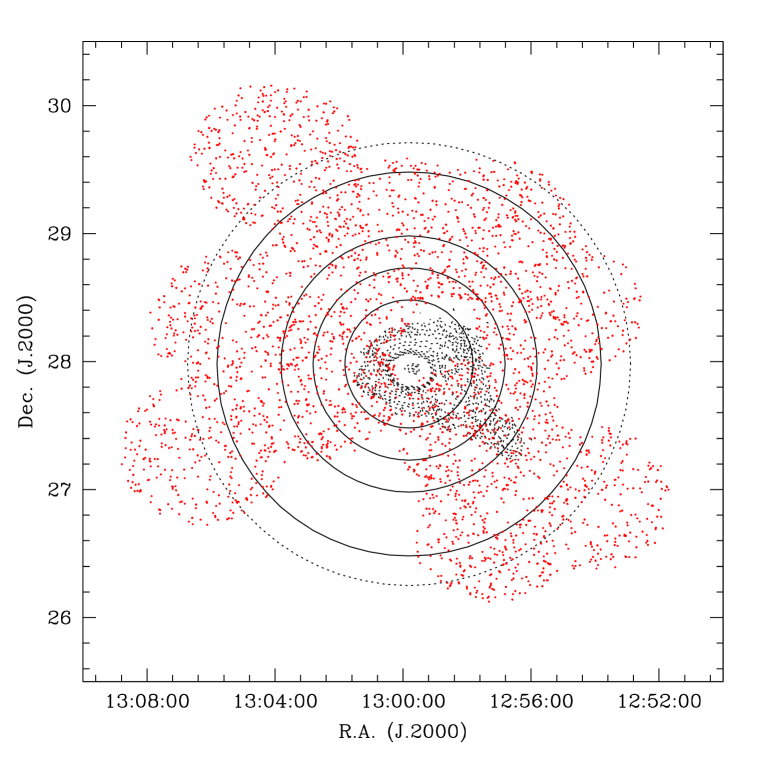
The data analyzed in this paper are part of a Cycle 1 Guest Investigator proposal (P.I. G. Gavazzi, proposal number: GI1-039). Twelve pointings have been originally approved but only 9 have been completed so far. In addition, in order to increase the GALEX coverage of the Coma cluster, we include in our analysis two more fields publicly available as part of the Nearby Galaxy Survey: NGC_DDO154 and Coma_SPECA. The coordinates and exposure times of the 11 fields are shown in Table 1. Their typical exposure time is 1500 sec in FUV and it varies between 1500 and 3000 sec in NUV. The total area covered is 9 deg2 (see Fig. 1). The major limitation of these observations is that they do not include the center of Coma. The presence of an UV bright star near the cluster center makes this region unobservable in NUV. FUV observations of this region are present in the GALEX schedule but they have not yet been executed. The total area not observed near the center of Coma is 0.26 deg2 (see Fig. 1).
Each field has been reduced using the standard GALEX Data Analysis Pipeline (Morrissey et al. 2007). Sources were detected and measured using SExtractor (Bertin & Arnouts 1996). As the NUV images are significantly deeper than the FUV images, sources were selected, and their parameters determined, in the NUV. FUV parameters were extracted within the same apertures. To avoid artifacts present at the edge of the field, we considered only the central 0.58 deg radius from the field center. We used a variable SExtractor deblending parameter contrary to the standard GALEX pipeline, providing reliable magnitudes (MAGAUTO) also for very extended sources (Cortese et al. 2005). By comparing the flux estimates for objects detected in more than one field we find an average uncertainty in the NUV and FUV magnitudes of 0.15 mag. This value decreases to 0.07 magnitudes for objects brighter than (NUV)19 mag. Magnitudes are corrected for Galactic extinction using the Schlegel et al. (1998) reddening map and the Galactic extinction curve of Cardelli et al. (1989). The applied extinction corrections are 0.09 and 0.08 mag for the NUV and FUV bands, respectively. The 100% completeness limit for a typical exposure time of 1500 sec is 21.5 in both FUV and NUV (Xu et al. 2005). However, in this work we will consider only objects brighter than 21 mag, because the poor redshift completeness makes impossible to investigate the properties of the LF at fainter luminosities.
The GALEX resolution is not sufficient to accurately separate stars and galaxies. To address this issue we matched the GALEX catalog against the SDSS-DR6 (Adelman-McCarthy et al. 2008) observations of the Coma cluster. Stellar objects and artifacts in the SDSS plates are sometimes erroneously present in both star and galaxy SDSS catalogue. For this reason, firstly we cross-matched our sample with the SDSS stellar catalogue using a search radius of 6 arcsec; secondly we cross-correlated the remaining UV detections with the SDSS galaxy catalogue, using the same impact parameter. Finally we cross-matched our catalogue with NED in order to obtain additional redshifts for the UV selected sample. A total number of 762 galaxies in FUV and of 1640 galaxies in NUV with 21 mag have been detected in the 9 deg2 analyzed in this work.
3 The NUV and FUV luminosity functions
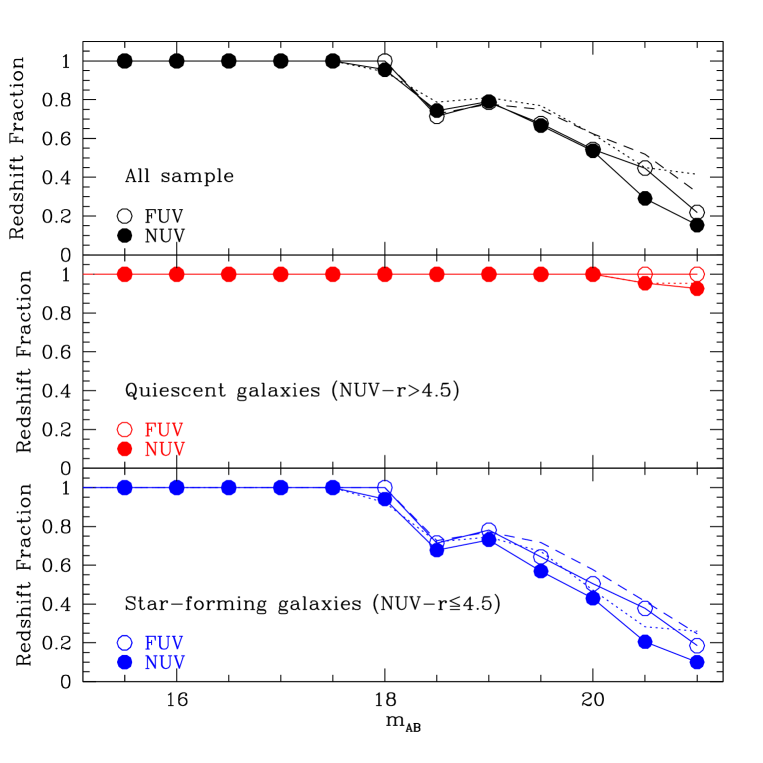
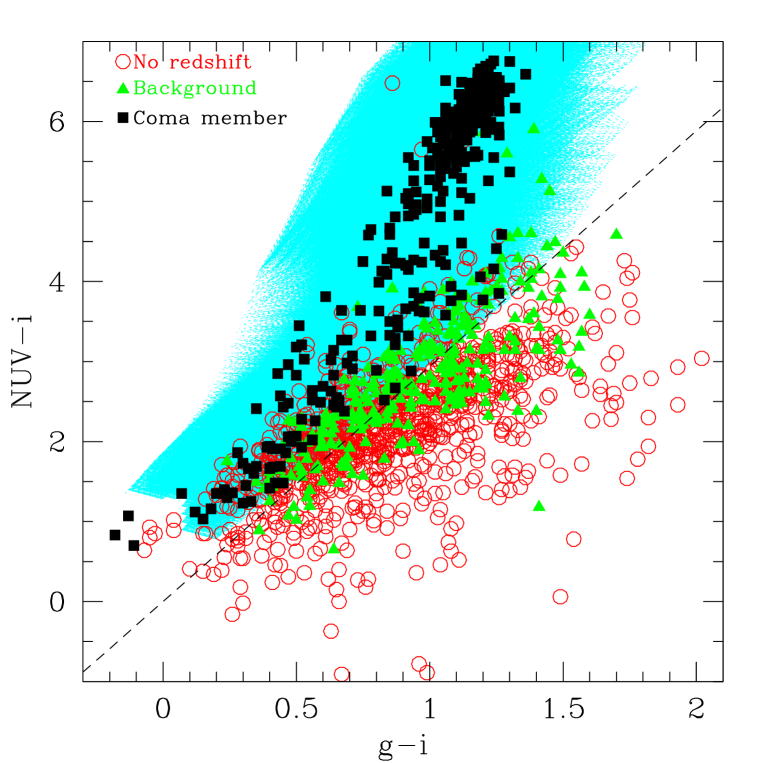
The determination of the cluster UV LF requires a reliable estimate of the contribution from background/foreground objects to the UV counts. This can be accurately obtained for 18.0, since at this limit our redshift completeness is 90% (see Fig. 2). The redshift completeness drops rapidly at fainter magnitudes, thus requiring a statistical estimate of the contamination. Three different methods have been here adopted for the computation of the cluster LFs. The first one is based on the statistical subtraction of field galaxies, per bin of UV magnitude, that are expected to be randomly projected onto the cluster area, as derived by Xu et al. (2005). In the second one, cluster members are identified on morphological grounds. Although sometimes subjective, in particular in the case of faint and/or compact objects, this technique can be applied to nearby clusters of galaxies when the redshift coverage is inadequate (e.g. Sandage et al. 1985; Ferguson & Sandage 1988; Trentham & Tully 2002). To do so, we have visually inspected SDSS-RGB images and we have used the criteria discussed in Binggeli et al. (1985) to discriminate between Coma and background galaxies. In ambiguous cases, we adopted the colour cut described below to select possible cluster members. The third one is the completeness-corrected method proposed by De Propris et al. (2003). This method is based on the assumption that the spectroscopic sample (membership confirmed spectroscopically) is ’representative’ of the entire cluster. That is, the fraction of galaxies that are cluster members is the same in the (incomplete) spectroscopic sample as in the (complete) photometric one. However, this is not always the case. For example, redshift estimates of galaxies in the Coma region are obtained from different sources and the selection criteria are not always well defined. Moreover, spectroscopic targets are often selected according to their colour (e.g. Mobasher et al. 2003) or narrow-band emission (e.g. Iglesias-Páramo et al. 2002) in order to maximize the number of members in the final sample, thus overestimating the real fraction of members. It is therefore likely that the membership fraction in our sample represents an upper limit to the real value (in particular at faint apparent magnitudes where the redshift completeness and the fraction of members are low). The only way to reduce this bias is to try to increase the completeness of our sample by excluding those galaxies which are likely to be background objects. We thus used stellar population synthesis models and a () vs. () colour diagram to reject galaxies with colours not representative of the Coma members (4000 km s-1 10000 km s-1). In Fig. 3 we compare the distributions of Coma confirmed members (squares), background galaxies (triangles) and galaxies without redshift estimate (circles) with the spectral energy distribution (SED) library typical of nearby galaxies described in Cortese et al. (2008), whose models span a wide range of ages, metallicities and dust attenuations. Every confirmed Coma cluster member lies within the parameter space admitted by the models, allowing us to reduce the number of possible members in our sample. We excluded all galaxies with 0.34 (dashed line in Fig. 3), reducing our sample from 1640 to 853 galaxies in NUV and from 762 to 500 galaxies in FUV. However, the improvement in the redshift completeness for our sample appears significant only in the last bin, as shown by the dotted and dashed lines in Fig. 2.
In addition, it is important to remember that the spectroscopic sample is optically selected whereas the photometric sample is UV selected. Therefore, objects bright in optical but faint in UV, like elliptical galaxies, have a completeness distribution significantly different from that of spiral galaxies (see Fig. 2, middle and bottom panel). Thus we decided to modify the completeness-corrected method and to treat separately quiescent (Q) and star forming (SF) galaxies. In particular, we used an observed colour = 4.5 mag (which corresponds to a specific star formation rate SSFR10-11.5 yr-1) to separate blue/star-forming galaxies from quiescent objects. For each type and magnitude bin , we then counted the number of cluster members (i.e., galaxies with velocity in the range 4000 km s-1 10000 km s-1), the number of galaxies with a measured recessional velocity , and the total number of galaxies . The completeness-corrected number of cluster members for each type in each bin is:
| (1) |
is a Poisson variable, and is a binomial variable (the number of successes in trials with probability ) and the errors associated with are given by:
| (2) |
The total number of galaxies in each bin of the LF and its uncertainty are therefore:
| (3) |
The NUV and FUV LFs obtained using the three methods described above, within different circular apertures centered on the cluster center, are shown in Fig. 4. All methods show a reasonable agreement for a cluster-centric distance 1 deg (1.67 Mpc) whereas for larger areas the statistical subtraction of the field provides number counts significantly lower than the other two techniques. This is likely due to the fact that, for scales larger than 1 deg, the cluster overdensity in UV starts to disappear. No significant difference is observed between the completeness-corrected and the morphology-based methods. For these reasons, in the following we will measure the UV LF of Coma using the completeness corrected method only111All the results presented in the following do not change if the background subtraction (for 1 deg) or the morphology are used to estimate the LFs..
The NUV and FUV LFs obtained for the whole 9 deg2 here investigated are shown in Fig. 5 (upper panels). The LFs are not well described by a Schechter function (Schechter 1976), in particular for 17 mag. However, in order to compare our results with previous determinations of field and cluster UV LFs, we fitted our points with a Schechter function by minimizing the . The best-fit values for and so obtained are presented in Table 2 and compared with previous determinations for local field and cluster galaxies. The contours are shown in the bottom panels of Fig. 5. The faint end slopes of the Coma LFs are consistent with those recently obtained by Cortese et al. (2005) in Abell1367 using GALEX observations (see Table 2) and with previous determination of the UV LF in nearby clusters based on balloon-borne experiments (Cortese et al. 2003a, b). On the contrary, Coma shows a bright end 1.5 mag fainter than the one observed in Abell1367. This apparently remarkable difference is due to the presence in Abell1367 of a few galaxies with enhanced star formation, among which the ultra-luminous UV galaxy UGC6697 (Gavazzi et al. 2001; Gil de Paz et al. 2007). Excluding the brightest point in the LF of Abell1367 we find a good agreement between the LFs of the two clusters. When compared to the field (Wyder et al. 2005, see Table 2), the Coma UV LFs have approximately the same bright end () but show a considerably steeper faint-end slope (), in particular in the NUV (see Fig. 5). By dividing our sample into star-forming and quiescent galaxies according to their observed colour (see Fig. 6, filled symbols), it clearly appears that the difference between field and cluster LFs is mainly due to the significant contribution of quiescent systems at low UV luminosities. These are not only elliptical and lenticular galaxies (e.g. Boselli et al. 2005; Donas et al. 2007), but also passive spirals whose star formation has been recently quenched by the cluster environment (e.g. Boselli et al. 2006, 2008), as shown in Fig. 7. In fact, if we use morphology instead of colour to separate late and early type galaxies (shaded and dotted regions in Fig. 6), the number of red galaxies contributing to the faint end of the LF decreases. The presence of passive spirals is mainly evident in NUV: e.g. for 16 mag nearly half of the cluster UV emitting objects are not forming stars, 70% early types and 30% quiescent late type galaxies. This is probably due to the different stellar populations responsible for the NUV and FUV emission in quiescent systems (Boselli et al. 2005; Donas et al. 2007). On the contrary, it is interesting to note that the UV LFs for Coma blue/star-forming galaxies are not significantly different from that of the field. We can therefore conclude that (1) the faint end slope of the UV LFs are steeper for Coma than for the local field and (2) this difference is almost entirely due to the contribution of red/quiescent galaxies at low UV luminosities, consistently with previous studies (Cortese et al. 2003a, 2005).
Finally, we notice that the lack of GALEX observations in the central 0.26 deg2 of Coma, mentioned in § 2, does not affect our conclusions. In fact, Cortese et al. (2003b) used UV (2000 Å) FOCA (Milliard et al. 1991) observations to determine the UV LF of the central 0.7 deg2 of Coma for 15.5 mag. They find a faint-end slope (1.650.30), consistent with our results. Moreover, Cortese et al. (2003a) combined FOCA observations of the central part of Coma and Abell1367 with FAUST (Lampton et al. 1990) observations of the Virgo cluster and determined a composite local UV LF for galaxy clusters, finding a shape of the LF very similar to the one obtained in this work (18.790.40 mag, 1.500.10).
4 The radial variation of the UV luminosity functions
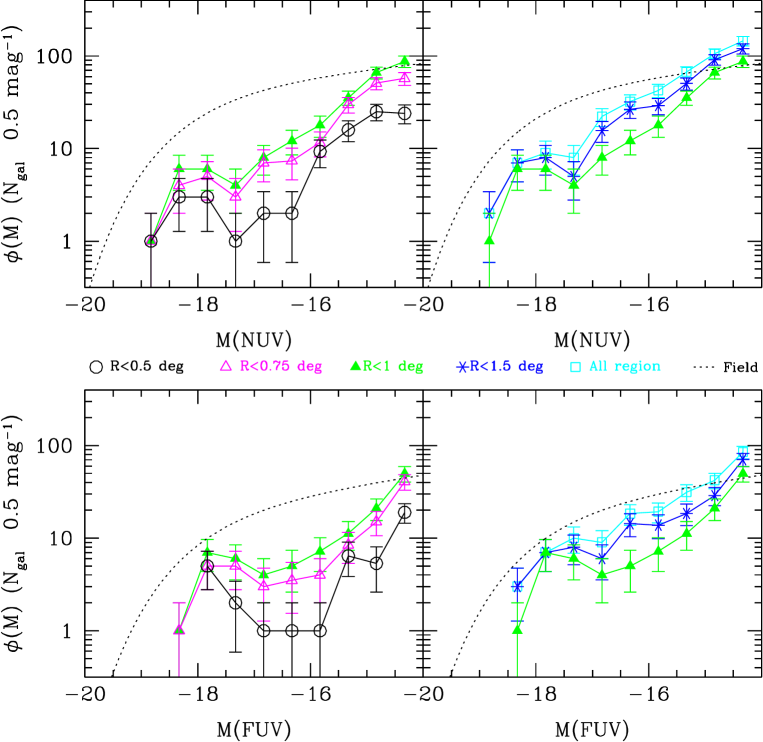
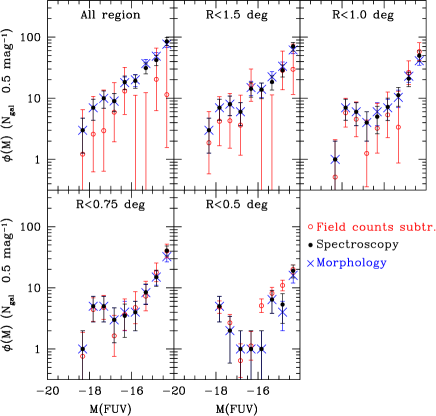
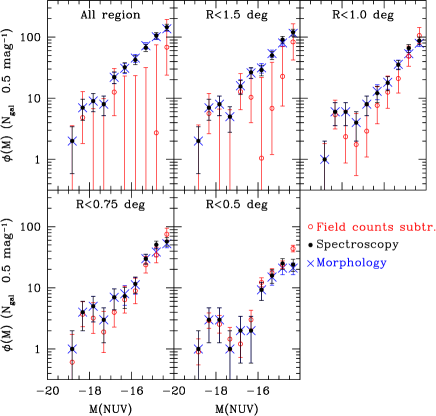
The wide area surveyed by GALEX can be used to investigate the variation in the shape of the LF as a function of the cluster-centric distance. Ideally, this should be done by comparing the LF obtained in different circular annuli centered on the cluster center. In reality, this is not always possible given the poor statistics of current samples. For example, in our case the small number of galaxies at high UV luminosities and the uncertainty in the membership fraction at low luminosities make impossible any estimate of the differential LF. Any difference observed could in fact only reflect statistical fluctuations in our sample. For these reasons, we decided to investigate the spatial variation of the LFs focusing our attention on the integral UV LFs, i.e. calculated within different cluster-centric apertures. Inevitably, by using this method, any difference in the shape of the LFs will be less evident since the central part of the cluster will contribute to all the LFs. The FUV and NUV LFs obtained within circular regions having radius 0.5, 0.75, 1, 1.5 deg (0.84, 1.25, 1.67, 2.5 Mpc or 0.3, 0.4, 0.6, 0.9 virial radii) and for the whole sample are shown in Fig. 8. At all radii the LFs in both NUV and FUV are inconsistent with a Schecther function. Our data are better described by a Gaussian at bright luminosities and a power law at faint luminosities, complicating the quantification of any difference between LFs at various radii. As discussed in the previous section, this is the result of the different contribution of star-forming objects and quiescent galaxies to the UV LFs. Excluding a variation in the normalization, no significant change is observed in the shape for different cluster-centric radii. The apparent flattening in the faint-end slope at smaller radii marginally visible in NUV is likely due to statistical fluctuations. We notice that a fit of the faint end slope in the range 1614 mag would result in a significant steepening with increasing radius in NUV (from 1.2 to 1.8) and flattening with increasing radius in FUV (from 2.5 to 1.7). This points out the danger of blindly fitting faint-end slopes to compare the shape of the LFs obtained with different samples.
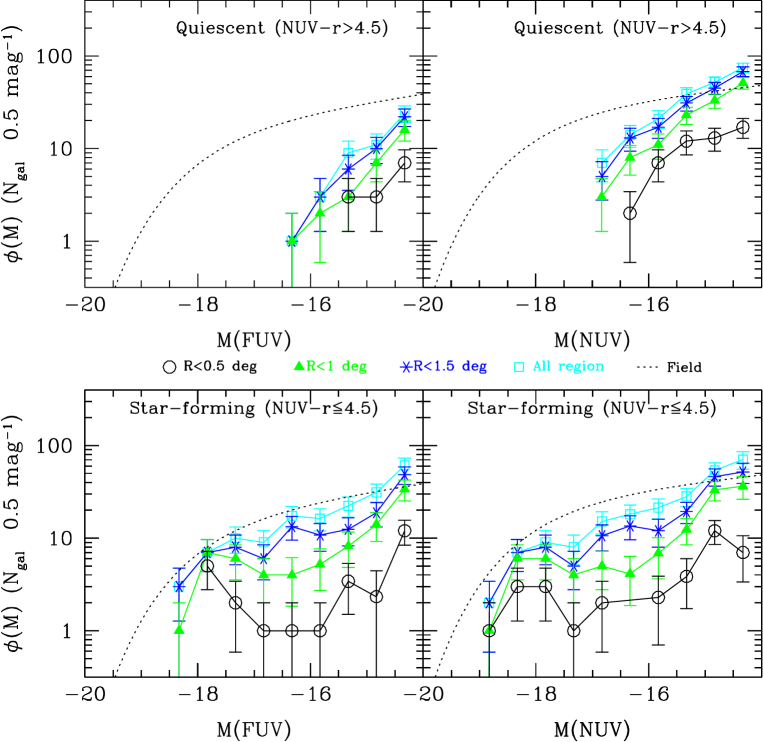
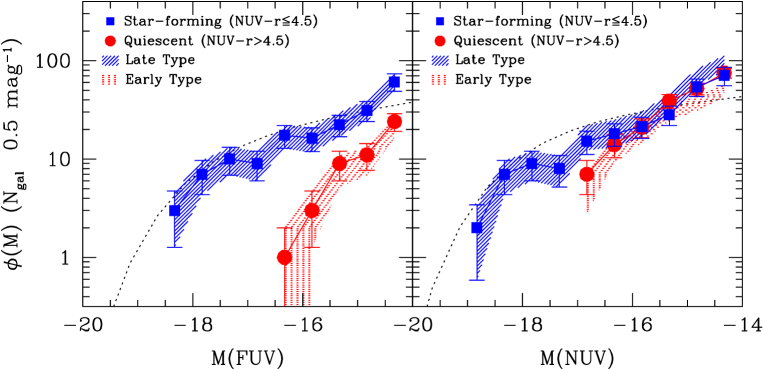
In Fig. 9 we show the integrated NUV and FUV LF as a function of the cluster-centric distance for star forming and quiescent objects separately. Also in this case we find that, within statistical errors, the shape of the LFs does not vary with cluster-centric distance. Similar results are obtained if we divide our sample in late and early types accordingly to their morphology (not shown). Only by integrating the LFs in the range in the range 1714 mag (16.514 mag), we find that the ratio of the UV emission of star-forming to that of quiescent systems monotonically increases from the center (0.5 deg) to the outskirts, as expected from the star formation-density relation. This ratio increases from 0.60.3 to 1.20.2 in NUV and from 1.81.0 to 4.10.8 in FUV.
Our results are consistent with the recent analysis carried out by Popesso et al. (2006) on RASS-SDSS galaxy clusters who find that the shape of the LFs of blue galaxies and bright red objects does not vary significantly with the distance from the cluster center. They only find a significant steepening at large radii in the faint-end slope of the LF of red dwarf galaxies which, being extremely faint in UV, are not included in our sample. Also Mobasher et al. (2003), by studying the and B band LF of the central region of Coma do not find a significant spatial variation in the shape of the LF. On the contrary, Beijersbergen et al. (2002) find a significant steepening of the LF at larger radii. This effect is more pronounced in band and it has been interpreted as evidence of an infalling population of dwarf galaxies in the outskirts of Coma. However the variation in the faint-slope mainly occurs in the central 0.3 deg, where our UV selected sample is highly incomplete and cannot be used to test this result. Similarly, the spatial variation in the faint end slope of the Coma optical (Adami et al. 2007) and far-infrared (Bai et al. 2006) LFs cannot be tested because obtained for regions (e.g. the core of Coma) or magnitude ranges (21 mag) not included in our UV selected sample.
We can therefore conclude that, at least in the range 0.5 2 deg, the shape of the integrated NUV and FUV LFs of the Coma cluster remains constant. We remind the reader that our results are only valid for integrated LFs and that the small number statistic makes impossible any quantification of the shape of the differential UV LFs.
5 The extinction corrected LF and SFR of the Coma cluster
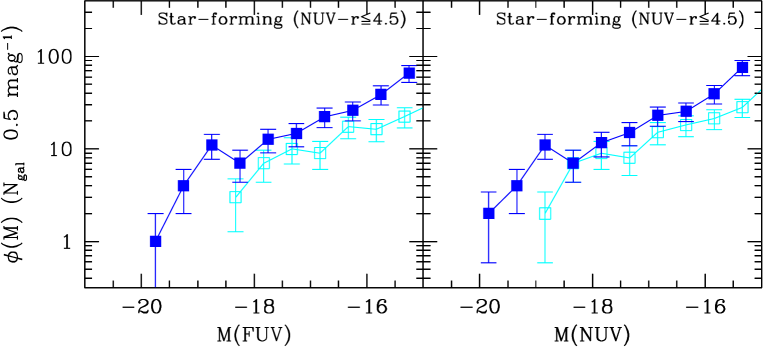
Previous determinations of UV LFs in all environments and at all redshifts have never taken internal extinction corrections in account. This is mainly due to the fact that methods for estimating dust attenuation usually require far-infrared photometry, quite rare for large samples, and are calibrated only on starbursts and active star-forming galaxies. Only recently, Cortese et al. (2006a, 2008) have provided UV dust attenuation correction recipes, valid for galaxies with different star formation histories. These recipes only require two broad-band colours and can be used to estimate an UV LF corrected for dust attenuation and to determine the total SFR in Coma. Since UV dust attenuation is important only for star-forming galaxies, in the following we restrict our analysis to the subsample including only blue galaxies (i.e. 4.5). For each galaxy, we determined and using the observed and colours as described in Cortese et al. (2008)222The attenuations in the two GALEX bands have been obtained independently, without any assumption on the shape of the extinction curve.. We then corrected the NUV and FUV magnitudes and determined the NUV and FUV LF using the completeness corrected method described in §3. The LFs obtained for the whole sample are shown in Fig. 10: after dust attenuation correction, the LFs shift to brighter luminosity by 1.5 mag in FUV and 1 mag in NUV, but their shapes do not change significantly. We also determined the unreddened LFs within different apertures and found no significant radial variation in their shapes (not shown).
By integrating the observed and unreddened LFs within the magnitude range investigated here ( mag), we determined the fraction of UV luminosity absorbed by dust. The total UV dust attenuations of the Coma cluster are = 0.840.28 mag and =1.250.25 mag, implying that two third (half) of the light emitted in FUV (NUV) by Coma galaxies is absorbed by dust. No variation in the UV dust attenuation with the distance from the cluster center is observed. These values are consistent with the total FUV dust attenuation observed in the local field =1.29 mag (Takeuchi et al. 2005), suggesting that the dust properties of blue/star-forming galaxies in Coma are not significantly different from those of field star-forming systems.
The unreddened UV LFs of star-forming galaxies can be also used to estimate the total SFR of the Coma cluster. To do so we integrated the LFs in the observed range and then converted the total luminosity into total SFR following Iglesias-Páramo et al. (2006):
| (4) |
where and are the total FUV and NUV luminosities (corrected for dust attenuation) of the Coma cluster333We note that, in reality, the calibration constant for the UV luminosity vs. SFR relation varies by up to a factor 1.5 with the stellar metallicity: i.e. the UV luminosity increases at lower metallicities (Bicker & Fritze-v. Alvensleben 2005). Unfortunately we do not have accurate metallicity information to take this effect into account.. The total SFR of the Coma cluster results444We consider the average between the total SFR obtained in NUV and FUV =9016 M⊙ yr-1, consistent with the = 97 M⊙ yr-1 recently obtained by Bai et al. (2006) using far-infrared observations. A similar value is obtained if the total SFR is estimated combining the FIR and UV luminosities (Bell 2003; Hirashita et al. 2003; Iglesias-Páramo et al. 2004):
| (5) |
where accounts for the IR cirrus emission (here we assume =0.3, Bell 2003) and is obtained from equation (5) but using the observed NUV luminosity.
This result suggests that totally obscured star formation (i.e. not at all visible in UV), if present, represents a very small fraction of the total star formation in Coma, in agreement with IRAS (e.g. Bicay & Giovanelli 1987; Boselli & Gavazzi 2006) and Spitzer (e.g. Muzzin et al. 2008; Saintonge et al. 2008) FIR observations of local clusters of galaxies.555In the near future, when Spitzer and Herschel data will become publicly available, it will also be possible to test this result on a galaxy by galaxy basis. In Fig. 11 we show the variation of the integrated SFR and SFR surface density as a function of cluster-centric distance and we compare our results with previous estimates based on far-infrared observations (Bai et al. 2006) and H narrow-band imaging (Iglesias-Páramo et al. 2002). As expected, the integrated SFR increases by a factor 4, and the integrated SFR surface density decreases by a factor 5, from the center to the outskirts of Coma. Although the total SFR obtained integrating over the whole area observed by GALEX is roughly consistent with the value obtained from far-infrared observations, the SFR obtained in UV for 1 deg is 2-3 times lower than that obtained in similar areas from far-infrared and H data. This difference is likely due to the absence of GALEX observations in the central 0.26 deg2, as supported by the similar SFR surface density obtained at small radii in UV, far-infrared and H (see Fig. 11).
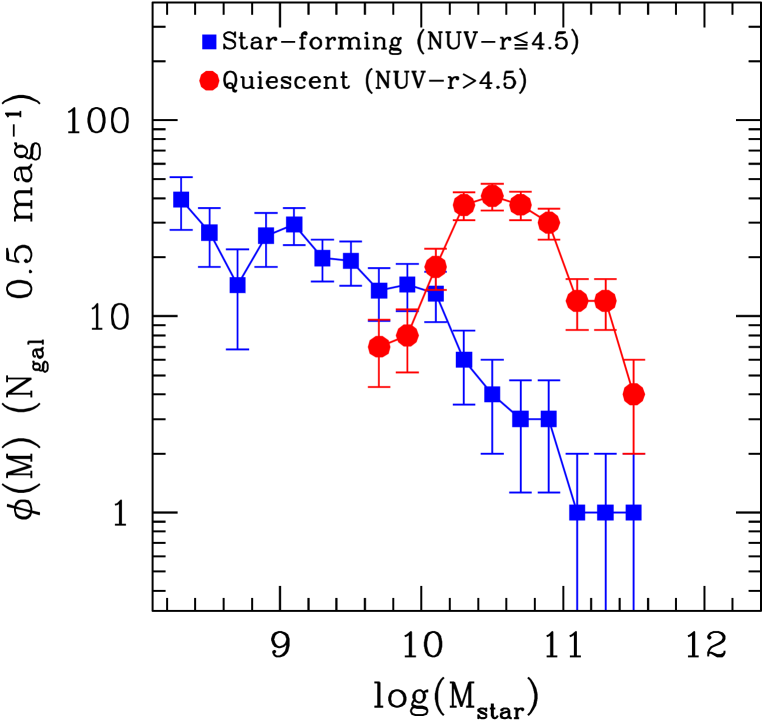
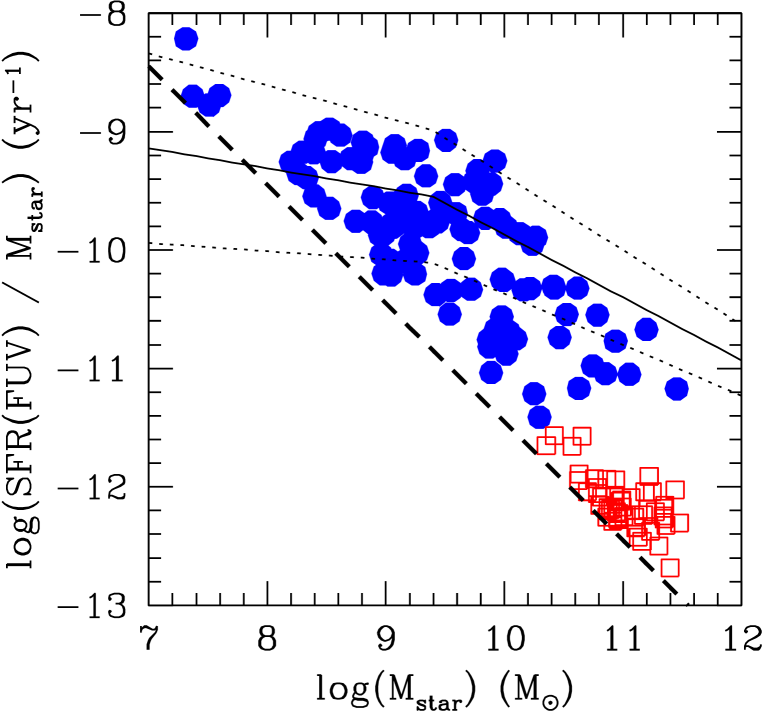
The contribution of Coma-like clusters of galaxies to the SFR density in the local universe can be computed if the cluster volume density is known. This value varies significantly with the properties of the adopted cluster sample (e.g. Scaramella et al. 1991; Mazure et al. 1996; Bramel et al. 2000; De Propris et al. 2002), but we can roughly assume it to lie in the range 3-9.5 10-6 Mpc-3. Thus, the total SFR density in local clusters is 2.5-8.5 10-4 M⊙ yr-1 Mpc-3, i.e. between 1.5% and 5% of the total SFR density in the local universe 10-1.80±0.16 M⊙ yr-1 Mpc-3 (Hanish et al. 2006). This value mainly depends on the density of local clusters and does not provide any information on the different SFH of cluster and field galaxies. A more interesting exercise is the comparison of the SSFR of Coma and the field. In order to quantify the total mass for our sample, we converted the unreddened band magnitude to stellar mass using the colour following Bell et al. (2003) and estimated the stellar mass distribution by using the completeness-corrected method described in § 3. The stellar mass distributions for the star-forming and quiescent galaxies in the UV-selected sample are shown in Fig. 12. The total stellar mass of our sample results =1013.13±0.10 M⊙, great part of which is assembled in quiescent systems: i.e. =1013.07±0.09 M⊙ and =1012.26±0.20 M⊙. In Fig. 12, it clearly emerges that the vast majority of the star forming galaxies are low mass ( M⊙) objects. Moreover, by estimating the UV LF for low and high mass objects it emerges that 6610% of the total Coma SFR is taking place in galaxies less massive than M⊙, confirming previous observational evidences that downsizing is also present in galaxy clusters (e.g. Boselli et al. 2001; Boselli & Gavazzi 2006; De Lucia et al. 2004b; Gavazzi et al. 1996, 2002a; Kodama et al. 2004; Poggianti et al. 2004, 2006). The integrated SSFR for the Coma cluster is 10-11.18±0.13 yr-1, significantly lower than the the typical SSFR observed in the local field e.g. 10-10.17 yr-1 (Salim et al. 2007) or 10-10.55±0.20 yr-1 if we assume 10-1.80±0.16 M⊙ yr-1 Mpc-3 (Hanish et al. 2006) and a local stellar mass density 108.75±0.12 M⊙ Mpc-3 (Pérez-González et al. 2008). This difference is likely a combination of the morphology-density and star formation-density relations: massive elliptical galaxies are more overdense in clusters (Dressler 1980; Whitmore et al. 1993) but also, for the same morphological type, cluster galaxies have a lower star formation activity than field objects (Gavazzi et al. 2006). Finally, it is interesting to note that the SSFR of blue/star-forming galaxies is 10-10.31±0.22 yr-1, i.e. consistent with that of the field, suggesting that Coma star-forming galaxies have not been significantly affected by the cluster environment.
5.1 Bias and selection effects
The results presented above might be affected by two different selection effects. Firstly, we are underestimating the total SFR of Coma since we lack observations for the cluster core. Secondly, the selection in UV adopted here is strongly biased against red massive systems (e.g. see Fig. 13), suggesting that we could also underestimate the total stellar mass of Coma. We can quantify the first bias by comparing our results with previous determinations of the total SFR (Bai et al. 2006; Iglesias-Páramo et al. 2002; see Fig. 11) that include the cluster center. In the central 0.5 deg, we are missing 30 M⊙ yr-1, implying that the total SFR of Coma presented above is underestimated by a factor 1.3. The total SFR density in Coma-like clusters would therefore increase to 2%-7% of the total SFR density in the local universe. To address the second bias, we can estimate the total stellar mass of the Coma cluster from its total mass (baryonic+dark matter) M1.4 1015 M⊙ (Łokas & Mamon 2003), assuming a mass-to-light ratio Mtot/LK= 75 M⊙/L⊙ (Rines et al. 2004) and a stellar mass-to-light ratio Mstar/LK ratio of 1 M⊙/L⊙ (Bell et al. 2003). We obtain a total stellar mass of 1013.3 M⊙, i.e. 1.5 times higher than the value obtained for our sample. The fact that the underestimates in the total SFR and stellar mass are comparable implies that the SSFR of the Coma cluster decreases only by a factor 1.1, well within the observational errors. We can therefore conclude that the lack of GALEX observations for the core of Coma does not significantly bias our results.
6 Discussion
6.1 Why are the field and cluster LFs of star-forming galaxies so similar?
Our analysis of GALEX observations of the Coma cluster provides definitive evidence that the shape of the UV LF is not universal but depends on the local environment (e.g. see Figs. 5, 6). Coma has a steeper faint-end due to the high number density of massive, quiescent galaxies and its total SSFR is significantly lower than that of the local field. This is a direct consequence of the morphology-density and star formation density relations: quiescent galaxies are in fact ellipticals, lenticulars and passive spirals whose star formation has been recently quenched by the cluster environment (see Fig. 7). Only if we restrict our attention to blue/star-forming cluster galaxies, the UV LFs and SSFR are not significantly different from those observed in low density environments, in agreement with recent studies of nearby (e.g. Balogh et al. 2004; Cortese et al. 2005) and high redshift (e.g. Finn et al. 2008; Cooper et al. 2008) clusters. These results could be interpreted as a strong evidence that the environment does not significantly affect the cosmic SFH of galaxies (Finn et al. 2008; Cooper et al. 2008). However, this interpretation is inconsistent with the plethora of evidences showing the strong effects of the environment on the evolution of cluster galaxies (e.g. see Boselli & Gavazzi 2006 and references therein). Here we show how the apparent independence of the properties of star-forming galaxies from the environment is, in reality, only a selection effect.
Our definition of blue/star-forming galaxies is based on colour or SSFR (i.e. 4.5, SSFR10-11.5 yr-1), as often happens for large samples,
implying that those galaxies which have been strongly affected by the environment are automatically excluded. This selection effect is evident from Fig. 13, where the relation between SSFR and stellar mass for confirmed cluster members in our sample is shown.
The solid line shows the typical relation (and its 1 uncertainty, dotted lines) for field galaxies as obtained by Salim et al. (2007), while the dashed line
represents our sensitivity limit (SFR0.04 M⊙ yr-1). For M 109.5 M⊙ we detect only healthy star-forming objects and, if a galaxy had its star formation quenched by the environment, it will not be detected by our observations.
By comparison, for M 109.5 M⊙, star-forming galaxies have to lie within 3 from the field relation, otherwise their colour would be too red and they would be classified as quiescent objects.
A clear example is represented by NGC4569 in the Virgo cluster, the prototype
of anemic spiral. Its star formation activity has been very recently (500 Myr ago) quenched by ram pressure stripping (Vollmer et al. 2004; Boselli et al. 2006) and its colour (4.1 mag, SSFR10-11.2 Gyr-1) is already almost as red as that of a quiescent galaxy. Passive spiral galaxies are in fact already included in our sample of quiescent
systems, as shown in Fig. 6 and in Fig. 7.
In order to demonstrate the validity of this interpretation, we investigated the effects of the
environment on the shape of the UV LF for star-forming galaxies using a very simple toy model.
We started with an infalling population of 1200 galaxies with 14 mag,
reproducing the field FUV LF.
For each infalling galaxy, the SFR (i.e. ) is instantaneously
quenched by the cluster environment.
The amount of quenching () is randomly chosen,
assuming a uniform distribution.
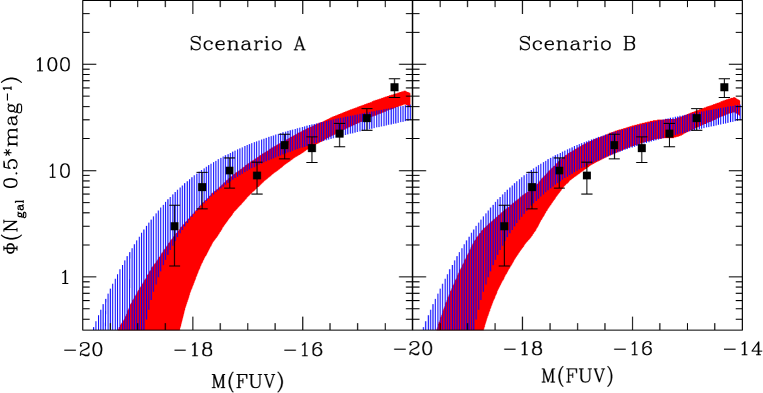
Two different scenarii have been considered, depending on the maximum amount
of quenching allowed.
In Scenario A, the maximum amount of quenching is =100, independently of galaxy luminosity.
In Scenario B, the maximum amount of quenching decreases linearly with galaxy luminosity: i.e. from
=100 for 14 mag to =10 for 18 mag.
By construction, both models are able to reproduce the parameter space occupied by our sample in Fig. 13.
For each scenario, we then reconstruct the cluster FUV LF including only those galaxies
still matching our definition of star-forming object, i.e. 10-11.5 yr-1 and 0.04 M⊙ yr-1. One thousand simulated LFs have been so obtained and the average result, normalized to the total number of blue galaxies in
our sample, is shown in Fig. 14.
We note that both scenarios are likely to overestimate the real variation of the LF.
In fact, we assume an instantaneous quenching whereas this time-scale is probably longer (see next section). Moreover, a quenching uniformly distributed in the range 1-100 is likely an overestimate of the average decrease in the SFR of cluster galaxies (Gavazzi et al. 2006; Gómez et al. 2003; Lewis et al. 2002).
Even so, the variation in the shape of the LF after (filled area in Fig. 14) the infalling into the cluster does not appear very significant666We remind that we are only interested in the shape of the LF. After the quenching of the star formation the absolute normalization of the LF is significantly reduced., supporting our interpretation.
Therefore, even if the cluster is very efficient in quenching
the SFR, a selection based on colour/SSFR
automatically excludes those galaxies which have already been strongly affected by the environment.
This selection effect, even more important at higher redshift where the dynamical range in stellar mass
is usually smaller than ours, implies that cluster and field star-forming galaxies are characterized by a similar LF by construction, since we are
only selecting healthy objects.
The steepening of the NUV LF for late type galaxies, once quiescent spirals are included (shaded region in Fig.6), provides
additional support to our interpretation.
Thus, the important result does not lie in the shape of the LFs but in the fact that we detect a significant fraction of healthy star forming galaxies in the cluster environment.
These galaxies likely represent a recent infalling population of field systems, not yet affected by the harsh environment of Coma.
This scenario also explains the similar decrease in the SFR of field and cluster galaxies between 1 and (Cooper et al. 2008; Finn et al. 2008): the vast majority of cluster star-forming galaxies are still infalling for the first time
into the cluster center and therefore their properties are still representative of the field.
6.2 The accretion rate of the Coma cluster
As argued in the previous section, the healthy star-forming galaxies observed in Coma appear to have just started their first dive into the cluster center. Our observations could therefore allow us to quantify the mass accretion rate of star-forming galaxies from the field assuming that we know the exact time-scale necessary to quench the star formation. This is still an open issue but, assuming reasonable estimates for the typical Coma crossing time (1.6 109 yr, Boselli & Gavazzi 2006), the time-scale associated with the various physical processes invoked to suppress star formation (0.1-1 Gyr; Abadi et al. 1999; Boselli & Gavazzi 2006; Boselli et al. 2006, 2008; Cortese et al. 2007; Fujita 2004; Quilis et al. 2000; Poggianti et al. 1999, 2004; Roediger & Hensler 2005; Shioya et al. 2002; Vollmer et al. 2001) and the time-scale for the evolution of the UV luminosity (108 yr), we conclude that 1-3 Gyr (at most) should be sufficient to transform an infalling galaxy into a quiescent system. By combining this time-scale with the total stellar mass of the infalling galaxies we can infer a stellar mass accretion rate of (0.6-1.8)1012 M⊙ Gyr-1, roughly consistent with the value obtained by Adami et al. (2005), when converted to total mass using a total-to-stellar mass ratio Mtot/Mstar=75 (Rines et al. 2004). This implies that, if the mass accretion rate has not significantly changed during the age of the universe, the whole quiescent population could have formed by infalling galaxies in a Hubble time. In particular, from 1 until now the stellar mass in the red sequence has increased by a factor 1.5-5 (depending on the real infall rate777These values are obtained assuming that all the stellar mass in the central part of Coma (not included in this work) lies in red sequence. These therefore represent lower limits to the real value.), a value consistent with the cosmic growth of stellar mass (e.g. Bell et al. 2007; Brown et al. 2007; Cimatti et al. 2006; Faber et al. 2007; Zucca et al. 2006). We note that this simple picture is consistent with the large accretion rate in clusters at 1 predicted by numerical simulations (e.g. De Lucia et al. 2004a) and with the typical infalling rate obtained from observations (e. g. Ellingson et al. 2001; Andreon et al. 2006) and simulations (e.g. van den Bosch 2002; Berrier et al. 2008). In addition, a steadily growth of Coma over cosmic time would not significantly modify the bright end () of the cluster stellar mass function, in agreement with observations of high redshift clusters (e.g. Andreon 2006; De Propris et al. 2007).
The fact that red sequence galaxies are preferentially found in clusters of galaxies suggests that the cluster environment could play a non negligible role in the building up of the red sequence since 1. If so, we can expect a rapid decrease in the difference between the specific star formation of Coma and the field from 1 to 0. An accurate quantification of the mass accretion rate of Coma, and of its evolution with redshift, is therefore mandatory to determine whether or not the shape of the cosmic SFH depends on the environment.
In spite of their large uncertainty, these simple calculations show that the infall of healthy spirals from low density environments into the center of cluster of galaxies can not only explain part of the morphology-density (Smith et al. 2005; Desai et al. 2007) and star formation density relations observed in today clusters of galaxies, but could also easily account for the strong evolution in the stellar mass budget of the red sequence from 1 to 0.
7 Summary & Conclusions
In this paper, we have presented a study of the UV properties of the Coma cluster based on
GALEX NUV and FUV observations covering 9 deg2 centered on the cluster core.
Although the central 0.26 deg2 could not be observed, our analysis represents the widest and deepest UV investigation of a nearby cluster of galaxies made to date.
Our main results are as follows:
a) The Coma NUV and FUV LFs show a faint end slope significantly steeper than the
one observed in the field. This difference is more evident in NUV and it is due to the higher number density of massive
quiescent/red galaxies (i.e. ellipticals, lenticulars and passive spirals) in Coma compared to the field.
The contribution of quiescent galaxies to the total UV emission at low luminosities (17 mag) is larger in the cluster center, however no significant variation in the shape of the UV LFs with cluster-centric distance is observed.
b) We estimated for the first time the UV LFs of star-forming galaxies corrected for internal dust attenuation. We showed that Coma-like clusters contribute only 7% of the total SFR density of the local universe.
More interestingly the SSFR of Coma is 10-11.18±0.13 yr-1, significantly lower than the integrated SSFR of the local universe.
Approximately 2/3 of the whole SF in Coma is occurring in objects with M 1010 Mstar, confirming that downsizing is also present in high density environments.
c) The shape of the UV LF and the SSFR of blue/star-forming galaxies are consistent with those of the field, in agreement with previous works. We have shown that this similarity does not imply that the effects of the environment on the evolution of the cosmic SFH are negligible. On the contrary, these results are consistent with a scenario in which cluster star-forming galaxies are still infalling for the first time into the cluster center. The stellar mass accretion rate of Coma results (0.6-1.8)1012 M⊙ Gyr-1. At this rate, the whole cluster could have easily formed from infalling galaxies accreted from the field in a Hubble time. More interestingly, a significant fraction of the population of lenticular and passive spirals observed today in Coma could arise from infalling galaxies accreted between 1 and 0, perhaps suggesting that the environment plays a significant role in the mass growth of the red sequence in the universe.
Acknowledgments
We wish to thank the anonymous referee, whose comments and suggestions were useful for improving this manuscript. LC is supported by the UK Science and Technology Facilities Council. LC wishes to thank Barbara Catinella for useful discussions and for a critical reading of this manuscript and Jonathan Davies, Tom Hughes, Rory Smith and Rhys Taylor for helpful comments. GG acknowledges the support by ASI-INAF grant I/023/05/10. This research is mainly based on the GALEX GI program GALEXGI1-039, as well as public archival data, available at the MAST archive. GALEX (Galaxy Evolution Explorer) is a NASA Small Explorer, launched in April 2003. We gratefully acknowledge NASA’s support for construction, operation, and science analysis for the GALEX mission, developed in cooperation with the Centre National d’Etudes Spatiales of France and the Korean Ministry of Science and Technology.
Funding for the SDSS and SDSS-II has been provided by the Alfred P. Sloan Foundation, the Participating Institutions, the National Science Foundation, the U.S. Department of Energy, the National Aeronautics and Space Administration, the Japanese Monbukagakusho, the Max Planck Society, and the Higher Education Funding Council for England. The SDSS Web Site is http://www.sdss.org/.
The SDSS is managed by the Astrophysical Research Consortium for the Participating Institutions. The Participating Institutions are the American Museum of Natural History, Astrophysical Institute Potsdam, University of Basel, University of Cambridge, Case Western Reserve University, University of Chicago, Drexel University, Fermilab, the Institute for Advanced Study, the Japan Participation Group, Johns Hopkins University, the Joint Institute for Nuclear Astrophysics, the Kavli Institute for Particle Astrophysics and Cosmology, the Korean Scientist Group, the Chinese Academy of Sciences (LAMOST), Los Alamos National Laboratory, the Max-Planck-Institute for Astronomy (MPIA), the Max-Planck-Institute for Astrophysics (MPA), New Mexico State University, Ohio State University, University of Pittsburgh, University of Portsmouth, Princeton University, the United States Naval Observatory, and the University of Washington.
This research has made use of the NASA/IPAC Extragalactic Database, which is operated by the Jet Propulsion Laboratory, California Institute of Technology, under contract to NASA and of the GOLDMine database (Gavazzi et al. 2003).
References
- Abadi et al. (1999) Abadi, M. G., Moore, B., & Bower, R. G. 1999, MNRAS, 308, 947
- Adami et al. (2005) Adami, C., Biviano, A., Durret, F., & Mazure, A. 2005, A&A, 443, 17
- Adami et al. (2007) Adami, C., Durret, F., Mazure, A., et al. 2007, A&A, 462, 411
- Adelman-McCarthy et al. (2008) Adelman-McCarthy, J. K., Agüeros, M. A., Allam, S. S., et al. 2008, ApJS, 175, 297
- Andreon (1999) Andreon, S. 1999, A&A, 351, 65
- Andreon (2006) Andreon, S. 2006, A&A, 448, 447
- Andreon et al. (2006) Andreon, S., Quintana, H., Tajer, M., Galaz, G., & Surdej, J. 2006, MNRAS, 365, 915
- Bai et al. (2006) Bai, L., Rieke, G. H., Rieke, M. J., et al. 2006, ApJ, 639, 827
- Balogh et al. (2004) Balogh, M., Eke, V., Miller, C., et al. 2004, MNRAS, 348, 1355
- Beijersbergen et al. (2002) Beijersbergen, M., Hoekstra, H., van Dokkum, P. G., & van der Hulst, T. 2002, MNRAS, 329, 385
- Bell (2003) Bell, E. F. 2003, ApJ, 586, 794
- Bell et al. (2003) Bell, E. F., McIntosh, D. H., Katz, N., & Weinberg, M. D. 2003, ApJS, 149, 289
- Bell et al. (2007) Bell, E. F., Zheng, X. Z., Papovich, C., et al. 2007, ApJ, 663, 834
- Berrier et al. (2008) Berrier, J. C., Stewart, K. R., Bullock, J. S., et al. 2008, ApJ submitted (astro-ph://0804.0426)
- Bertin & Arnouts (1996) Bertin, E. & Arnouts, S. 1996, A&AS, 117, 393
- Bicay & Giovanelli (1987) Bicay, M. D. & Giovanelli, R. 1987, ApJ, 321, 645
- Bicker & Fritze-v. Alvensleben (2005) Bicker, J. & Fritze-v. Alvensleben, U. 2005, A&A, 443, L19
- Binggeli et al. (1985) Binggeli, B., Sandage, A., & Tammann, G. A. 1985, AJ, 90, 1681
- Borch et al. (2006) Borch, A., Meisenheimer, K., Bell, E. F., et al. 2006, A&A, 453, 869
- Boselli et al. (2008) Boselli, A., Boissier, S., Cortese, L., & Gavazzi, G. 2008, ApJ, 674, 742
- Boselli et al. (2006) Boselli, A., Boissier, S., Cortese, L., et al. 2006, ApJ, 651, 811
- Boselli et al. (2005) Boselli, A., Cortese, L., Deharveng, J. M., et al. 2005, ApJ, 629, L29
- Boselli & Gavazzi (2006) Boselli, A. & Gavazzi, G. 2006, PASP, 118, 517
- Boselli et al. (2001) Boselli, A., Gavazzi, G., Donas, J., & Scodeggio, M. 2001, AJ, 121, 753
- Bramel et al. (2000) Bramel, D. A., Nichol, R. C., & Pope, A. C. 2000, ApJ, 533, 601
- Brosch et al. (1997) Brosch, N., Formiggini, L., Almoznino, E., et al. 1997, ApJS, 111, 143
- Brown et al. (2007) Brown, M. J. I., Dey, A., Jannuzi, B. T., et al. 2007, ApJ, 654, 858
- Cardelli et al. (1989) Cardelli, J. A., Clayton, G. C., & Mathis, J. S. 1989, ApJ, 345, 245
- Carter et al. (2008) Carter, D., Goudfrooij, P., Mobasher, B., et al. 2008, ApJS, 176, 424
- Cimatti et al. (2006) Cimatti, A., Daddi, E., & Renzini, A. 2006, A&A, 453, L29
- Cooper et al. (2008) Cooper, M. C., Newman, J. A., Weiner, B. J., et al. 2008, MNRAS, 383, 1058
- Cortese et al. (2006a) Cortese, L., Boselli, A., Buat, V., et al. 2006a, ApJ, 637, 242
- Cortese et al. (2008) Cortese, L., Boselli, A., Franzetti, P., et al. 2008, MNRAS, 386, 1157
- Cortese et al. (2005) Cortese, L., Boselli, A., Gavazzi, G., et al. 2005, ApJL, 623, L17
- Cortese et al. (2006b) Cortese, L., Gavazzi, G., Boselli, A., et al. 2006b, A&A, 453, 847
- Cortese et al. (2003a) Cortese, L., Gavazzi, G., Boselli, A., et al. 2003a, A&A, 410, L25
- Cortese et al. (2003b) Cortese, L., Gavazzi, G., Iglesias-Paramo, J., Boselli, A., & Carrasco, L. 2003b, A&A, 401, 471
- Cortese et al. (2007) Cortese, L., Marcillac, D., Richard, J., et al. 2007, MNRAS, 376, 157
- De Lucia et al. (2004a) De Lucia, G., Kauffmann, G., Springel, V., et al. 2004a, MNRAS, 348, 333
- De Lucia et al. (2004b) De Lucia, G., Poggianti, B. M., Aragón-Salamanca, A., et al. 2004b, ApJL, 610, L77
- De Lucia et al. (2006) De Lucia, G., Springel, V., White, S. D. M., Croton, D., & Kauffmann, G. 2006, MNRAS, 366, 499
- De Propris et al. (2003) De Propris, R., Colless, M., Driver, S. P., et al. 2003, MNRAS, 342, 725
- De Propris et al. (2002) De Propris, R., Couch, W. J., Colless, M., et al. 2002, MNRAS, 329, 87
- De Propris et al. (2007) De Propris, R., Stanford, S. A., Eisenhardt, P. R., Holden, B. P., & Rosati, P. 2007, AJ, 133, 2209
- Deharveng et al. (1994) Deharveng, J.-M., Sasseen, T. P., Buat, V., et al. 1994, A&A, 289, 715
- Desai et al. (2007) Desai, V., Dalcanton, J. J., Aragón-Salamanca, A., et al. 2007, ApJ, 660, 1151
- Donas et al. (1987) Donas, J., Deharveng, J. M., Laget, M., Milliard, B., & Huguenin, D. 1987, A&A, 180, 12
- Donas et al. (2007) Donas, J., Deharveng, J.-M., Rich, R. M., et al. 2007, ApJS, 173, 597
- Donas et al. (1995) Donas, J., Milliard, B., & Laget, M. 1995, A&A, 303, 661
- Dressler (1980) Dressler, A. 1980, ApJ, 236, 351
- Dressler (2004) Dressler, A. 2004, in Clusters of Galaxies: Probes of Cosmological Structure and Galaxy Evolution, 207
- Drory et al. (2005) Drory, N., Salvato, M., Gabasch, A., et al. 2005, ApJL, 619, L131
- Ellingson et al. (2001) Ellingson, E., Lin, H., Yee, H. K. C., & Carlberg, R. G. 2001, ApJ, 547, 609
- Ellis et al. (1997) Ellis, R. S., Smail, I., Dressler, A., et al. 1997, ApJ, 483, 582
- Faber et al. (2007) Faber, S. M., Willmer, C. N. A., Wolf, C., et al. 2007, ApJ, 665, 265
- Ferguson & Sandage (1988) Ferguson, H. C. & Sandage, A. 1988, AJ, 96, 1520
- Finn et al. (2008) Finn, R. A., Balogh, M. L., Zaritsky, D., Miller, C. J., & Nichol, R. C. 2008, ApJ, 679, 279
- Fontana et al. (2006) Fontana, A., Salimbeni, S., Grazian, A., et al. 2006, A&A, 459, 745
- Fujita (2004) Fujita, Y. 2004, PASJ, 56, 29
- Gavazzi et al. (2002a) Gavazzi, G., Bonfanti, C., Sanvito, G., Boselli, A., & Scodeggio, M. 2002a, ApJ, 576, 135
- Gavazzi et al. (2006) Gavazzi, G., Boselli, A., Cortese, L., et al. 2006, A&A, 446, 839
- Gavazzi et al. (2003) Gavazzi, G., Boselli, A., Donati, A., Franzetti, P., & Scodeggio, M. 2003, A&A, 400, 451
- Gavazzi et al. (2002b) Gavazzi, G., Boselli, A., Pedotti, P., Gallazzi, A., & Carrasco, L. 2002b, A&A, 396, 449
- Gavazzi et al. (2001) Gavazzi, G., Marcelin, M., Boselli, A., et al. 2001, A&A, 377, 745
- Gavazzi et al. (1996) Gavazzi, G., Pierini, D., & Boselli, A. 1996, A&A, 312, 397
- Gil de Paz et al. (2007) Gil de Paz, A., Boissier, S., Madore, B. F., et al. 2007, ApJS, 173, 185
- Gómez et al. (2003) Gómez, P. L., Nichol, R. C., Miller, C. J., et al. 2003, ApJ, 584, 210
- Hanish et al. (2006) Hanish, D. J., Meurer, G. R., Ferguson, H. C., et al. 2006, ApJ, 649, 150
- Hirashita et al. (2003) Hirashita, H., Buat, V., & Inoue, A. K. 2003, A&A, 410, 83
- Iglesias-Páramo et al. (2002) Iglesias-Páramo, J., Boselli, A., Cortese, L., Vílchez, J. M., & Gavazzi, G. 2002, A&A, 384, 383
- Iglesias-Páramo et al. (2004) Iglesias-Páramo, J., Buat, V., Donas, J., Boselli, A., & Milliard, B. 2004, A&A, 419, 109
- Iglesias-Páramo et al. (2006) Iglesias-Páramo, J., Buat, V., Takeuchi, T. T., et al. 2006, ApJS, 164, 38
- Kennicutt (1998) Kennicutt, R. C. 1998, ARA&A, 36, 189
- Kodama & Bower (2001) Kodama, T. & Bower, R. G. 2001, MNRAS, 321, 18
- Kodama et al. (2004) Kodama, T., Yamada, T., Akiyama, M., et al. 2004, MNRAS, 350, 1005
- Lampton et al. (1990) Lampton, M., Deharveng, J. M., & Bowyer, S. 1990, in IAU Symp. 139, 449
- Lewis et al. (2002) Lewis, I., Balogh, M., De Propris, R., et al. 2002, MNRAS, 334, 673
- Lilly et al. (1996) Lilly, S. J., Le Fevre, O., Hammer, F., & Crampton, D. 1996, ApJL, 460, L1
- Łokas & Mamon (2003) Łokas, E. L. & Mamon, G. A. 2003, MNRAS, 343, 401
- Madau et al. (1996) Madau, P., Ferguson, H. C., Dickinson, M. E., et al. 1996, MNRAS, 283, 1388
- Martin et al. (2005) Martin, D. C., Fanson, J., Schiminovich, D., et al. 2005, ApJL, 619, L1
- Mazure et al. (1996) Mazure, A., Katgert, P., den Hartog, R., et al. 1996, A&A, 310, 31
- Milliard et al. (1991) Milliard, B., Donas, J., & Laget, M. 1991, Advances in Space Research, 11, 135
- Mobasher et al. (2003) Mobasher, B., Colless, M., Carter, D., et al. 2003, ApJ, 587, 605
- Moore et al. (1996) Moore, B., Katz, N., Lake, G., Dressler, A., & Oemler, A. 1996, Nature, 379, 613
- Morrissey et al. (2007) Morrissey, P., Conrow, T., Barlow, T. A., et al. 2007, ApJS, 173, 682
- Morrissey et al. (2005) Morrissey, P., Schiminovich, D., Barlow, T. A., et al. 2005, ApJL, 619, L7
- Muzzin et al. (2008) Muzzin, A., Wilson, G., Lacy, M., Yee, H. K. C., & Stanford, S. A. 2008, ApJ in press (astro-ph://0807.0227)
- Pérez-González et al. (2008) Pérez-González, P. G., Rieke, G. H., Villar, V., et al. 2008, ApJ, 675, 234
- Poggianti et al. (2004) Poggianti, B. M., Bridges, T. J., Komiyama, Y., et al. 2004, ApJ, 601, 197
- Poggianti et al. (1999) Poggianti, B. M., Smail, I., Dressler, A., et al. 1999, ApJ, 518, 576
- Poggianti et al. (2006) Poggianti, B. M., von der Linden, A., De Lucia, G., et al. 2006, ApJ, 642, 188
- Popesso et al. (2006) Popesso, P., Biviano, A., Böhringer, H., & Romaniello, M. 2006, A&A, 445, 29
- Quilis et al. (2000) Quilis, V., Moore, B., & Bower, R. 2000, Science, 288, 1617
- Renzini (2006) Renzini, A. 2006, ARA&A, 44, 141
- Rines et al. (2004) Rines, K., Geller, M. J., Diaferio, A., Kurtz, M. J., & Jarrett, T. H. 2004, AJ, 128, 1078
- Roediger & Hensler (2005) Roediger, E. & Hensler, G. 2005, A&A, 433, 875
- Saintonge et al. (2008) Saintonge, A., Tran, K.-V. H., & Holden, B. P. 2008, ApJL submitted, (astro-ph://0806.2157)
- Salim et al. (2007) Salim, S., Rich, R. M., Charlot, S., et al. 2007, ApJS, 173, 267
- Sandage et al. (1985) Sandage, A., Binggeli, B., & Tammann, G. A. 1985, AJ, 90, 1759
- Scaramella et al. (1991) Scaramella, R., Zamorani, G., Vettolani, G., & Chincarini, G. 1991, AJ, 101, 342
- Schechter (1976) Schechter, P. 1976, ApJ, 203, 297
- Schlegel et al. (1998) Schlegel, D. J., Finkbeiner, D. P., & Davis, M. 1998, ApJ, 500, 525
- Shioya et al. (2002) Shioya, Y., Bekki, K., Couch, W. J., & De Propris, R. 2002, ApJ, 565, 223
- Smith et al. (2005) Smith, G. P., Treu, T., Ellis, R. S., Moran, S. M., & Dressler, A. 2005, ApJ, 620, 78
- Stanford et al. (1998) Stanford, S. A., Eisenhardt, P. R., & Dickinson, M. 1998, ApJ, 492, 461
- Takeuchi et al. (2005) Takeuchi, T. T., Buat, V., & Burgarella, D. 2005, A&A, 440, L17
- Trentham & Tully (2002) Trentham, N. & Tully, R. B. 2002, MNRAS, 335, 712
- van den Bosch (2002) van den Bosch, F. C. 2002, MNRAS, 331, 98
- Vollmer et al. (2004) Vollmer, B., Balkowski, C., Cayatte, V., van Driel, W., & Huchtmeier, W. 2004, A&A, 419, 35
- Vollmer et al. (2001) Vollmer, B., Cayatte, V., Balkowski, C., & Duschl, W. J. 2001, ApJ, 561, 708
- Whitmore et al. (1993) Whitmore, B. C., Gilmore, D. M., & Jones, C. 1993, ApJ, 407, 489
- Wyder et al. (2005) Wyder, T. K., Treyer, M. A., Milliard, B., et al. 2005, ApJL, 619, L15
- Xu et al. (2005) Xu, C. K., Donas, J., Arnouts, S., et al. 2005, ApJ, 619, L11
- Zucca et al. (2006) Zucca, E., Ilbert, O., Bardelli, S., et al. 2006, A&A, 455, 879
1. This work.
2. Cortese et al. (2005)
3. Wyder et al. (2005)

.