Searching for the metal-weak thick disc in the solar neighbourhood
Abstract
An abundance analysis is presented of 60 metal-poor stars drawn from catalogues of nearby stars provided by Ariyanto et al. (2005) and Schuster et al. (2006). In an attempt to isolate a sample of metal-weak thick disc stars, we applied the kinematic criteria km s-1, km s-1, and km s-1. Fourteen stars satisfying these criteria and having [Fe/H] are included in the sample of 60 stars. Eight of the 14 have [Fe/H] and may be simply thick disc stars of slightly lower than average [Fe/H]. The other six have [Fe/H] from to and are either metal-weak thick disc stars or halo stars with kinematics mimicking those of the thick disc. The sample of 60 stars is completed by eight thick disc stars, 20 stars of a hybrid nature (halo or thick disc stars), and 18 stars with kinematics distinctive of the halo.
keywords:
stars: atmospheric parameters– stars: abundances – stars: thick and thin disc – stars: kinematics – Galaxy: evolution – Galaxy: abundances1 Introduction
Stars in the the Sun’s immediate neighbourhood belong in the main to the Galactic disc with a sprinkling of halo stars. The majority of the disc stars are from the thin disc with a minority from the thick disc. Introduction of the concept of the thick disc is broadly attributed to Gilmore & Reid (1983) who from star counts found that a double-exponential offered a fit to the space density perpendicular to the Galactic plane toward the south Galactic pole. The dominant component with a scale height of 300 pc was the familiar disc, now referred to as the thin disc. The second component with a scale height of 1350 pc was dubbed the thick disc. At the Galactic plane, the thick disc stars comprise no more than a few per cent of the thin disc population. Obviously, the fractional population represented by the thick disc increases with height above the plane.
After its introduction, the thick disc was a controversial innovation for quite some years but, today, many properties of the thick disc in the solar neighbourhood are rather well determined. Many studies have found thick disc stars to be old with ages in the range of 8-13 Gyr (Fuhrmann 1998; Reddy et al. 2006) but other studies have proposed ages as young as 2 Gyr for some thick disc stars (Bensby et al. 2007). Their velocity dispersion perpendicular to the Galactic plane is about 40 km s-1, a value to be compared with about 20 km s-1 for the old thin disc, and 90 km s-1 for the halo. Thick disc stars lag behind thin disc stars in rotation about the centre of the Galaxy by about 50 km s-1. The mean metallicity of the thick disc is about [Fe/H] with most stars falling in the interval [Fe/H] of to . Differences in relative abundances [X/Fe] between thin and thick disc stars are now well established over this [Fe/H] range (Bensby et al. 2005; Reddy, Lambert, & Allende Prieto 2006).
Remaining significant controversies surround the upper and lower bounds to the [Fe/H] distribution function for thick disc stars. In this paper, we are concerned with the lower bound for thick disc stars in the solar neighbourhood. Stars of the thick disc with [Fe/H] less than about are referred to as ‘metal-weak thick disc’ stars (here, metal-weak thick disk stars). The metal-weak thick disk has now been the subject of many investigations. But, although many studies of putative metal-weak thick disk stars exist, the results as far as their composition are concerned have been limited to a measurement of metallicity, usually [Fe/H]. In broad terms, two kinds of samples have been discussed: stars in the Sun’s immediate neighbourhood and giant stars beyond the solar neighbourhood. The significant advantage provided by local stars is that the sample has well determined kinematics. The advantage of a sample composed of stars at greater distances from the Galactic plane is that the relative fraction of thick to thin disc stars will be higher than locally but the obvious disadvantage is, in general, that knowledge of stellar kinematics is compromised by the lack of accurate distance and the small amplitude of the proper motions. In addition, halo stars provide an increasingly severe contamination of stellar samples as distance from the Galactic plane increases.
The persisting controversy about the existence of metal-weak thick disk stars may be traceable to reconsideration of the metallicities obtained by Morrison et al. (1990) from DDO photometry for their sample of giants with disclike kinematics. Ryan & Lambert (1995) undertook a high-resolution spectroscopic analysis of a subset of Morrison et al.’s stars and showed that the most of the stars identified as belonging to the metal-weak thick disk have metallicities [Fe/H] and are thus ‘normal’ thick disc stars. Twarog & Anthony-Twarog (1994, 1996) provided a recalibration of the DDO photometry that also weakened Morrison et al.’s evidence for existence of metal-weak thick disk stars. These critiques of the pioneering paper on metal-weak thick disk stars have percolated through the literature. Beers et al. (2002), ardent advocates for metal-weak thick disk stars as an important component of Galactic structure, wrote that ‘acceptance of their [metal-weak thick disk stars] presence has been cast in doubt because of incorrectly assigned metallicities’. Oddly, major studies of candidate metal-weak thick disk stars have rarely obtained the metallicity and never elemental abundances from high-resolution high-signal-to-noise ratio spectra.
In this paper, we search for metal-weak thick disk stars among two recent catalogues of local main sequence stars with reliable kinematics and metallicities. A comprehensive abundance analysis is undertaken for metal-weak thick disk candidates and halo stars in order to search for definitive differences in composition between candidate metal-weak thick disk stars and halo stars of similar metallicity.
2 Two Samples of Local Metal-poor Star
The catalogues searched for possible metal-weak thick disk stars are provided by Arifyanto et al. (2005) and Schuster et al. (2006). These two catalogues give space velocities , , and along with the input astrometry (proper motion, parallax and radial velocity) and a measure of metallicity. To maintain uniformity with our earlier surveys (Reddy et al. 2003, 2006), we have recomputed space velocities , , and and expressed them relative to the local standard of rest (LSR), i.e., , , and , using the astrometry given in the respective catalogues and the solar motion of km s-1 (Dehnen & Binney 1998) where the positive values of , , and are towards Galactic center, in the direction of Galactic rotation, and towards the Galactic north pole, respectively.
The differences between our computed velocities and the values given by Arifyanto et al. and by Schuster et al. are very small ( 0.5 km s-1) and quite unimportant in a selection of metal-weak thick disk stars. The difference between computed here and the given by Schuster et. al is 9.40.1 km s-1 due to the difference in the correction of velocities to the LSR: Schuster et al. used a solar motion of km s-1, a difference of 9.6 km s-1 in .
The Galactic orbital parameters and , the peri-and apogalactic distances, respectively, (maximum vertical distance from the Galactic plane), and the orbital eccentricity were computed using a Galactic potential integrator kindly provided by D. Lin (see Reddy et al. 2003). Orbital parameters were computed assuming the Sun’s distance to be 8.5 kpc from the Galactic center. The computed orbital parameters , , for the sample stars are given in Tables 1 2. The value is the mean of and .
The uncertainties in the derived values are due mainly to uncertainties in the parallaxes. Uncertainties of the proper motions, in general, do not exceed 1. Most of the selected stars have parallax errors of less than 15. Four stars have parallax errors between 20-25. Errors in are estimated by computing the quadratic sum of errors due to errors in parallaxes, proper motions, and radial velocities.
From the combined catalogue (Arifyanto et al. plus Schuster et al.), we initially selected 60 stars for abundance analysis (see below). Errors in are less than 20 km s-1 for two thirds of the sample. For about 20 stars errors are in between 20 - 50 km -1. Large errors are, mostly, found for halo stars which have large velocities. Out of 60 stars in our study, 33 stars have Hipparcos astrometry (Perryman et al. 1997), which we have adopted except for three stars: G060-026, G090-003, and G016-013. (Arifyanto et al. adopted Hipparcos data for all the Hipparcos stars except for those which have parallaxes less than 5 mas) For the latter two, we used photometric parallaxes from Arifyanto et al. catalogue, and for G060-026 astrometry is taken from the Schuster catalogue. The remaining 30 stars are compared with the new astrometry deduced from recalibration of the Hipparcos data (van Leeuwen 2007). The difference in proper motions between old and recalibrated data is less than 1 for most stars and for 4 stars it is in between 1-5. The difference in parallaxes between the two datasets is, in general, less than 10. For seven stars, it is as high as 20. The differences in astrometry result in differences of about 5 - 10 km s-1 in at least one velocity component.


2.1 The Arifyanto et al. catalogue
Arifyanto et al.’s (2005) sample of 742 subdwarfs is drawn from the proper motion selected samples gathered and discussed by Carney et al. (1994, here CLLA). Arifyanto et al. adopted CLLA’s radial velocities and spectroscopic metallicities but their photometric parallaxes were replaced by either the Hipparcos measurement or a photometric parallax for those stars for which there was no Hipparcos accurate measurement. Proper motions (and parallaxes) were taken from the Astrometric Catalog TYC2+HIP (Wielen et al. 2001). The Tycho-2 proper motions represent about a factor of ten improvement in accuracy over the values adopted by CLLA.
Arifyanto et al.’s primary sample of 483 CLLA stars has kinematics from TYC2 proper motions, Hipparcos parallaxes, and CLLA’s radial velocities. Their secondary sample of 259 stars uses photometric parallaxes obtained from the comparison between CLLA’s photometric parallaxes and Hipparcos parallaxes for those stars with an accurate Hipparcos parallax. The most metal-poor stars, say [Fe/H] , have distances and space velocities determined predominantly from photometric parallaxes, a result traceable to the decline in the stellar density distribution with decreasing [Fe/H]. (This characteristic also applies to Schuster et al.’s catalogue.)
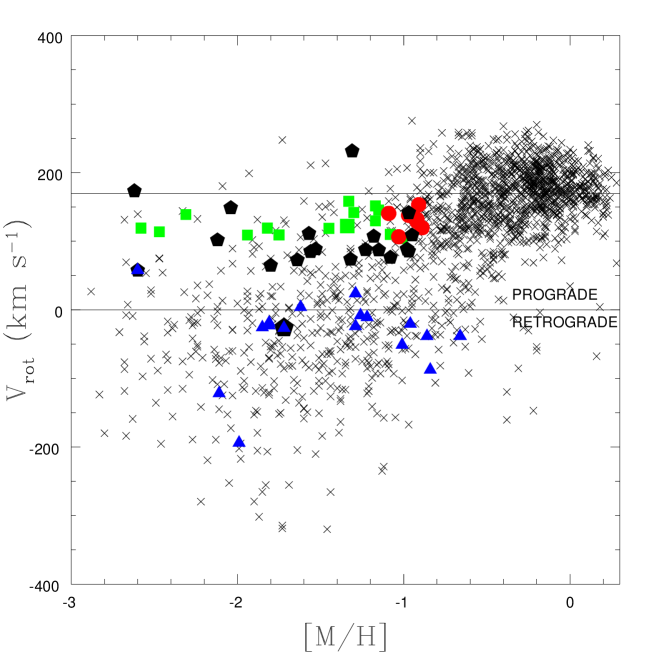
Distribution functions for the considered (primary plus secondary) sample are shown in Figure 1 (shown by solid line). The sample is dominated by old thin and thick disc stars (top left panel in Figure 1). Three panels show the distribution functions for Galactic rotational velocity Vrot (= VLSR + 220 km s-1) in three metallicity bins. The entire sample is shown in the ([M/H], Vrot) plane in Figure 2a.
The CLLA sample was developed in two steps. Carney & Latham (1987) selected high proper motion stars from the Lowell and Luyten catalogues by criteria designed to isolate F, G, and early K main sequence stars. An additional criterion was imposed to select the ‘dynamically hottest’ stars, i.e., stars had to have at least two-thirds of their (high) proper motion directed perpendicular to the disc or radially in the Galactic frame. Obviously, application of this criterion reduces the opportunity for thick disc stars to be chosen from the proper motion catalogues. CLLA removed this kinematic bias criterion and added about 500 (high proper motion) stars.
Arifyanto et al. note that the CLLA sample contains 1464 stars of which kinematics are given for 1269, metallicity for 1261, and radial velocity for 1447, and about 15% belong to binary or multiple stellar systems. Arifyanto et al.’s sample of 742 (483 primary and 259 secondary) stars comprise about half of the CLLA sample.
Our interest in Arifyanto et al.’s catalogue was piqued by their conclusion that in the metallicity range [Fe/H] there are ‘a significant number of subdwarfs with disklike kinematics’, i.e., metal-weak thick disk stars. This conclusion and procedures for identifying metal-weak thick disk stars are discussed below.
2.2 The Schuster et al. catalogue
Schuster et al. (2006) present a compilation of photometry and complete kinematic data for 1533 high-velocity and metal-poor stars. When known and suspected binaries, probable variables, and stars with lower quality photometry are excluded, the final database includes 1211 stars. Schuster et al.’s compilation draws on multiple sources of high proper motion stars and metal-poor stars. Sources include the CLLA catalogue, a similar one by Sandage & Fouts (1987) which has a 35% overlap with CLLA’s catalogue, and other lists from the literature and private submissions.
Schuster et al.’s catalogue includes Strömgren photometric estimates of metallicity [M/H], distances from Hipparcos parallaxes when the error is less than 10% or alternatively from calibrations based primarily on Hipparcos parallaxes, and Galactic velocities from published proper motions and radial velocities. Using the catalogue’s astrometry, we have recomputed (ULSR, VLSR, WLSR) for the sample stars (see above).
Distribution functions for Schuster et al.’s sample are shown in Figure 1 (dotted line) in the same format as for the Arifyanto et al.’s sample. Figure 2b shows clearly that the sample of halo stars ([M/H] 1.6) has a mean Vrot that is distinctly retrograde (V km s) whereas the sample in Figure 2a has a mean Vrot 0 km s-1. Sources other than the CLLA catalogue apparently provide significant difference between the Arifyanto et al. and Schuster et al. catalogue.
Schuster et al. recognize three stellar populations based on their - [M/H] diagram: the old thin disc, the thick disc, and the halo with mean metallicities and dispersions of ([M/H],) = , , and , respectively. Within the thick disc, two components are suggested with different mean metallicities ([M/H] of and ), rotation velocities, ages and velocity dispersions. The question of metal-weak thick disk stars is not raised by Schuster et al.
2.3 The combined catalogue
By combining Arifyanto et al.’s sample of 742 stars with Schuster et al.’s sample of 1211, we increase the sample to 1713 stars; there are 240 stars in common to the two samples. Our recalculation of the space velocities shows that the two samples give very similar results for the 240 stars in common. The two catalogues have been merged without adjustment of their space velocities as recalculated by us. Distribution functions for the combined sample are shown in the bottom four panels of Figure 1 with Figure 2c illustrating the sample in the ([M/H], Vrot) plane.
Since the metallicities are obtained from different techniques, we examine their consistency. CLLA obtain [M/H] from comparison of (generally) low S/N high-resolution spectra of a narrow interval around the Mg i b lines (Carney et al. 1994). Schuster et al. derive [Fe/H] from Strömgren indices. The mean difference, in the sense of (Arifyanto Schuster) is dex. We have corrected [M/H] values from Arifyanto et al. so that all the [M/H] values in the combined sample are on the Schuster’s scale.
2.4 Are there local metal-weak thick disc stars?
In principle, the thin disc, thick disc, and halo populations in the solar neighbourhood may be defined kinematically by their mean space velocities and velocity dispersions. At the metallicity of the metal-weak thick disk stars (i.e., [Fe/H] ), contamination by the thin disc is quite negligible and ignored here. Studies of local thick disc stars with [Fe/H] show that the stars in the mean have a rotational velocity less than the circular velocity of 220 km s-1 by about 50 km s-1 with a dispersion of about 50 km s-1. The mean velocities with respect to LSR in the and directions are close to zero with dispersions 67 km s-1 and 42 km s-1. Defining the kinematic criteria for halo stars in the solar neighbourhood is complicated by the suggestion that the halo consists of two components: an inner halo with a metallicity centered on [Fe/H] 1.6 and a small net prograde velocity, and an outer halo with a metallicity centered on [Fe/H] 2 and a net retrograde motion (see, for example, Carollo et al. 2007). The halo is considered to have no net motion in the and directions but the mean velocity in the direction of Galactic rotation is here assumed to correspond to = 220 km s-1. Velocity dispersions for the halo are about twice thick disc values.
In principle, a separation of metal-weak thick disk stars from halo stars could be based on relative probabilities following the method applied by Mishenina et al. (2004) and Reddy et al. (2006) to isolate samples of local thick disc stars with [Fe/H] in the presence of thin disc (and halo) stars. In practice, application of the method to metal-weak thick disk stars is severely hindered by three issues: (i) the velocity characteristics of the metal-weak thick disk must be extrapolated from those measured for the dominant thick disc ([Fe/H] 1) population, (ii) the relative population of metal-weak thick disk and halo stars is not known a priori, and (iii) selection effects permeate the chosen catalogues with ill-understood effects on their consequences for the metal-weak thick disk to halo mixture.
Evidence for metal-weak thick disk stars is suggested by Arifyanto et al. but occasions no comment by Schuster et al. from their much larger data set. To address this odd circumstance, we discuss the two catalogues separately, and the combined one. This discussion brings to the fore the kinematical definition of a thick disc star and the possible dependence of this definition on metallicity.
2.4.1 Arifyanto et al.’s catalogue
Arifyanto et al.’s claim that ‘In the intermediate metallicity range ( [Fe/H] ), we find a significant number of subdwarfs with disklike kinematics’ (i.e., metal-weak thick disk stars) is made from the histograms reconstructed in Figure 1 (solid line).111Arifyanto et al. provide separate histograms for samples with an accurate Hipparcos parallax and with a photometric parallax. These samples provide similar-looking histograms and we chose not to make a distinction by source of parallax in order to increase the number of contributing stars. The top left histogram shows the metallicity distribution for the sample. The other three histograms show the distribution with for three metallicity bins. The well sampled [Fe/H] histogram is peaked at about the expected velocity of the thick disc and with a width anticipated from published measures of the dispersion (). (Old thin disc stars may also contribute to this histogram.) The few stars with [Fe/H] provide a histogram that is approximately symmetrical about with a width expected for stars with halo kinematics. The intermediate metallicity bin, [Fe/H] is neither symmetrical about = 0 of the halo or Vrot = 170 of the thick disc but might be resolved into halo and thick disc contributions. It is this thick disc contribution that yields the metal-weak thick disk stars recognized by Arifyanto et al. However, the halo contribution requires a velocity dispersion less than that indicated by the bin with [Fe/H] , and the thick disc contribution calls for a distribution centred on a velocity km s-1, a velocity lag substantially larger than that associated with the thick disc at [Fe/H] . Furthermore, isolation of these metal-weak thick disk candidates is based on very small samples. The asymmetrical histogram for [Fe/H] was Arifyanto et al.’s evidence for subdwarfs with disclike kinematics.
The full sample is shown in Figure 2a where we plot against [M/H]. A first impression is that the stars may be separated into two groups. This is not a novel conclusion. Carney et al. (1996) in describing their version of Figure 2 composed of 1022 stars wrote ‘it almost appears that there are (at least) two quite distinct populations: one metal-poor and dynamically hot, and the other metal-rich and dynamically cool (disk-like), and that there is no obvious sign of evolution of one into the other’. The disc-like group with [Fe/H] consists of thick disc stars with contamination likely by old thin disc stars. The metal-poor dynamically-hot stars are taken to belong to the halo. Sandage & Fouts (1997) in a similar diagram using ultraviolet excess in lieu of [Fe/H] remarked on the ‘abrupt break in the number of stars at , with a much thinner distribution for ’; corresponds to [Fe/H] with the authors’ calibration. Sandage & Fouts note that the distribution of W velocities indicates that the densely and thinly populated distributions correspond to the thick disc and the halo, respectively.
Arifyanto et al.’s sample of metal-weak thick disk stars fall in Figure 2a across the interval [Fe/H] . Much more striking, however, is the paucity of stars in what might be termed the expected belt for metal-weak thick disk, that is stars within the strip centred on = 170 km s-1 with a width set by the dispersion km s-1. For [Fe/H , the strip is densely populated. At [Fe/H] , there are stars in the lower half of the strip but almost none in the upper half. Therefore, if the kinematical definition of the thick disc provided by local stars with [Fe/H] applies to more metal-poor thick disc stars, and if selection effects have not favoured stars in the lower half over those in the upper half of the strip, this catalogue contains almost no metal-weak thick disk stars.222Inspection of the thick disc selection made by Reddy et al. (2006) show that their values are not symmetrically distributed about km s-1. The reason for this is very simple; it is only stars with for which the probability of belonging to the thin disc drops to low values and that of belonging to the thick disc increases to a significant level.

2.4.2 Schuster et al.’s catalogue
Schuster et al.’s sample is shown in Figure 2b. There are differences between Figures 2a and 2b. The mean for the metal-poor stars in Figure 2b is obviously retrograde, as Schuster et al. note. The paucity of metal-weak stars in the strip centred on = 170 km s-1 is more obvious in Figure 2b than in Figure 2a. These differences highlight how (different) selection effects compound the difficulty of identifying metal-weak thick disk candidates.
Three groupings among stars with [Fe/H] greater than about were noted by Schuster et al. : (i) A concentration of old thin disc stars at ([Fe/H] in dex, in km s-1) = (,176), (ii) a group of thick disc stars at (), and (iii) a second group of thick disc stars at ().333Schuster et al.’s rotational velocities have been decreased by 9 km s-1, as noted above. Schuster et al. suggest that the more metal-poor of the two thick disc groups is older by about 3 Gyr. The possible existence of two thick disc groups complicates the identification of metal-weak thick disk stars. Two obvious complications may be mentioned. Perhaps, the age-metallicity difference between the two groups implies an evolutionary sequence for the thick disc and then the more metal-poor thick disc stars might have a even lower which would place them among halo stars. Alternatively, metal-weak thick disk stars might be associated with one or both of the groups of thick disc. Such metal-weak thick disk stars, especially those from the more metal-poor group, would fall among halo stars at the positive limits of the distribution for halo stars.


2.4.3 The combined catalogue
Although the ill-defined selection effects must not be forgotten, the sample of 1713 stars promises to reveal insights into the makeup of the metal-poor population less clearly glimpsed from the Arifyanto et al. sample of 742 stars and Schuster et al.’s sample of 1211 stars. The ([M/H],) diagram is shown in Figure 2c. Interpretation of Figure 2c is assisted by constructing histograms for bins in [M/H] (Figure 3). Scanning the histograms from the most metal-rich to the most metal-poor, we see the dominance of the thick disc at 170 km s-1 most distinctly and not surprisingly in the bin for [M/H] and the appearance of Schuster et al.’s second group in the [M/H] and [M/H] bins. The bin [M/H] bin, as might be expected, appears to be a mix of thin and thick disc stars. Oddly, the histogram for [M/H] , the interval providing the most metal-rich stars, is peaked at the canonical velocity of the thick disc stars. This is, perhaps, due to the selection effects emphasising high velocity stars made in the construction of Schuster’s catalogue. It may be interesting to note that thick disk may extend beyond 0.3 towards higher metallicity. The bins for [M/H] are filled with halo stars with no apparent signature of metal-weak thick disk stars, i.e., the histograms are symmetrical to within the noise about a velocity V km s-1. The mean declines with decreasing [M/H] but this is entirely attributable to Schuster et al.’s selection of stars.
A dissection of Figure 2c by [M/H] is shown in Figure 4 where it is reproduced for different intervals of vertical velocity . Here, one sees, as anticipated, the relative mix of disc to halo stars decline as increases. The thick disc is seen as a distinct concentration for km s-1, as expected because km s-1 for the thick disc. Figure 2c is resolved into bins in Figure 5 which seems to show, even more clearly than Figure 4, the sharp transition at [M/H] 1. The disc component is traceable to 200 km s-1 for [Fe/H] 0.8. Velocities 100 km-1 and 140 km s-1 ensures a partial exclusion of halo stars and the thin disk is excluded by [M/H]. Below [M/H] = 0.8 population of thin disk is significantly reduced compared to thick disk and halo. Figure 6 may suggest that stars below [M/H] = 1.0 and with 100 km s-1 and 140 km s-1 are probably thick disk stars not thin disk stars.
As noted above, calculation of a probability of a metal-poor star belonging to either the thick disc or the halo is fraught with uncertainty. Consideration of Figures 2c, 4, and 5 suggests that the criteria km s-1, km s-1 and km s-1 may enhance the ratio of metal-weak thick disk stars to halo stars selected from the combined catalogue. The limit on is based on the the distribution of stars with [M/H] in Figure 2c. As noted earlier, this selection criterion for metal-weak thick disk requires that the distribution for metal-weak thick disk stars differ from that for the more metal-rich thick disc stars. The criterion follows in part directly from Figure 5 but also from the simple condition that a disc-like star, i.e., one in a roughly circular Galactic orbit, cannot have a velocity that is a large fraction of its rotational velocity. The velocity condition follows from Figure 4.
Application of the velocity criteria to the combined catalogue yielded a list of stars that was further culled by declination and magnitude. A few stars satisfying all conditions were subsequently dropped from the abundance analysis because their absorption lines were broad or binarity was suspected. When the limit [Fe/H] 1.0 was applied following the abundance analysis, the fourteen candidate metal-weak thick disk stars in Table 1 met all criteria. The eight stars labeled as thick disc stars have [Fe/H] 1.0 but otherwise met the criteria. Twenty stars selected initially by a different set of criteria fail to satisfy the above velocity criteria, we label them as hybrid metal-weak thick disk/halo stars. This selection is likely a mix of thick disc stars and halo stars. A comparison sample of 18 halo stars were selected based on probability criteria with 0.95 (see for details Reddy et al. 2006). Probability criteria includes star’s as well as , velocities and their dispersions. The parameters of halo sample are listed in Table 2. Stars selected for abundance analysis are highlighted in Figure 7.
3 Observations
Spectra were obtained using the 2dcoudé echelle spectrograph (Tull et al. 1995) fed by the Harlan J. Smith 2.7-m telescope of the W.J. McDonald Observatory. Spectra were recorded on a Tektronix 2048 2048 CCD detector. Spectral coverage is similar to that provided by observations contributing to our earlier papers (Reddy et al. 2003, 2006). Present and earlier spectra were obtained with a resolving power of 60,000. Standard reduction procedures within 444IRAF is distributed by the National Optical Astronomy Observatories, which are operated by the Association of Universities for Research in Astronomy, Inc., under cooperative agreement with the National Science Foundation.” were used to convert the raw 2D-Spectra into 1D-spectra of relative flux versus wavelength and to measure equivalent widths (Wλ) of the selected lines.
Radial velocity measurements were made for all stars. Our measurements are in general in excellent agreement with values reported in the Arifyanto et al. and Schuster et al. catalogues. In two cases, a substantial difference was noted: e.g., G141-47, has a radial velocity of km s-1 but Schuster et al.’s catalogue lists km s-1, and the halo star HIP4754 has a radial velocity of km s-1 but Arifyanto et al.’s catalogue lists km s-1. We suppose that these may be examples of spectroscopic binaries. For all stars, our measured radial velocities were used with the parallax and proper motions from the catalogues to recompute the LSR velocities.
| Star | [Fe/H] | log | ||||||||||
| (K) | (K) | (cm s-2) | (km s-1) | (kpc) | (kpc) | (Gyrs) | ||||||
| Metal Weak Thick Disk Stars | ||||||||||||
| G242-071 | 1.15 | 5978 | 6030 | 3.61 | 1 | -118 | -89 | 47 | 6.75 | 0.529 | 0.479 | 13.1 |
| G172-058 | 1.53 | 6131 | 6250 | 4.78 | 25 | -93 | -110 | 19 | 6.03 | 0.572 | 0.163 | … |
| G071-055 | 1.54 | 5717 | 5750 | 4.78 | 30 | 112 | -100 | -44 | 6.46 | 0.558 | 0.417 | … |
| G102-020 | 1.17 | 5246 | 5340 | 4.63 | 20 | -4 | -68 | 70 | 6.52 | 0.306 | 0.731 | … |
| G146-076 | 1.78 | 5063 | 4960 | 4.11 | 113 | 51 | -81 | -90 | 6.43 | 0.389 | 1.166 | … |
| G062-052 | 1.11 | 5271s | 5450 | 4.50s | 47 | 50 | -61 | -83 | 6.86 | 0.315 | 0.892 | 20.5 |
| G166-045 | 2.32 | 6016 | … | 4.21 | 29 | 131 | -102 | 23 | 6.71 | 0.587 | 0.242 | … |
| G141-047 | 1.33 | 6083 | 6080 | 4.52 | 33 | 69 | -104 | -22 | 5.97 | 0.520 | 0.176 | 9.0 |
| (23) | ||||||||||||
| HD201891 | 1.05 | 5853 | 5850 | 4.09 | 43 | 102 | -111 | -51 | 6.16 | 0.577 | 0.516 | 18.1 |
| G188-022 | 1.29 | 5950 | 6020 | 4.26 | 93 | 139 | -99 | 62 | 6.85 | 0.598 | 0.732 | … |
| G060-026 | 1.14 | 5287 | 5300 | 4.00s | 114 | 80 | -116 | 89 | 5.90 | 0.572 | 1.124 | 10.9 |
| G014-033 | 1.04 | 5285 | 5344 | 4.81 | 91 | -99 | -70 | -90 | 7.02 | 0.445 | 1.253 | … |
| HD16031 | 1.62 | 6076 | 6238 | 4.01 | 25 | 37 | -95 | -30 | 5.72 | 0.528 | 0.272 | 16.5 |
| G090-003 | 1.89 | 5727 | … | 4.89 | 30 | -15 | -106 | -7 | 5.70 | 0.493 | 0.050 | … |
| Thick Disk Stars | ||||||||||||
| G084-037 | 0.94 | 5953 | 5950 | 4.23 | 13 | 18 | -89 | 95 | 6.18 | 0.394 | 1.249 | 13.8 |
| G113-022 | 1.00 | 5601 | 5570 | 4.25s | 56 | 34 | -80 | 64 | 6.36 | 0.367 | 0.649 | 10.0 |
| G010-012 | 0.64 | 4930 | 5035 | 3.50s | 133 | -53 | -91 | 96 | 6.24 | 0.434 | 1.274 | … |
| G236-082 | 0.57 | 5622 | 5620 | 4.81 | 71 | -81 | -67 | -96 | 7.01 | 0.378 | 1.320 | 7.5 |
| G066-051 | 0.91 | 5234 | 5260 | 4.80 | 118 | -86 | -79 | -68 | 6.67 | 0.437 | 0.770 | … |
| G126-036 | 0.78 | 5632 | 5620 | 4.78 | 86 | 81 | -113 | 8 | 5.88 | 0.570 | 0.064 | 12.0 |
| G029-025 | 0.84 | 5407 | 5300 | 4.63 | 87 | -102 | -103 | 25 | 6.25 | 0.531 | 0.243 | … |
| G262-032 | 0.87 | 5000 | 5100 | 4.75s | 87 | 118 | -82 | 74 | 6.99 | 0.502 | 0.920 | … |
| Thick disc/Halo | ||||||||||||
| G172-016 | 0.98 | 5621 | 5620 | 4.50s | 84 | -88 | -146 | 32 | 5.37 | 0.722 | 0.278 | … |
| G058-025 | 1.34 | 5936 | 6020 | 4.09 | 66 | -25 | -135 | 19 | 5.23 | 0.636 | 0.141 | 18.6 |
| HD97916 | 0.82 | 6238 | 6270 | 3.55 | 63 | 116 | 11 | 103 | 10.24 | 0.363 | 1.811 | 7.3 |
| G016-013 | 0.89 | 5550 | 5680 | 4.00s | 51 | -27 | -133 | 15 | 5.27 | 0.626 | 0.107 | 3.8 |
| G017-016 | 0.77 | 5238 | 5357 | 4.77 | 162 | -140 | -111 | -19 | 6.63 | 0.634 | 0.168 | … |
| G139-049 | 0.94 | 5344 | 5465 | 4.87 | 94 | -26 | -131 | -7 | 5.28 | 0.623 | 0.056 | … |
| G204-049 | 0.91 | 5151 | 5260 | 4.80 | 41 | 171 | -77 | -59 | 8.01 | 0.592 | 0.754 | … |
| G241-007 | 0.75 | 5593 | 5648 | 4.80 | 112 | -46 | -133 | -21 | 5.31 | 0.640 | 0.165 | 11.5 |
| G143-017 | 1.41 | 5435 | 5360 | 4.82 | 191 | -143 | -109 | 70 | 6.77 | 0.627 | 0.867 | … |
| G019-025 | 1.78 | 5009 | 5000 | 5.00s | 32 | 39 | -129 | -37 | 5.01 | 0.738 | 0.347 | … |
| G059-018 | 1.13 | 5035 | 5050 | 3.60 | 33 | -92 | -146 | 9 | 5.46 | 0.709 | 0.037 | … |
| G027-008 | 1.31 | 5845 | 5845 | 4.74 | 53 | -87 | -129 | -97 | 5.74 | 0.647 | 1.419 | 12.4 |
| G271-162 | 2.33 | 6009 | … | 4.14 | 37 | -162 | -47 | 29 | 8.65 | 0.511 | 0.315 | 10.2 |
| G005-001 | 0.91 | 5704 | 5620 | 4.52 | 22 | 44 | -121 | -82 | 5.73 | 0.533 | 0.877 | 18.5 |
| G123-009 | 1.16 | 5379 | 5380 | 4.74 | 22 | -104 | -146 | -19 | 5.53 | 0.729 | 0.161 | … |
| G016-020 | 1.59 | 5386 | 5550 | 4.94 | 171 | 180 | -71 | 93 | 8.55 | 0.595 | 1.519 | … |
| G204-030 | 0.83 | 5570 | 5570 | 4.72 | 69 | 58 | -131 | 47 | 5.42 | 0.631 | 0.434 | … |
| G037-026 | 1.89 | 5918 | … | 4.41 | 140 | 167 | -118 | -60 | 7.00 | 0.691 | 0.721 | … |
| HIP96115 | 2.66 | 5500 | … | 3.39 | 128 | 55 | -161 | -67 | 4.95 | 0.772 | 0.672 | … |
| HIP4754 | 1.72 | 5518 | 5550 | 3.95 | 70 | -116 | -246 | 5 | 5.08 | 0.921 | 0.041 | … |
| (87) | ||||||||||||
| Star | [Fe/H] | log | ||||||||||
|---|---|---|---|---|---|---|---|---|---|---|---|---|
| (K) | (cm s-2) | (km s-1) | (kpc) | (kpc) | (Gyrs) | |||||||
| HIP3026 | 1.22 | 5982 | 6050 | 4.77 | 47 | 145 | -231 | -33 | 91.05 | 0.997 | 9.069 | 15.2 |
| HIP3430 | 1.81 | 6129 | … | 3.75 | 121 | -137 | -243 | 51 | 5.32 | 0.936 | 0.534 | 16.3 |
| HIP10449 | 0.89 | 5648 | 5620 | 4.40 | 28 | -196 | -196 | 65 | 6.88 | 0.952 | 1.043 | … |
| HIP15904 | 1.38 | 5746 | 5746 | 4.50s | 87 | -108 | -262 | -36 | 5.16 | 0.859 | 0.295 | … |
| HIP16404 | 1.98 | 5241 | 5200 | 4.76 | 161 | -165 | -414 | -65 | 9.58 | 0.498 | 0.924 | … |
| HIP38541 | 1.62 | 5394 | 5394 | 4.74 | 234 | 270 | -216 | -81 | 5111.13 | 0.999 | 9850.129 | … |
| HIP42887 | 1.29 | 6793 | 6793 | 3.51 | 58 | -40 | -244 | -82 | 4.52 | 0.916 | 0.594 | 6.7 |
| HIP80837 | 0.63 | 5931 | 5900 | 3.79 | 47.4 | 96 | -258 | -70 | 4.88 | 0.866 | 0.475 | 10.9 |
| HIP86321 | 0.86 | 6017 | 6017 | 4.06 | 239.9 | -74 | -258 | -44 | 4.83 | 0.865 | 0.343 | 11.7 |
| HIP86443 | 2.21 | 5977 | … | 3.96 | 397.2 | -356 | -246 | 86 | 21.15 | 0.984 | 3.571 | … |
| HIP94449 | 1.02 | 6194s | 5800 | 4.25s | 64.8 | 162 | -307 | 59 | 6.62 | 0.731 | 0.652 | 6.3 |
| HIP100568 | 0.96 | 5735 | 5622 | 4.70 | 171.3 | -146 | -240 | -66 | 13.56 | 0.981 | 1.343 | 14.2 |
| HIP100682 | 2.11 | 5500 | … | 4.50s | 322.9 | -41 | -342 | -87 | 6.01 | 0.458 | 1.061 | … |
| HIP100792 | 1.01 | 5997 | 5997 | 4.14 | 246.8 | -66 | -271 | -23 | 4.92 | 0.808 | 0.171 | 13.1 |
| HIP105488 | 1.26 | 5928 | 5800 | 4.86 | 272.8 | -161 | -228 | 62 | 1605.62 | 0.999 | 2847.656 | … |
| HIP106924 | 1.81 | 5400 | 5370 | 4.86 | 244.4 | 99 | -239 | 115 | 157.70 | 0.998 | 49.767 | … |
| HIP111195 | 1.63 | 5880 | 5950 | 4.65 | 213.1 | 17 | -265 | 61 | 4.65 | 0.824 | 0.578 | 16.9 |
| HIP117041 | 0.93 | 5357s | 5150 | 4.00s | 86.2 | -251 | -245 | -34 | 8.81 | 0.962 | 0.413 | … |
4 Abundance Analysis
Abundance analysis follows procedures used by Reddy et al. (2003, 2006). Abundances are derived using equivalent widths and LTE model atmosphere grids combined with the spectral analysis code MOOG (Sneden 1973). Stellar atmospheric models (Kurucz 1998) computed for LTE with the convective overshooting option are employed in the analysis. The model for a particular , log , and metallicity is extracted from the grid by linear interpolation. The choice of convective overshooting models over convective models without overshooting is discussed in Reddy et al. (2003) with justification for solar type stars by (Castelli, Gratton, Kurucz 1997). Stars in our earlier surveys of thin disc and thick disc stars and the present metal-weak thick disk candidates are all main sequence stars within about 600 K of the solar Teff. There is of course a difference in metallicity between our stars and the Sun. Differences in abundance ratios [X/Fe], between convective and over convective models were earlier shown to be very small.
| Star | [Fe i/H] | Na | Mg | Al | Si | Ca | Sc | Ti | V | Cr | Mn | Ni | Cu | Ba | Eu |
| Metalweak Thick Disk | |||||||||||||||
| G242-71 | -1.15 | -0.21 | 0.22 | 0.22 | 0.18 | 0.39 | -0.02 | 0.30 | 0.17 | -0.13 | -0.63 | 0.00 | -0.57 | 0.50 | 0.79 |
| G172-58 | -1.53 | … | 0.29 | … | 0.46 | 0.35 | 0.32 | 0.38 | 0.01 | -0.32 | -0.48 | -0.22 | -0.37 | -0.02 | 0.31 |
| G71-55 | -1.54 | 0.00 | 0.08 | 0.40 | 0.16 | 0.24 | 0.34 | 0.220 | 0.07 | -0.37 | -0.53 | -0.17 | -0.53 | 0.23 | 0.54 |
| G102-20 | -1.17 | 0.02 | 0.27 | 0.33 | 0.24 | 0.22 | 0.26 | 0.19 | 0.04 | -0.16 | -0.45 | -0.09 | -0.10 | -0.08 | 0.27 |
| G146-76 | -1.78 | … | 0.19 | … | 0.28 | 0.17 | 0.54 | 0.10 | -0.06 | -0.27 | -0.76 | -0.12 | -0.96 | 0.04 | 0.43 |
| G62-52 | -1.11 | 0.12 | 0.28 | 0.43 | 0.35 | 0.25 | 0.29 | 0.19 | -0.07 | -0.12 | -0.49 | -0.03 | -0.23 | -0.03 | 0.49 |
| G166-45 | -2.32 | … | 0.22 | … | … | … | 0.38 | … | 0.18 | … | … | … | … | -0.51 | 1.02 |
| G141-47 | -1.33 | 0.06 | 0.34 | 0.45 | 0.33 | 0.36 | 0.15 | 0.26 | 0.56 | -0.27 | -0.56 | -0.08 | … | 0.16 | 0.59 |
| HD201891 | -1.05 | 0.14 | 0.35 | 0.24 | 0.16 | 0.20 | 0.05 | 0.22 | 0.09 | -0.14 | -0.43 | 0.04 | -0.25 | -0.05 | 0.07 |
| G188-22 | -1.29 | 0.02 | 0.31 | 0.26 | 0.25 | 0.31 | 0.14 | 0.32 | 0.14 | -0.17 | -0.40 | -0.06 | -0.60 | 0.36 | 0.29 |
| G60-26 | -1.14 | -0.32 | 0.21 | 0.09 | 0.15 | 0.23 | 0.06 | 0.15 | -0.15 | -0.14 | -0.44 | -0.13 | -0.76 | 0.18 | 0.48 |
| G14-33 | -1.04 | -0.05 | 0.22 | 0.33 | 0.21 | 0.23 | 0.21 | 0.23 | 0.11 | -0.21 | -0.39 | 0.05 | -0.09 | 0.02 | 0.27 |
| HD16031 | -1.62 | -0.04 | 0.32 | … | 0.35 | 0.32 | 0.10 | 0.36 | 0.07 | -0.26 | … | -0.09 | … | -0.07 | 0.21 |
| G90-3 | -1.89 | 0.14 | 0.05 | … | … | 0.24 | 0.50 | … | -0.14 | -0.49 | … | -0.27 | … | 0.00 | 0.67 |
| Thick Disc Stars | |||||||||||||||
| G84-37 | -0.94 | 0.06 | 0.30 | … | 0.37 | 0.29 | 0.09 | 0.33 | 0.11 | -0.02 | -0.35 | -0.04 | -0.52 | 0.20 | 0.28 |
| G113-22 | -1.00 | -0.05 | 0.29 | 0.27 | 0.27 | 0.24 | 0.29 | 0.24 | -0.02 | -0.11 | -0.66 | 0.03 | -0.33 | 0.49 | 0.35 |
| G10-12 | -0.64 | 0.19 | 0.43 | 0.48 | 0.31 | 0.29 | 0.13 | 0.28 | 0.16 | 0.03 | -0.32 | 0.24 | 0.06 | … | … |
| G236-82 | -0.57 | -0.01 | 0.23 | 0.26 | 0.17 | 0.14 | 0.30 | 0.17 | 0.07 | -0.09 | -0.27 | 0.06 | -0.07 | -0.02 | 0.17 |
| G66-51 | -0.91 | -0.03 | 0.20 | 0.22 | 0.21 | 0.22 | 0.26 | 0.25 | 0.09 | -0.07 | -0.39 | 0.03 | 0.01 | -0.05 | 0.37 |
| G126-36 | -0.78 | 0.02 | 0.21 | 0.21 | 0.16 | 0.20 | 0.12 | 0.14 | 0.10 | -0.07 | -0.41 | -0.02 | -0.10 | 0.71 | 0.31 |
| G29-25 | -0.84 | 0.06 | 0.31 | 0.29 | 0.23 | 0.33 | 0.16 | 0.35 | 0.08 | -0.02 | -0.35 | 0.06 | -0.03 | 0.01 | 0.24 |
| G262-32 | -0.87 | 0.05 | 0.27 | 0.39 | 0.31 | 0.33 | 0.19 | 0.39 | 0.07 | 0.02 | -0.26 | 0.08 | 0.10 | 0.70 | 0.31 |
| Thick Disc/Halo | |||||||||||||||
| G172-16 | -0.98 | -0.11 | 0.03 | 0.07 | 0.18 | 0.13 | 0.09 | 0.09 | -0.02 | -0.37 | -0.70 | -0.14 | -0.94 | 0.31 | 0.50 |
| G58-25 | -1.34 | 0.06 | 0.19 | 0.33 | 0.22 | 0.39 | 0.02 | 0.28 | 0.09 | -0.19 | -0.61 | -0.08 | -0.50 | 0.25 | 0.14 |
| HD97916 | -0.82 | -0.07 | 0.22 | 0.08 | 0.20 | 0.32 | 0.12 | 0.15 | 0.00 | -0.24 | -0.56 | 0.02 | -0.64 | 0.25 | … |
| G16-13 | -0.89 | 0.10 | 0.32 | 0.34 | 0.31 | 0.26 | 0.23 | 0.16 | -0.07 | -0.19 | -0.51 | -0.02 | -0.27 | 0.29 | 0.31 |
| G17-16 | -0.77 | 0.05 | 0.27 | 0.36 | 0.31 | 0.23 | 0.12 | 0.27 | 0.08 | -0.11 | -0.36 | 0.05 | 0.04 | -0.06 | 0.35 |
| G139-49 | -0.94 | 0.04 | 0.21 | 0.33 | 0.30 | 0.21 | 0.25 | 0.15 | 0.09 | -0.11 | -0.41 | 0.13 | 0.01 | -0.07 | 0.30 |
| G204-49 | -0.91 | 0.06 | 0.25 | 0.29 | 0.28 | 0.19 | 0.32 | 0.23 | 0.06 | -0.10 | -0.39 | 0.11 | -0.14 | 0.00 | 0.38 |
| G241-7 | -0.75 | 0.03 | 0.25 | 0.38 | 0.17 | 0.28 | 0.26 | 0.32 | 0.06 | -0.12 | -0.42 | -0.01 | -0.14 | 0.15 | 0.28 |
| G143-17 | -1.41 | … | 0.12 | … | … | 0.21 | -0.04 | 0.17 | 0.00 | -0.09 | -0.54 | -0.24 | -0.51 | -0.01 | 0.39 |
| G19-25 | -1.78 | … | 0.26 | … | 0.28 | 0.30 | 0.02 | 0.30 | 0.15 | -0.08 | -0.76 | -0.08 | … | -0.17 | 0.71 |
| G59-18 | -1.13 | -0.17 | 0.29 | … | 0.23 | 0.23 | 0.14 | 0.11 | -0.16 | -0.15 | -0.59 | -0.08 | -0.50 | 0.21 | 0.34 |
| G27-8 | -1.31 | 0.11 | 0.26 | … | 0.25 | 0.25 | 0.01 | 0.30 | -0.02 | -0.28 | -0.52 | -0.18 | -0.33 | 0.00 | 0.52 |
| G271-162 | -2.33 | … | 0.63 | … | … | 0.33 | 0.40 | … | 0.48 | -0.44 | … | -0.02 | … | … | … |
| G5-1 | -0.91 | -0.03 | 0.13 | 0.26 | 0.15 | 0.15 | 0.06 | 0.22 | -0.02 | -0.17 | -0.47 | -0.08 | -0.27 | -0.21 | 0.33 |
| G123-9 | -1.16 | -0.15 | 0.25 | 0.34 | 0.32 | 0.28 | 0.17 | 0.23 | -0.04 | -0.18 | -0.62 | -0.12 | -0.44 | 0.18 | 0.48 |
| G16-20 | -1.59 | -0.09 | 0.28 | … | 0.44 | 0.39 | 0.05 | 0.21 | -0.11 | -0.21 | -0.38 | 0.06 | … | 0.07 | 0.48 |
| G204-30 | -0.83 | 0.03 | 0.26 | 0.23 | 0.18 | 0.19 | 0.26 | 0.24 | 0.00 | -0.16 | -0.41 | 0.06 | -0.20 | -0.03 | 0.32 |
| G37-26 | -1.89 | -0.04 | 0.24 | … | 0.44 | 0.26 | -0.06 | … | … | -0.35 | -0.40 | -0.26 | … | … | … |
| HIP96115 | -2.66 | … | 0.33 | … | … | 0.71 | 0.25 | 0.48 | 0.17 | -0.38 | -0.43 | -0.08 | … | -0.42 | … |
| HIP4754 | -1.72 | … | 0.37 | … | 0.48 | 0.56 | 0.08 | … | 0.39 | -0.14 | -0.39 | 0.15 | -0.55 | -0.18 | 0.40 |
| Star | [Fe i/H] | Na | Mg | Al | Si | Ca | Sc | Ti | V | Cr | Mn | Ni | Cu | Ba | Eu |
|---|---|---|---|---|---|---|---|---|---|---|---|---|---|---|---|
| HIP 3026 | -1.20 | 0.00 | 0.10 | 0.28 | 0.26 | 0.36 | 0.19 | 0.19 | 0.09 | -0.22 | -0.52 | -0.12 | -0.55 | 0.33 | 0.50 |
| HIP 3430 | -1.81 | … | 0.07 | … | … | 0.27 | -0.10 | 0.13 | -0.09 | -0.24 | … | -0.34 | … | -0.36 | … |
| HIP10449 | -0.89 | 0.00 | 0.31 | 0.32 | 0.21 | 0.20 | 0.17 | 0.20 | 0.35 | -0.12 | -0.41 | -0.03 | -0.27 | 0.13 | 0.19 |
| HIP15904 | -1.38 | 0.12 | 0.28 | 0.22 | 0.31 | 0.25 | 0.12 | 0.26 | 0.23 | -0.09 | -0.18 | 0.10 | … | -0.01 | 0.50 |
| HIP16404 | -1.98 | … | 0.26 | … | … | 0.17 | -0.08 | 0.31 | 0.08 | -0.08 | -0.55 | -0.21 | -0.27 | -0.44 | 0.54 |
| HIP38541 | -1.62 | -0.15 | 0.26 | … | 0.45 | 0.28 | 0.02 | 0.24 | 0.20 | -0.13 | -0.63 | -0.16 | -0.62 | -0.10 | 0.32 |
| HIP42887 | -1.29 | … | 0.26 | … | 0.20 | 0.27 | 0.01 | … | 0.25 | -0.21 | … | -0.17 | … | -0.19 | 0.30 |
| HIP80837 | -0.63 | 0.06 | 0.34 | 0.22 | 0.13 | 0.19 | 0.01 | 0.24 | 0.22 | -0.09 | -0.40 | -0.02 | -0.11 | -0.29 | 0.03 |
| HIP86321 | -0.86 | 0.00 | 0.11 | 0.05 | 0.02 | 0.16 | 0.00 | 0.07 | 0.01 | -0.17 | -0.48 | -0.17 | -0.37 | 0.21 | 0.20 |
| HIP86443 | -2.21 | … | 0.30 | … | … | 0.33 | 0.38 | … | 0.53 | -0.05 | … | -0.07 | … | -0.40 | 0.73 |
| HIP94449 | -1.02 | 0.07 | 0.26 | 0.36 | 0.17 | 0.31 | 0.20 | 0.33 | 0.23 | 0.03 | -0.48 | -0.04 | -0.47 | 0.18 | 0.37 |
| HIP100568 | -0.96 | -0.26 | 0.08 | 0.16 | 0.07 | 0.13 | 0.01 | 0.13 | -0.10 | -0.10 | -0.61 | -0.18 | -0.72 | 0.04 | 0.51 |
| HIP100682 | -2.11 | … | … | … | … | … | … | … | -0.15 | … | -0.49 | … | … | -0.64 | … |
| HIP100792 | -1.01 | -0.07 | 0.19 | -0.09 | 0.08 | 0.18 | -0.05 | 0.18 | 0.05 | -0.12 | -0.49 | -0.03 | -0.50 | -0.01 | 0.25 |
| HIP105488 | -1.26 | -0.01 | 0.31 | 0.13 | 0.28 | 0.24 | 0.17 | 0.25 | 0.12 | -0.10 | -0.51 | 0.00 | … | -0.10 | 0.49 |
| HIP106924 | -1.81 | 0.10 | 0.33 | 0.59 | 0.13 | 0.26 | 0.30 | 0.35 | 0.14 | -0.12 | -0.63 | -0.14 | … | 0.11 | 0.36 |
| HIP111195 | -1.63 | 0.10 | 0.33 | … | 0.48 | 0.18 | 0.30 | 0.28 | 0.24 | -0.30 | … | 0.01 | -0.17 | 0.33 | 0.65 |
| HIP117041 | -0.93 | 0.16 | 0.34 | 0.52 | 0.30 | 0.34 | 0.10 | 0.23 | -0.02 | -0.05 | -0.35 | 0.04 | -0.01 | -0.16 | 0.09 |
4.1 Atmospheric Parameters
Atmospheric parameters of the programme stars were derived using procedures described previously (Reddy et al. 2003, 2006).
4.1.1 Effective Temperature
The for a star was derived from its colour and calibrations based on the infrared flux method (IRFM) from Alonso et al. (1996). The magnitudes for were taken from the 2MASS Catalog555This publication makes use of data products from the Two Micron All Sky Survey, which is a joint project of the University of Massachusetts and the Infrared Processing and Analysis Center/California Institute of Technology, funded by the National Aeronautics and Space Administration and the National Science Foundation (Cutri et al. 2003) and the magnitudes were taken either from or from the Arifyanto et al. and Schuster et al. catalogues. The 2MASS catalog provides the magnitude ( for small) not the usual magnitude which was used in Alonso’s calibrations. Differences between the two magnitudes and the resulting effect on the final are very small, as shown by Reddy et al. (2006). In deriving , reddening was taken into account. Reddening values, E(B-V), were taken from Carney et al. (1994) and were converted to E(V-Ks) using R = 3.1. Typical reddening for the sample is E(B-V)= 0.02 and in very few cases E(B-V) is as large as 0.05. An E(B-V) = 0.05 corresponds to a 200 K correction.
Comparison of the derived from photometry and from spectroscopic criteria shows that the mean difference () is just 1.2 K with = 158 K. Five stars show a much larger difference ( 200 K). By excluding the five stars, is 29 k with = 88 K i.e., the photometric is cooler on average by 29 K than the spectroscopic . We have adopted the photometric for most of the stars. For the three stars (G62-52, HD 94449, HIP 117041), for which 200 K, we used the spectroscopic . Adopted ’s are given in Tables 1 and 2.
4.1.2 Surface gravity and Ages
Adopted surface gravities (log ) are derived using the standard relation between log , mass, and distance (Reddy et al. 2006). Distances for all the stars are provided either from the catalogue or from the source catalogues. Stellar mass has been estimated using the combination of , Mv and the stellar theoretical isochrones. For this study, Yonsei-Yale stellar tracks (Demarque et al. 2004) are used. Tracks are computed for a given metallicity and stellar mass (in steps of 0.01) for the constant -enhancement of [/Fe]=0.2 for all the stars with [Fe/H] 1.0. Appropriate stellar masses and ages are found by evaluating how well the tracks coincide with the star’s given and Mv. Derived log values and the ages are given in Tables 1 and 2. For many of the programme stars ages were not derived either due to a star’s position closeness to the main sequence or near the hook in the tracks. Errors in the ages are estimated using the uncertainties in , metallicities, and parallaxes.
The log values derived from parallaxes are compared with the gravities derived using the standard spectroscopic method of matching the abundances from neutral and singly ionized atoms of iron. In typical cases, the two methods yield consistent results. Where differences are large, the spectroscopic analysis is likely in error because the sample of Fe ii lines is small and limited to very weak lines. In some cases, we have just 2-3 Fe ii lines with an Wλ 3 mÅ. In some cases, the ‘parallax’ log is very uncertain, and then spectroscopic log is adopted if based on 3 or more Fe ii lines of moderate strength. The adopted gravities in the abundance analysis are given in Table 1 and 2. The log values adopted from spectroscopic analysis are marked with symbol ‘s’.
4.1.3 Microturbulence
The microturbulence is estimated using neutral lines of either Fe i or Ni i or both which have a relatively large number of lines with a range in s. The value of for a given star is the value for which abundances of different lines for a given atom are independent of Wλ. The measured values range 0.80 - 1.25 km s-1. For very metal-poor stars, there are few lines and/or an inadequate range in to measure . For those stars, we have assumed = 1 km s-1.

4.1.4 Metallicity
The Fe abundance is derived from Fe i transitions. This follows the procedure adopted earlier (Reddy et al. 2003, 2006). [Fe i/H] was used as metallicity. Metallicities [M/H] are derived using Strömgren photometry () and Alonso et al.’s (1996) calibrations. The [M/H] values are compared with the spectroscopic [Fe i/H] (Figure 8) assuming a solar abundance (Fe)⊙ = 7.45. The [Fe i/H] values are systematically more metal-rich than [M/H] values with a mean difference of 0.100.20. Two halo stars (HIP 3430 and HIP 100682) show large difference in metallicities.
4.2 Elemental Abundances
For the abundance determinations, we have retained and modified the line list used earlier (Reddy et al. 2003, 2006). This line list was chosen such that lines are useful for stars with [Fe/H] ranging from about 0.8 to 0.2. Stars in the present survey are metal-poor with [Fe/H] as low as 2.5. Some of the lines from our original list are very weak or absent at the metal-poor end of the sample. This necessitated a search for other lines so that an element throughout the [Fe/H] range of the sample is represented by the same lines. The -values for the new lines are taken from R.E. Luck’s compilation (private communication) and adjusted slightly so that the new and original line list gave the same abundances for a few stars with [Fe/H] 1.0 whose spectra contain all the lines. In addition to values, hyperfine splitting () must be considered for some elements. Lines of elements Sc, V, Mn and Cu are affected by . For Mn and Cu, we have used the same lines as in Reddy et al. (2003) but for Sc and V three new lines each are added: 5031.0Å, 5526.8Å, 5657.9Å lines for Sc ii and 4379.2Å, 4384.7Å and 4389.9Å lines for V ii. The data for all the lines were taken from Kurucz (1998), and analyzed the same way as in our earlier study. The difference in abundances for new and old lines is small (0.05) which is within the errors resulting from uncertainties in model parametesr and line strength measurements.
Abundances are given in Tables 3 and 4. The uncertainties are estimated to be [Fe/H] 0.10 dex and [X/Fe] = 0.05 - 0.10 for most of the elements. The estimated uncertainties are based on estimated errors in our derived model parameters: = 100 K, = 0.25 cm s-2, = 0.25 dex, = 0.25 km s-1, and = 2 mÅ.
4.3 Comparisons with published studies
Some stars in our sample have been included in recent abundance analyses. Three published abundance analyses are considered here: Gratton et al. (2003a,b), Jonsell et al. (2005), and Zhang & Zhao (2005). Inter-comparison of results is not only a check for systematic errors but opens up the possibility that samples may be combined to extend the dataset with which to search for abundance signatures of metal-weak thick disk candidates that may set them apart from halo stars.
Our [Fe i/H] for the stars in common agree well with other studies. For example, our values based on 15 common stars are metal-rich by 0.070.10 dex compared to Gratton et al. (2003a) values. The mean difference between us and Jonsell et al. (2005) is 0.130.14 while it is 0.040.22 between us and Zhang and Zhao (2005) - see Table 5.
Gratton et al. analysed 150 main sequence and turn-off stars in a uniform manner starting from their own newly measured or published equivalent widths from Fulbright (2000), Nissen & Schuster (1997), and Prochaska et al. (2000). There are 15 stars in common between us and Gratton et al. with [Fe/H] spanning the range from about 0.8 to 2.3. Gratton et al.’s abundances come from a LTE analysis using Kurucz model atmospheres with the effective temperature obtained from colours (B-V and ) with supplementary estimates from either the H profile or the infrared flux method, the surface gravity from the absolute magnitudes and theoretical isochrones and checked against ionization equilibrium for neutral and singly-ionized iron. Abundances are given with respect to a solar abundance analysis using the Kurucz solar model. Differences in , , [Fe/H], and [X/Fe] for several elements are shown in Table 5. In most cases these are satisfactorily small and certainly comparable to the estimated uncertainties of both analyses. However, our [Mg/Fe] values are smaller by 0.14 dex compared to Gratton et al. Most of this can be attributed to the adopted solar Mg abundance in the analysis. We have adopted log (Mg) = 7.64 (Reddy et al. 2003) for the Sun and Gratton et al. used log (Mg) = 7.43 from their solar abundance analysis. The other contributor possibly be due to adoption of different sets of Mg i lines in the analysis. Gratton et al. used 10 Mg i lines against four in our study.
Jonsell et al. derived stellar parameters for 43 metal-poor stars from Strömgren photometry, and stellar isochrones using the Hipparcos parallax. MARCS models were used in an LTE analysis of lines also used to analyse the solar spectrum. Five of our stars were analysed by Jonsell et al. with the quintet spanning the [Fe/H] range from about 1.0 to 1.6. Differences in , , [Fe/H], and [X/Fe] for several elements are satisfactorily small in all cases and certainly comparable to the estimated uncertainties of both analyses (Table 5). However, our Fe and Ba ratios are significantly larger compared to Jonsell et.al. This difference in Fe may be attributed to use of different sets of Fe i lines in the studies. We have used 43 well defined Fe i lines against 18 lines in Jonsell et al. Only 4 lines are common with us. Another reason could be the difference of 0.05 dex in the adopted solar abundances. Jonsell et al. have adopted log (Fe) = 7.50 for the Sun. On the other hand the large difference in Ba ratio is not understood. However, Jonsell et al. ratio is smaller by same magnitude compared to other three recent studies (see their Table 6 and references therein).
Zhang Zhao analysed 31 metal-poor stars obtaining effective temperatures from colours (B-V, V-K, ), surface gravities from stellar isochrones and Hipparcos parallaxes. Stellar LTE abundances were referenced to Grevesse Sauval’s (1998) solar abundances in order to obtain the differential abundances [X/H] except that for iron solar abundance of 7.51 was adopted. For the 11 stars in common with our sample, Table 5 gives the comparisons. In the case of [Na/Fe], we give the result using Zhang Zhao’s LTE Na abundance. Our results agree well with the results from Zhang Zhao except for two elements Mn and Ni. Exact cause for such discrepancy is not known but it may be attributed to different line sets used, and the adopted sources of structure and atomic data.
Jonsell et al. (their Table 6) provide a comparison of abundances obtained for common stars from multiple published works showing that for many elements differences between LTE analyses are 0.10 dex or better. Our comparisons in Table 5 echo this level of consistency in most cases.
| Ours - Gratton | Ours-Jonsell | Ours-Zhang | ||||
|---|---|---|---|---|---|---|
| Quantity | diff. | diff. | diff. | |||
| Teff | -26 | 99 | 39 | 33 | 12 | 79 |
| log | -0.03 | 0.15 | 0.03 | 0.20 | 0.25 | 0.25 |
| 0.07 | 0.10 | 0.14 | 0.07 | 0.04 | 0.22 | |
| -0.01 | 0.12 | 0.08 | 0.12 | 0.12 | 0.22 | |
| -0.14 | 0.10 | -0.08 | 0.07 | -0.04 | 0.29 | |
| …. | …. | -0.13 | 0.0 | …. | …. | |
| -0.05 | 0.17 | -0.06 | 0.03 | 0.10 | 0.20 | |
| -0.05 | 0.04 | 0.01 | 0.08 | 0.03 | 0.13 | |
| 0.09 | 0.15 | -0.02 | 0.05 | 0.05 | 0.23 | |
| -0.01 | 0.11 | …. | … | -0.04 | 0.08 | |
| 0.09 | 0.15 | … | … | -0.21 | 0.19 | |
| …. | …. | … | … | -0.11 | 0.07 | |
| -0.10 | 0.15 | … | … | -0.29 | 0.15 | |
| -0.05 | 0.11 | 0.07 | 0.07 | -0.22 | 0.18 | |
| …. | …. | 0.26 | 0.03 | 0.01 | 0.20 | |
| Thick disc | metal-weak thick disk | Halo | |
|---|---|---|---|
| 0.110.06 | 0.010.10 | 0.010.15 | |
| 0.310.06 | 0.320.07 | 0.310.09 | |
| 0.270.08 | 0.300.11 | 0.210.10 | |
| 0.230.06 | 0.270.09 | 0.230.15 | |
| 0.180.06 | 0.270.06 | 0.250.07 | |
| 0.200.06 | 0.250.08 | 0.230.08 | |
| 0.110.08 | 0.070.10 | 0.120.16 | |
| 0.030.05 | 0.210.12 | 0.130.08 | |
| 0.020.04 | 0.080.09 | 0.080.11 | |
| 0.380.13 | 0.440.24 | 0.350.15 |


5 Discussion
Dissection of the Galactic stellar population into principal components relies on combinations of differences in age, kinematics, composition and location. Differentiation of the standard thick disc from the thin disc is remarkably clear using all these properties: the thick disc is older than the thin disc, the thick disc lags the thin disc by about 50 km s-1, and is not only slightly metal-poor relative to the thin disc (say, mean [Fe/H] to ) but there are striking differences in relative abundances ([X/Fe]), and the scale height of the thick disc is larger than that of the thin disc. A similar description of contrasts may be given to differentiate the halo from the thin disc. Isolation of the metal-weak thick disk and a determination of its status either as the metal-poor extension of the thick disc, a collection of halo stars, or as a discrete Galactic component (or mixture of components) must use the same quartet of characteristics.
Unlike differentiation of the thick from the thin disc where differences in the UVW velocities and their dispersions allow a statistical separation of thin and thick disc stars, the kinematical differences between the metal-weak thick disk and thick disc on the one hand and the metal-weak thick disk and halo on the other hand are not transparently clear at present. If one assumes that there are no kinematical differences between thick disc and a metal-weak thick disk, Figure 2c shows that metal-weak thick disk stars are rare in the solar neighbourhood relative to thick disc stars, if selection effects are set aside. Alternatively, if either the of the metal-weak thick disk is similar to that of Schuster et al.’s second group of thick disc stars or the of the metal-weak thick disk decreases with [Fe/H], metal-weak thick disk stars share kinematics with halo stars increasing the difficulty in isolating the metal-weak thick disk star from a halo star. Our criteria for , Vrot, and are an attempt to enhance selection of metal-weak thick disk candidates over halo stars from combined catalogue.
Age differences between halo and metal-weak thick disk stars will be difficult to establish. It is known that thick disc stars are older systematically than thin disc stars with thick disc and halo star ages approaching the WMAP age of the Universe (Schuster et al. 2006); the age difference between the two populations does not exceed the uncertainty of the age determinations. Our age estimates (Tables 1, 2) for metal-weak thick disk candidates also in the mean approximate the WMAP age and, thus, halo, thick and metal-weak thick disk candidate stars cannot be set apart by age using estimates of the present precision.
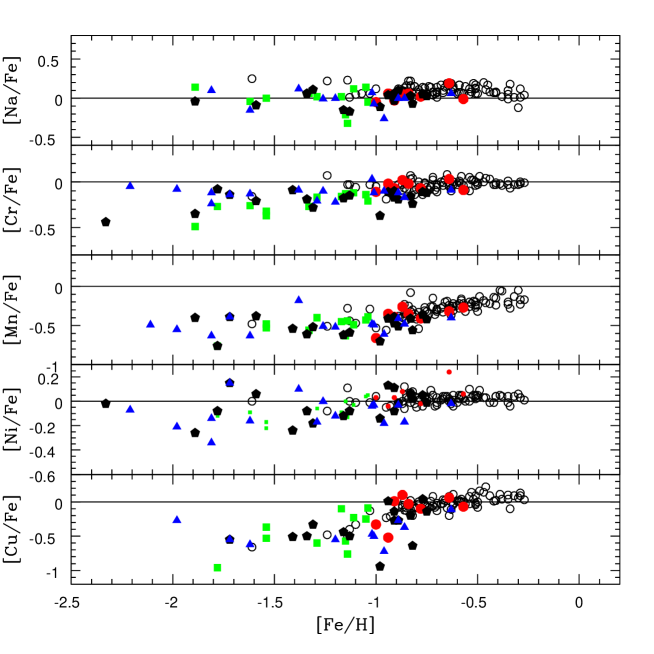
Perhaps, a chance of establishing that metal-weak thick disk stars are a distinct population may rest with the relative abundances [X/Fe]. However, comparison of the abundances for our halo and metal-weak thick disk candidates shows no clear differences in [X/Fe]. This is summarized by Table 6 giving the mean and standard deviations for [X/Fe] for both samples. There is not a single significant difference. (Note that several potentially interesting elements were not measured in our study: C, N, and O, in particular.) Both samples span similar ranges in [Fe/H] and atmospheric parameters so that non-LTE effects are very unlikely to have exerted a differential effect on the halo-metal-weak thick disk comparison. This close similarity in composition allows of two possibilities, either the metal-weak thick disk stars are halo stars under a redundant label or the metal-weak thick disk and halo stars are distinct populations with indistinguishable compositions at a given [Fe/H]. This is quite a contrast from the recent study, yet to be published, by Nissen Schuster (2008). They have showed a clear [X/Fe] abundance difference among stars with space velocities very similar to halo and thick disk: one group of stars shows high [/Fe] and the other shows significantly lower [/Fe] values. They claim that this may be due to two different population of stars within halo originating from different sources.
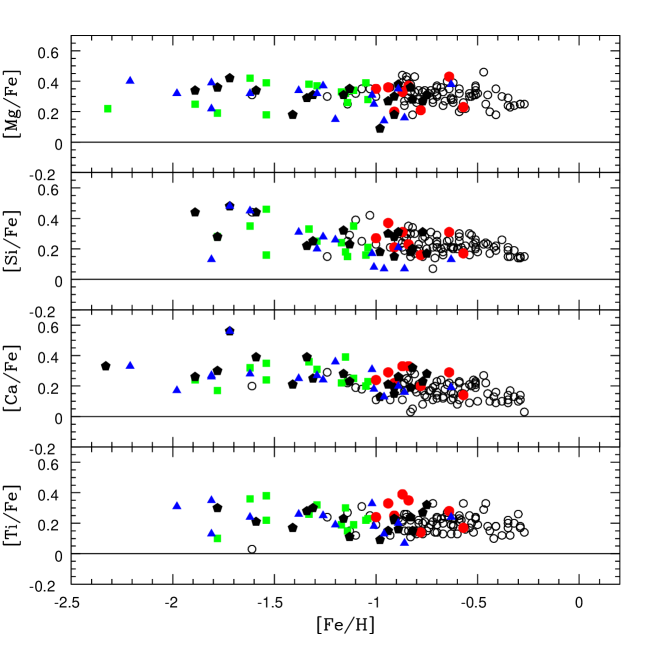
If the metal-weak thick disk is the metal-poor tail of the thick disc, a necessary condition would seem to be that the compositions provide a continuous trend in [X/Fe] versus [Fe/H]. This is the case, as shown for several elements in Figures 8 and 9. For the metal-weak thick disk candidates and thick disc stars, abundances merge smoothly across [Fe/H] to within about 0.1 dex. The mean [X/Fe] for the 66 thick disc stars with [Fe/H] from Reddy et al.(2006) show good agreement with the candidate metal-weak thick disk stars from Table 1. Unfortunately, this result is insufficient to establish the metal-weak thick disk as the tail of the thick disc population because, as just noted, the metal-weak thick disk and halo share the same [X/Fe] results.
Gratton et al (2003b) proposed a differentiation by kinematics of those stars that do not belong to the thin disc. Galactic components - dissipative and accretion - were introduced with the definitions:
dissipative: km s-1 and kpc where is the maximum distance of star from the Galactic centre in its computed orbit.
accretion: km s-1
The definitions dissipative and accretion were intended to describe the mode of formation of the component. Gratton et al. suggested that there was a systematic difference in the run of [/Fe] versus [Fe/H] between the components - Figure 10 reconstructs their illustration from their data where we give two choices for the index. The selection of 40 km s-1 as the boundary between the dissipative and accretion components was apparently an arbitrary one. The dissipative component seems to show a rather tight run of [/Fe] with [Fe/H] for [Fe/H] , and the accretion component to show a greater dispersion with the upper boundary coinciding with the dissipative results. For [Fe/H , an accretion-dissipative difference was shown first by Nissen & Schuster (1997). The difference was effectively noted by Fulbright (2000) who claimed a correlation between the Galactic rest frame velocity () and [X/Fe] for many elements X including the elements. The mean [/Fe] value dropped by about 0.1 dex for stars with km s-1 relative to mean values for stars of lower .
Since the thick disc stars define the high [Fe/H] end of the dissipative results, this difference offers a tool with which to investigate the population to which the metal-weak thick disk candidates belong. However, Figure 11 shows that stars in our samples show the same run of [/Fe] versus [Fe/H] for dissipative and accretion components. Zhang & Zhao’s (2005) sample (Figure 12) suggests the reverse conclusion about the two components: the accretion component may have higher [/Fe] than the dissipative component. Jonsell et al.’s sample (Figure 12) for [Fe/H] shows no difference between the two components. In short, the distinction between accretion and dissipative components is not crisply defined as suggested by Gratton et al. The lack of a clear difference among these components precludes assignment of metal-weak thick disk stars to a particular component.
| Sample | ||||
|---|---|---|---|---|
| Metal-weak thick disk | 14 | 6.380.44 | 0.490.10 | 0.590.40 |
| Thick disc (this study) | 8 | 6.450.40 | 0.450.07 | 0.810.48 |
| Thick disc∗ | 66 | 6.440.70 | 0.470.10 | 0.650.27 |
| Hybrid | 20 | 6.261.50 | 0.650.11 | 0.550.53 |
| Halo | 18 | 6.592.60 | 0.870.16 | 0.650.35 |
An alternative to the dissipative/accretion components is provided by characterization of the computed orbits of the stars. Key parameters are the mean of the apogalactic and perigalactic distances (), the eccentricity (e) and the maximum height from the Galactic plane (). These values are given in Tables 1 and 2. Table 7 gives the mean values of , e, and for the stars in Tables 1 and 2 and for 66 thick disc stars in Reddy et al. (2006).
There appears to be an interesting message to be drawn from Table 7. The candidate metal-weak thick disk stars share the mean orbital parameters with the eight thick disc stars and, more significantly with the large sample of thick disc stars from Reddy et al. (2006). Noticeable is the agreement between the mean eccentricity and its dispersion among these three groups. The mean eccentricity for the hybrid stars (Table 1) is intermediate between that of the thick disc (Table 1) and the halo stars in Table 2. Even the hybrid stars with [Fe/H] have in the main eccentricities greater than values typical of thick disc stars. Thus, the hybrid stars are predominantly representatives of the halo.
Examination of the orbital parameters (Table 7) suggests that the velocity criteria that led to the collection of metal-weak thick disk candidate stars in Table 1 may isolate a sample to which the metal-weak thick disk is a major contributor. The [Fe/H] for this sample runs from 1.05 to 2.32; stars with [Fe/H] 1.0 were assigned as thick disc stars. Eight of the 14 metal-weak thick disk stars have [Fe/H] 1.3 and might most plausibly be seen as a mild extension of the [Fe/H] distribution of the thick disc. The other six stars have [Fe/H] from to with no significant difference in the kinematical and orbital parameters from the eight with [Fe/H] 1.3. This eight are possible representatives of the metal-weak thick disk population.
Metal-weak thick disk candidates according to our velocity criteria are present in other studies, as indeed would be expected. Among Gratton et al.’s (2003a,b) collection of 150 stars, we find using their LSR-velocities 14 metal-weak thick disk candidates of which four are in our sample. Seven of the 14 have [Fe/H] and may be thick disc stars in the low [Fe/H] tail. The other seven have [Fe/H] values from to for a mean value of . Jonsell et al.’s (2005) sample of 43 stars includes eight metal-weak thick disk candidates with five having [Fe/H] . The other three with [Fe/H] from to are metal-weak thick disk candidates. Zhang & Zhao’s (2005) sample provides two metal-weak thick disk candidates but both are in Table 1.
6 Concluding remarks
Our collection of 14 stars in Table 1 are offered as metal-weak thick disk candidates but by no means as certain members of the elusive metal-weak thick disk population. We have been unable to identify a conclusive signature distinguishing a metal-weak thick disc star from a halo star. In terms of age, present knowledge and precision of age determinations do not provide a discriminant between thick disc and halo. At a given [Fe/H], the relative abundances [X/Fe] of metal-poor stars appear to show a dispersion no larger than the measurement uncertainties. Relative to the uncertainties, the halo stars and our metal-weak thick disk candidates of similar [Fe/H] are not distinguishable. Our sole proposed discriminant involves a combination of the LSR-velocities.
This discriminant is imperfect because kinematics of the thick disc and halo involve overlapping distribution functions. The overlap is essentially complete for the and components: the thick disc velocity distributions are wholly contained within the broader halo distributions. The overlap for the distributions is dependent on the Fe-dependence of the (unknown) velocity distribution of the halo stars (see the difference between Figures 2a and 2b) and on the extrapolation of the thick disc velocity distribution into the regime of [Fe/H] , as discussed above. The of the metal-weak thick disk candidates is comparable to that of Schuster et al’s second group of thick disc stars. While our velocity criteria are intended to favour selection of thick disc stars, contamination of the metal-weak thick disk candidates by halo stars remains a possibility. The eccentricity is no more than an intriguing discriminator. Selection of metal-weak thick disk candidate stars by their ensures that they have a lower eccentricity than the stars of much lower in Table 2.
Selection effects influencing the two catalogues certainly play a role. This is strongly suggested, as noted above, by the rather different distributions of metal-poor ([M/H] ) stars in the Arifyanto et al. catalogue (Figure 2a) and the Schuster et al. catalogue (Figure 2b). In Figure 2a, the stars are rather symmetrically distributed about = 0, the boundary between stars on prograde and retrograde orbits. In contrast, Figure 2b shows a preponderance of retrograde orbits and a mean decreasing with decreasing [M/H]. Setting aside the influence of selection effects, very different models of the halo distribution versus [M/H] result from the two catalogues. In turn, these different models would result in different conclusions about the extension of the thick disc to [M/H] that result from subtraction of the halo distribution from the observed distribution. Most probably, neither represents the true halo distribution.
The small sample of metal-weak thick disk candidates have the composition established for the thick disc and the halo at their interface. Obviously, the case for a metal-weak thick disk population needs refinement beginning with the isolation of a larger sample with reliable metallicities assuring that stars are indeed metal-weak and reliable kinematics from accurate distances, radial velocities, and proper motions to establish that the stars have disc-like motions. The tools with which to meet these goals are on the horizon.
Inevitably, the tools will enable stars of the halo, the thick disc and its metal-weak tail to be examined at up to several kpc from the Sun. Examination of the populations characteristics as a function height from the Galactic plane and distance from the Galactic centre will provide much needed information for digestion by theorists seeking to unravel the history of the Galaxy. Results are now beginning to appear from analyses of the SDSS database - see, for example, Allende Prieto et al. (2006) and Ivezić et al. (2007) who use the SDSS data to analyse spectra of large numbers of F and G dwarfs at kpc distances from the Sun. It will now be interesting to obtain detailed abundances (i.e., [X/Fe]) for samples of these faint stars.
Two considerations strongly imply that stars different in [X/Fe] at a given [Fe/H] should be uncovered by examining such samples. First, stars in dwarf spheroidal galaxies (dSphs) and the Magellanic Clouds have lower [/Fe] at a given [Fe/H] than the Galactic halo and thick disc stars; a compilation by Koch et al. (2008) shows that across the range of [Fe/H] from about to the [/Fe] of the dSphs is 0.2 to 0.3 dex smaller than for the Galactic halo and thick disc stars (see their Figure 3). Second, the Galaxy is known to be accreting dSphs. Therefore, accretion of stellar systems akin to the present day dSphs is expected to add stars of lower than typical [/Fe] to the halo populations. Conversely, the seeming rarity of such stars in the general local stellar population implies that systems like the dSphs did not play a major role in the merger history of the halo and thick disc.
This research has been supported in part by the Robert A. Welch Foundation of Houston, Texas. We thank anonymous referee for the detailed review which helped to improve the paper.
References
- [1] Allende Prieto, C., Beers, T.C., Wilhelm, R., Newberg, H.Jo., Rockosi, C.M., Yanny, B., Lee, Y.S, 2006, ApJ, 636, 804
- [2] Alonso, A., Arribas, S., Martinez-Roger, C. 1996, A&A, 313, 873
- [3] Arifyanto, M. I., Fuchs, B., Jahrei , H., Wielen, R. 2005, A&A, 433, 911
- [4] Beers, T. C., Drilling, J. S., Rossi, S., Chiba, M., Rhee, J., Fuhrmeister, B., Norris, J. E., von Hippel, T. 2002, AJ, 124, 931
- [5] Bensby, T., Feltzing, S., Lundström, I., Ilyin, I. 2005, A&A, 433, 185
- [6] Bensby, T., Zenn, A. R., Oey, M. S., Feltzing, S. 2007, ApJL, 663, 13
- [7] Carney, B.W., Laird, J.B., Latham, D.W., Aguilar, L.A. 1996, AJ, 112, 668
- [8] Carney, B, W., Latham, D, W., Laird, J. B., Aguilar, L. A. 1994, AJ, 107, 2240
- [9] Carney, B, W., Latham, D, W. 1987, AJ, 93, 116
- [10] Carollo, D. et al. 2007, Nature, 450, 1020
- [11] Castelli, F., Gratton, R.G., Kurucz, R.L. 1997, A&A, 318, 841
- [12] Cutri, R. M., et al. 2003, VizieR Online Data Catalog, 2246. Originally published in: University of Massachusetts and Infrared Processing and Analysis Center, IPAC/California Institute of Technology
- [13] Dehnen, W., Binney, J.J. 1998, MNRAS, 298, 387
- [14] Demarque, P., Woo, J.-H., Kim, Y.-C., & Yi, S.K. 2004, ApJS, 155, 667
- [15] Fulbright, J.P. 2000, AJ, 123, 404
- [16] Fulbright, J.P. 2002, AJ, 123, 404
- [17] Fuhrmann, K. 1998, A&A, 338, 161
- [18] Gratton, R. G., Carretta, E., Claudi, R., Lucatello, S., Barbieri, M. 2003a, A&A, 404, 187
- [19] Gratton, R. G., Carretta, E., Desidera, S., Lucatello, S., Mazzei, P., Barbieri, M. 2003b, A&A, 406, 131
- [20] Gilmore, G., Reid, N. 1983, MNRAS, 202, 1025
- [21] Grevesse, N., & Sauval, A.J. 1998, Space Sci. Rv., 85, 161
- [22] Ivezić, Z. et al. 2006, MmSAI, 77, 1057
- [23] Jonsell, K., Edvardsson, B., Gustafsson, B., Magain, P., Nissen, P.E., & Asplund, M. 2005, A&A, 440, 321
- [24] Koch, A., Grebel, E. K.i, Gilmore, G. F., Wyse, R. F. G., Kleyna, J. T., Harbeck, D. R., Wilkinson, M. I., Wyn E. N. 2008, AJ, 135, 1580
- [25] Kurucz, R.L. 1998, http://cfaku5.harvard.edu
- [26] Mishenina, T. V., Kovtyukh, V. V., Soubiran, C., Travaglio, C., & Busso, M. 2002, A&A, 396, 189
- [27] Mishenina, T. V., Soubiran, C., Kovtyukh, V. V., Korotin, S.A., 2004, A&A, 418, 551
- [28] Morrison, H.L., Flynn, C., & Freeman, K.C. 1990, AJ, 100, 1191 Kerber, F., Kaufl, H. U., Pettini, M. 2007, astro-ph/072689
- [29] Nissen, P.E., & Schuster, W.J. 1997, A&A, 326, 751
- [30] Nissen, P.E., & Schuster, W.J. 2008, in ”The Galaxy Disk in Cosmological Context” Eds; J. Andersen, J. Bland-Hawthorn & B. Nordstrom, IAU Symp. No. 254
- [31] Perryman et al. 1997, A&A, 323, 49
- [32] Prochaska, J. X., Naumov, S. O., Carney, B. W., McWilliam, A., Wolfe, A. M. 2000, 120, 2513
- [33] Reddy, B.E., Tomkin, J., Lambert, D.L., Allende Prieto, C. 2003, MNRAS, 340, 304
- [34] Reddy, B.E., Lambert, D.L., & Allende Prieto, C. 2006, MNRAS, 367, 1239
- [35] Ryan, S.G., & Lambert, D.L. 1995, AJ, 109, 2068
- [36] Sandage, A., Fouts, G. 1987, AJ, 93, 592
- [37] Schuster, W. J., Moitinho, A., M\a’rquez, A., Parrao, L., Covarrubias, E. 2006, A&A, 445, 939
- [38] Sneden, C. 1973, PhD. Thesis, Uiniv. of Texas, Austin
- [39] Twarog, B. A., & Anthony-Twarog, B. J. 1994, AJ, 107, 1371
- [40] Twarog, B. A., & Anthony-Twarog, B. J. 1996, AJ, 111, 220
- [41] Tull, R. G., MacQueen, P. J., Sneden, C., Lambert, D. L.1995, PASP, 107, 251
- [42] van Leeuwen, F. 2007, Hipparcos, the new reduction of the raw data, Cambridge University, Cambridge, UK Series: Astrophysics and Space Science Library, Vol. 350 20, Springer Dordrecht
- [43] Wielen, R.., Lenhardt, H., Schwan, H., Dettbarn, C. 2001, A&A, 368, 298
- [44] Zhang, H. W., Zhao, G. 2005, MNRAS, 364, 712