Vector magnetic fields of Solar Granulation
Abstract
Observations of quiet Sun from the Solar Optical Telescope/Spectro-Polarimeter (SOT/SP) aboard the Hinode spacecraft would reveal the magnetic characters of the solar photosphere. By making use of the deep mode observations of three quiet regions, we have statistically studied the vector magnetic fields of solar granulation. More than 2000 normal granules are manually selected to form a sample. It is recognized that some granules are even darker than the mean photosphere in intensity, and there is a linear correlation between intensity and Doppler velocity in granules.
The distributions of longitudinal and transverse apparent magnetic flux densities, Doppler velocity and continuum intensity of granules are obtained, and their unsigned magnetic flux measured. Two approaches are carried out in this study. First we obtained the magnetic properties of granulation by averaging the measurements for all the sampling granules. Secondly, we reconstructed an average granular cell based on a sub-sample, and obtained the detailed distribution of apparent magnetic flux density within the model granular cell. All the results have been compared with that of inter-granular lanes and a few typical abnormal granules.
Our statistic analysis reveals the following results: (1) The unsigned magnetic flux of individual granule spans the range from Mx to Mx with a peak distribution at Mx; (2) The unsigned longitudinal apparent flux density of granules ranges from almost zero to 212 Mx with a mean longitudinal apparent flux density of 12 Mx , while the transverse apparent flux density of granules ranges from 4 to 218 Mx with a mean transverse apparent flux density of 79 Mx . The longitudinal and transverse apparent magnetic flux densities of granules are positively correlated, and the longitudinal apparent flux density of granules is weaker than the corresponding transverse apparent flux density; (3) The magnetic inclination of granules with respect to the surface that’s perpendicular to the line-of-sight falls in the range of 4.8 to 76.7 degrees with a peak distribution at 25 degrees. On average, the magnetic vectors in granules are more vertical than that in the inter-granular lanes; (4) There is a strong preference that both the vertical and horizontal fields on the quiet Sun reside in the inter-granular lanes; (5) The detailed distributions of apparent flux density, Doppler velocity, and continuum intensity within an average granular cell are presented. These distributions can well be empirically formulated.
1 Introduction
Under good conditions of atmospheric seeing, the observations of the solar surface with a telescope of at least 30 cm aperture can reveal the cellular pattern that covers the entire solar surface, except the sunspots region; this pattern is called granulation.
As the smallest convective elements, many properties of granules have been carefully studied. The observed size of granules excluding the surrounding dark lanes ranges from approximately 0′′.2 (the limit of ground-based observations) to approximately 3′′.4 (Peter N Brandt 2000), and the mean granular size amounts to 1′′.1 (Namba & Diemel 1969), or 1′′.35 (Bray et al. 1984). The mean cell size of the granular elements including one-half of the surrounding dark lanes is 1′′.94 according to Bray & Loughhead (1977), and 1′′.76 according to Roudier & Muller (1986). The granulation is a non-stationary phenomenon. Frequently the granules expand and split into smaller components that drift apart, and the fragments may turn grow and fragment, or merge with others, or shrink and decompose. The time for the granular photospheric intensity decay to of an initial value is about 6 minutes according to a number of studies (e.g., Bahng Schwarzschild 1961; Title et al. 1986). Individual granules may live longer than this, e.g., over 8 minutes as identified by Mehltretter (1978), and a mean lifetime of 12 minutes found by Dialetis et al. (1986). An important feature of granular evolution is the proper motion of granules. From the high-resolution slit spectrograms taken at disk center, one can measure the vertical velocity related to granular motion, and the peak value identified is in the range 1.5-2.0 km/s, after removing the velocity components due to oscillations. Furthermore, the horizontal velocity components are larger than the vertical components by a factor of 2 (Mattig et al. 1981).
The granular motions also seem to have significant influence on the magnetic emergence. The horizontal inter-network fields reported by Lites et al. (1996), with typical sizes of 1′′ and lifetime of 5 minutes, suggest that small magnetic loops are being advected toward the surface by the upward motion of the plasma inside the granules. If the horizontal inter-network fields are indeed emerging flux, Lites et al. (1996) estimated that the rate of magnetic flux driven to the surface by the upward motion of the plasma inside the granules is greater than the rate of flux emergence in bipolar sunspot regions averaged over the whole solar cycle. The horizontal motions inside the granules carry the vertical magnetic flux toward the inter-granular lanes (Harvey et al. 2007; Centeno et al. 2007).
Furthermore, the magnetic emergence also has important influence on the shape of the underlying granulation pattern. The magnetic emergence of flux tubes with a flux of more than Mx of longitudinal flux disturbs the granulation and leads to the transient appearance of a dark lane (Cheung et al. 2007), that is so-called ‘abnormal granulation’. The abnormal granulation is also a term sometimes used for granulation in plage regions. While small-scale flux tubes with less than Mx are not sufficiently buoyant to rise coherently against the granulation and produce no visible disturbance in the granules (Cheung et al. 2007). Therefore, one of the crucial points to understand the structure of the granulation is how the convective elements are modified by the presence of surface magnetic fields.
In the photospheric layer, the plasma is close to 1, thusly, the magnetic fields and the convection of plasma in the photosphere are vigorously interacting all the time. To quantify the magnetic properties of solar granulation will provide clues in understanding the interaction, and test the theories and numerical simulations of this magnetic convection.
Unfortunately, limited by the spatial resolution and sensitivity of polarization measurements, for this very fundamental convection cells, their magnetic properties, i.e., the magnitude and distribution of magnetic fields in granules are poorly known. With infrared polarimetry Lin & Rimmele (1999) identified magnetic elements with flux less than Mx and field strength of 200 - 1,000 G, which they called granular magnetic fields. The spatial distribution and time evolution of these magnetic features are closely associated with the solar granulation. These magnetic elements seem to occupy 68% of the quiet Sun area. From wavelength-integrated measures of Hinode Spectro-Polarimeter (SP), Lites et al. (2008) uncovered the horizontal magnetic flux on the quiet Sun. They obtained average horizontal and vertical flux density in quiet inter-network regions, which were 55 Mx cm-2 and 11 Mx cm-2, respectively. These authors found evidence that magnetic fields are organized on mesogranular scales, with both horizontal and vertical fields showing voids of reduced flux density of a few granules spatial extent. Moreover, the vertical fields are concentrated in the inter-granular lanes, whereas the stronger horizontal fields occur most commonly at the edges of the bright granules.
The unprecedented spatial resolution and sensitivity of the Stokes Spectro-Polarimeter onboard of Hinode seem to provide a new opportunity to advance our knowledge on the interaction between the magnetic field and granulation. A very key question is whether or not the magnetic field in inter-network regions can be modified and organized by granulation, the smallest convection elements on the quiet Sun. Getting the average properties of magnetic characters in granules and their overall correlation with convection flow and intensity become the first step of the relevant studies and serves as the aim of this current work. With this goal we analyze the the Hinode Spectro-Polarimeter data inverted by the full Stokes profiles based on the assumption of Milne-Eddington atmosphere model, and make two simple approaches: to get longitudinal and transverse magnetic flux densities, convection flows, and intensity of all the 2,100 sampling granules and to obtain the detailed distributions of magnetic flux densities within a model granular cell.
In Section 2, we describe the observations used for this study and the strategy of Stokes profile inversion. In Section 3, we obtain the statistical properties of granular vector magnetic fields and other relevant parameters. In Section 4, we put forward a model of average solar granular cell, and get detailed distributions of magnetic flux densities, convection flow and continuum intensity in the model granular cell. In Section 4, we discuss the uncertainties resulted from the effect of projection. The last section is devoted to conclusion.
2 Observations and inversion strategy
The SP observations in the SOT instruments aboard Hinode spacecraft provide the full Stokes spectral signals of two magnetically sensitive FeI lines at 630.15 nm () and 630.25 nm (). The SP performs four suitable observations for scientific objectives: fast map, dynamics, normal map and deep magnetogram. The data adopted here are the mode of deep magnetogram because of its higher polarimetric signal-to-noise ratio better than .
Three quiet solar regions with the field-of-view of 55′′.50 162′′.30 were observed on 2007 June 1 (12:35 UT), June 2 ( 13:12 UT), and June 4 (01:20 UT), respectively. They are located in the positions (-31′′, -200′′), (0′′, -200′′), and (0′′, 200′′). The data in every region consist of 376 consecutive positions of spectrograph slit. For the observation of each spectrograph slit, the exposure time is 9.6 seconds, yielding a noise level in the polarization continuum of about . The scanning steps of the spectrograph slit are 0′′.1476, and the spectral sampling is 2.15 pm.
Vector magnetic fields are derived from the inversion of the full Stokes profiles based on the assumption of Milne-Eddington atmosphere model (Yokoyama 2008, in preparation). Inversion techniques (e.g., Lites & Skumanich 1990; Socas-Navarro 2001) are robust when applied to the stronger Stokes polarization signals from active regions, but these profiles-fitting procedures using many free parameters typically encounter difficulties in convergence toward and uniqueness of the solutions when confronted with noisy profiles (Lites et al. 2008). However, Orozco Suarez et al. (2007a) suggest that ME inversion turns out to be largely independent of the noise and the field strength initialization, provided they are running on these pixels showing polarization signals above a reasonable threshold. Accordingly, here we only analyze these pixels with total polarization degree above 3 times of the noise level in the polarization continuum in order to exclude some profiles which cannot be inverted reliably, and then apply a ‘median’ function to the inverted magnetogram for removing the noisy peak.
The inversion returns the values of 13 free parameters, including the three components of magnetic fields (the field strength , the inclination angle with respect to the line-of-sight (LOS) direction, the azimuth angle ), the stray light fraction , the Doppler velocity , and so on. Martínez González et al. (2006) demonstrate the pair of FeI lines in low flux quiet Sun regions are not capable of distinguishing between the intrinsic magnetic field and the filling factor. Therefore, the flux density is a more appropriate quantity to describe. Here, we show the equivalent, spatially resolved vector magnetic fields by ‘apparent flux density’ (Lites et al. 1999) of the longitudinal and the transverse components, that is and . The longitudinal component may be thought of as the magnitude of the LOS component of a spatially resolved magnetic field that produces the observed circular polarization signal, while the transverse component is vertical to the LOS that would produce the observed linear polarization signal. The noise level is 2 Mx for the longitudinal field, and 44 Mx for the transverse field.
Each spectrum requires 9.6 seconds, so a single 2′′ granule may be mapped in about 2 minutes, a shorter interval compared with the evolution of granules (Bahng Schwarzschild 1961; Mehltretter 1978; Title et al. 1986; Dialetis et al. 1986). Thusly, we assume that we may use such a map to characterize the granules as if it were a snapshot.
From the three quiet regions observed on 2007 June 1, 2, and 4, totally 2,100 granules are selected manually according to the image of continuum intensity, and there are distinct inter-granular lanes surrounding each selected granule. Here, we define the granular pattern including the surrounding inter-granular lanes as granular cell, while the granular pattern excluding the surrounding inter-granular lanes as granule. The granular apparent flux densities, i.e., the mean unsigned longitudinal and the mean transverse apparent flux densities inside granular pattern excluding the inter-granular lanes, are measured. Furthermore, the granular unsigned magnetic flux are also calculated according to the granular area and the corresponding unsigned longitudinal apparent flux density. In addition, the granular intensity, Doppler velocity and magnetic inclination, i.e., the mean intensity, the mean Doppler velocity and the mean inclination within the granular pattern excluding the inter-granular lanes, are also measured.
3 The statistics of granular magnetic properties
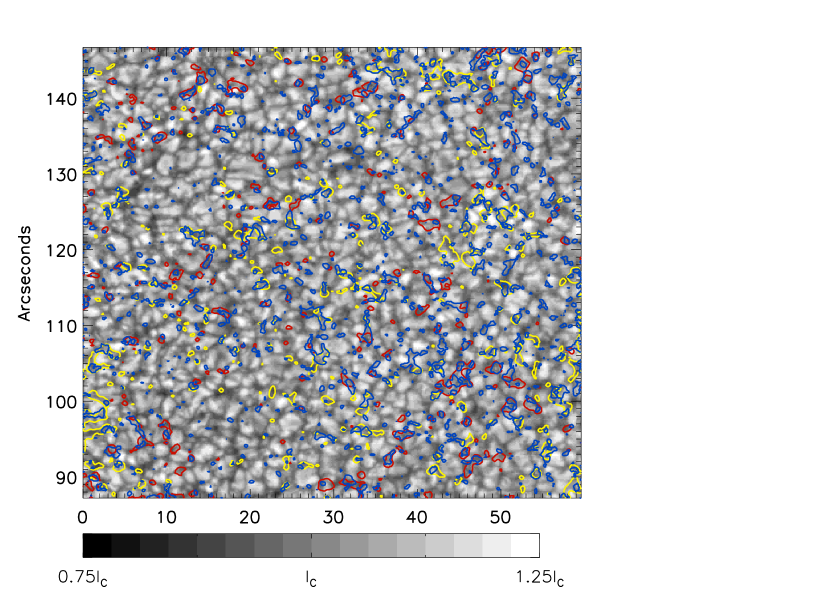
The Fig.1 shows the map of continuum intensity overlapped by the longitudinal apparent flux density and transverse apparent flux density for a small portion of the observed region on June 1, 2007. In these small quiet regions, about fourteen percents of the area represent the pixels which have not been inverted because of their small polarization signals.
The mean unsigned longitudinal apparent flux density in the field-of-view of the integrated regions observed on 2007 June 1, 2, and 4 is 28 Mx , with the corresponding mean transverse apparent flux density of 98 Mx . The mean magnetic inclination to the surface that is vertical to the LOS calculated over these inverted pixels is only 24.8 degrees. The larger occurrence of transverse fields confirms the discovery of strong linear polarization signals by Lites et al. (2007a, 2007b, 2008).
The current observations confirm the findings by Lites et al. (2008) that the magnetic fields on the quiet Sun are not uniformly distributed. Magnetic fields appear to be organized on meso-granulation scales. Moreover, there are ‘voids’ in either longitudinal or transverse fields where the flux density is much lower than other locations, even close to zero flux density. In this study we focus on the statistical properties of granular vector magnetic fields and their overall correlation with convection flow and intensity. Because the granular transverse and unsigned longitudinal apparent flux densities are computed over the whole granule, assigning zero fields to these pixels which are not inverted, they represent the lower limits. However, the granular magnetic inclinations are calculated over only these pixels which are inverted. Considering the spatial resolution 0′′.32 of the SOT/SP aboard the Hinode, and the 1 sensitivity of 2.0 Mx of longitudinal apparent flux density, the minimum observable magnetic flux should be Mx. Therefore, when the granular flux is less than Mx, we think that the granular flux can not be detectable.
The transverse apparent flux density, unsigned longitudinal apparent flux density, Doppler velocity, and continuum intensity of granules are measured. These physical parameters of 2,100 granules form a good sample. We refer these parameters as basic MHD (magneto-hydrodynamics) parameters of granules. The statistical MHD properties of the granules are listed in Table 1.
Here we define the granular relative intensity with respect to the mean intensity of the quiet photosphere. We find that some granules are darker than the mean photosphere in intensity. The relative intensity of granules spans the range from 0.97 to 1.14 with the peak distribution at 1.07, just as shown in Fig.2. Therefore, the granule is, of course, brighter than its surrounding dark lanes, but not necessarily brighter than the mean photosphere.
For studying the convection of granulation, the effects of solar oscillations have to be separated from the velocity variations of the granular pattern. In order to reduce the influence of the oscillations, the method of ‘boxcar’ smoothing function is adopted (Krieg et al. 2000; Lites et al. 2008), i.e. applying a smoothing function to the image, then subtracting that image from the to obtain a ‘flattened’ image of the local velocity variation which is mostly due to granulation. Here, we smooth the image in a width of 3′′.2, and remove the oscillation by subtracting that image from the to obtain the Doppler velocity related to the granular motion. The distribution of granular Doppler velocity is shown in Fig.2. The statistical analysis shows that the range of the granular motion is from -3.3 km (blueshift) to 2.0 km (redshift) with a peak at -1.0 km .
3.1 The distributions of magnetic flux and apparent flux densities
The magnetic flux distribution of the granules is presented in Fig.3. Their flux spans the range of Mx (the minimum observable limit) to Mx with a peak distribution at Mx, which is less than the peak distribution at Mx of inter-network magnetic elements by the ground-based observations at poor spatial resolution (Wang et al. 1995). This suggests that the magnetic fields of granulation are likely to belong to the inter-network magnetic fields. The mean granular flux is Mx (see Table 1). The peak distribution of granular area is 0.93 , taking the mean unsigned longitudinal apparent flux density of 28 Mx in the quiet region into account, and the magnetic flux within the scale of granular size is Mx which is within the range of magnetic flux of inter-network magnetic elements according to the mean flux obtained by Wang et al. (1995).
The apparent flux density distributions are shown in Fig.4. It is apparent from the figure that the unsigned longitudinal apparent flux density of granules is weak with a mean apparent flux density of 12 Mx , and the granular transverse apparent flux density spans the range from almost zero to 218 Mx with a mean apparent flux density of 79 Mx . Comparing with the average apparent flux densities, 28 and 98 Mx , of the whole three regions, the magnetic fields in granules are obviously weaker. This reflects a fact that the longitudinal and transverse fields within the granule are weaker than those in the inter-granular lanes. Another reason comes from the fact that our statistics have excluded the abnormal granules which certainly have much stronger apparent flux densities than the normal granules. Moreover, the range of inclination with respect to the surface that is perpendicular to LOS is from 4.8 degree to 76.7 degree with a peak distribution around 25 degree.
Considering the continuum intensity and inferred Doppler velocity, the inter-granular lanes are separated from the granules. The mean unsigned longitudinal and transverse apparent flux densities in the inter-granular lanes are 29 Mx and 117 Mx , respectively, and the corresponding inclination to the surface that is perpendicular to LOS only 20 degree. Therefore, in the quiet region, the magnetic vectors of granule are more longitudinal than those of inter-granular lanes. The strong preference for longitudinal field resides in the inter-granular lanes, which confirms the conclusion drawn by Domínguez et al. (2003). Furthermore, the transverse field also preferentially occurs in the inter-granular lanes.
3.2 Correlations among the granular apparent magnetic flux density, intensity and Doppler velocity
The correlation between the granular Doppler velocity and continuum intensity is studied. In order to show the relationship clearly, we divide the granules into 100 equally populated bins according to granular intensity, and compute the mean Doppler velocity and the mean intensity in each bin, respectively. We find that there is a negative correlation between Doppler velocity and the continuum intensity, and their correlation coefficient is -0.83, well above the confidence level of 99.9%. We fit their relationship by a linear function, exhibited in Fig.5.
| (1) |
where , . Therefore, we find that the larger the spectral blueshift is, the brighter the granule becomes.
In addition, by the same way, we also analyze the relationship between the granular unsigned longitudinal apparent flux density and the corresponding transverse apparent flux density . Our statistics show that there is a positive correlation between them. We fit their relationship by the polynomial function, just as displayed in Fig.6.
| (2) |
where .
However, the statistics excludes the abnormal granulation because the convective elements are modified by the stronger magnetic field. In order to compare the properties of the abnormal granules with that of the normal granules, we select arbitrarily three abnormal granules manually in plage region. It is found that that the mean unsigned longitudinal apparent flux density in the abnormal granules are larger than 300 Mx , while the transverse apparent flux density are around 100 Mx . Their magnetic fluxes exceed Mx, which supports the conclusion of Cheung et al. (2007). Their maximum intensities are higher than the average photospheric intensity by a factor of 1.1. Furthermore, due to the modification of the stronger magnetic fields, the Doppler velocity of abnormal granules is very small.
4 An average solar granular cell
The variations of the apparent magnetic flux density, the Doppler velocity, and the continuum intensity from the granular center to the inter-granular lane are useful constraints for modelling the solar granule. We construct a model of average solar granular cell.
What we firstly done is to define the granular size. Generally speaking, the granular size has two measures to define. One is the distance between the centers of two adjacent granules; this size is called the ‘cell size’ (Stix 2002). Another is the granular ‘diameter’, defined as follows (see Bray et al. 1984): Let A be the granular area over which a granular intensity is larger than a certain value; the area generally is not circular, so an effective diameter is . Using the 2100 granules manually selected, we find that the peak distribution of granular ‘diameter’ D is 1′′.50. In the image of continuum intensity in an enlarged scale, we plot a horizontal line (from east to west) and a vertical line (from south to north), and both of them span the granular center and the corresponding inter-granular lanes. We define the positions with the minimum intensity in inter-granular lanes as the outer edge of a granular cell, and the distance between the outer edges on both sides of the granular cell as the size of granular cell which is larger than by the definition. The is almost the same as the ‘cell size’, the distance between the centers of two adjacent granules.
Afterwards, we divide the into 26 equally populated bins along the two lines mentioned above, and compute the mean intensity in each bin. The measurements along the two orthogonal lines are averaged to get the intensity changes from the granular center to the corresponding inter-granular lanes. Making use of the same method, we analyze one hundred granules which are, more or less, regular with almost all of the Stokes profiles well-inverted. Moreover, in order to reduce the asymmetry from south-north cut, we select 50 granules in the quiet region (0 ′′, -200 ′′) and 50 granules in the quiet region (0 ′′, 200 ′′) to construct the average solar granular cell. Finally, we average the intensity of one hundred granules in each bin, and obtain the intensity variations with the distance from granular center to its corresponding inter-granular lanes for an average solar granular cell. In the image of continuum intensity, we can see that there is a distinct boundaries, i.e., great contrast of intensity, between granule and the corresponding inter-granular lanes. Therefore, from granular center to inter-granular lanes, we can also find two adjacent bins with largest contrast of intensity, and define the bin with less intensity as the inner edge of the average solar granular cell. We define the distance between the inner edges as the effective diameter of the average solar granule, and this distance is bounded by the two dashed lines in fig.7 . For the average solar granule, the diameter is equal to 1′′.50 according to the peak distribution of granular effective diameter, and the size of the granular cell is 2′′.16 based on the ratio between and of the average solar granular cell.
Finally, by the same ways we obtain the average Doppler velocity, unsigned longitudinal and transverse magnetic flux densities of one hundred granules in each bin; and the variations of apparent magnetic flux densities and Doppler velocity with the distance from granular center are obtained. The detailed distribution of apparent flux densities, convective flow and intensity for the average solar granular cell is schematically drawn in Fig.7. It is interesting to notice that the MHD parameter distributions of average granular cell are not exactly symmetric. Furthermore, we find that there is also asymmetry when we use only the results from the east-west cuts for the average solar granular cell.
For the average solar granular cell which we construct, the mean unsigned longitudinal and transverse apparent flux densities in inter-granular lanes are 22 Mx and 102 Mx , respectively; whereas that in granule, only 7 Mx and 61 Mx . The apparent flux density distributions of the average solar granular cell confirm the previous results that there is a preference for longitudinal and transverse fields to reside in the inter-granular lanes. The magnetic flux of the surrounding dark lanes of the average solar granular cell is Mx, while the magnetic flux of the average solar granule excluding the dark lanes is only Mx.
From Fig. 7, we see clearly that the plasma motion corresponding to the LOS in the granular center is fastest, and there is a negative correlation between continuum intensity and Doppler velocity. The maximum intensity contrast of the average solar granule is (where and are the maximum and minimum of the intensity). The effective diameter, , of average granule is larger than the width occupied by its inter-granular lanes by a factor of 2.27.
If we define the radius of granular cell as unit one, then the apparent flux densities can be expressed as the function of the distance from granular center, . The relationship between and distance can be fitted by a two-peak Gaussian function, displayed in Fig.8.
| (3) |
where , , , , , , . The effective half-width of is 0.765.
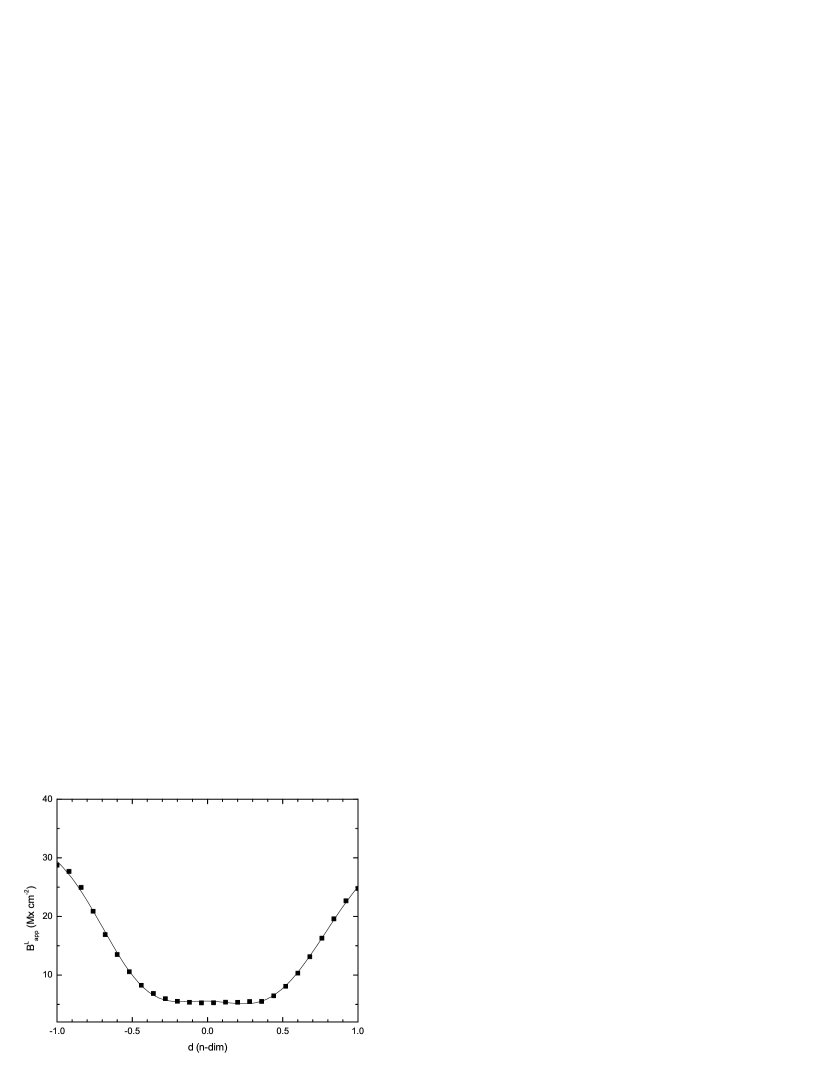
The relationship between and granular diameter d can be fitted by a single Gauss function, just as shown in Fig.9.
| (4) |
where , , , . The half-width of is 0.73.
In addition, the Doppler velocity and continuum intensity also can be expressed as the function of by the two-peak Gaussian fit.
| (5) |
where , , , , , , .
| (6) |
where , , , , , , .
5 Discussions
So far, we only use the terms of longitudinal and transverse apparent flux densities to describe the results of our statistics. Because the three quiet regions are not observed at disk center, there will appear some uncertainties resulted from the effect of projection in the estimation of vertical and horizontal fields. Accordingly, the longitudinal and transverse apparent flux densities do not strictly mean the vertical and horizontal apparent flux densities. Thusly, we make a simple estimation about the uncertainties. We find that the uncertainty is about 4 Mx for the vertical field, and 7 Mx for the horizontal field. The uncertainties are within 3 times of the standard deviations of magnetic flux density measurements. Therefore, it is quite acceptable to use the terms of vertical and horizontal fields to describe our statistical results on the vector magnetic fields of solar granulation. Compared with the values of magnetic parameters from 2100 granules and average solar granular cell, we find that the vertical fields are weaker than the corresponding horizontal field in the whole quiet region. The vertical fields are concentrated in the inter-granular lanes, which confirmed the conclusion about the distribution of vertical fields obtained by Lites et al. (2008). Moreover, we find that the horizontal fields also occur most commonly in the inter-granular lanes. This conclusion is different from the result about the horizontal fields distribution obtained by Lites et al. (2008). The reason for the difference may be the fact that the result showed by Lites et al. (2008) mostly emphasizes the fraction of the area of the bin occupied by the greater horizontal field for equally populated bins from the granular center to inter-granular lanes, while our result stresses the magnitude of horizontal field for each bin from the granular center to inter-granular lanes.
On the other hand, the effect of projection could also result in the uncertainties of less than 12 degrees in the estimation of magnetic inclination angle with respect to the horizontal solar surface. Compared with the magnetic inclination angles with respect to the image surface being perpendicular to the line-of-sight, 27.1 degree and 20 degree, for the granules and inter-granular lanes, the uncertainty of magnetic inclination angle makes us hardly affirm that the magnetic fields in the granules are more vertical than that in the inter-granular lanes. Therefore, we select a quiet region observed at disk center on 2007 December 21, and divided the region into granular region and inter-granular region according to the continuum intensity and the inferred Doppler velocity. The magnetic inclination angles are averaged over only the inverted pixels in the granular region and inter-granular region, respectively. We find that average magnetic inclination angle with respect to line-of-sight is 53.2 degrees in granules, and 59.2 degrees in the inter-granular lanes, i.e., 37.8 and 30.8 degrees with respect to the local solar surface. Therefore, we confirm that the magnetic fields in the granules are more vertical than that in the inter-granular lanes. However, Orozco Surez et al. (2007b) show that the fields are more horizontal in granular region than elsewhere seen from the probability density functions of magnetic inclination, which is opposite to our result. Indeed, more studies should be made to clarify the discrepancy.
6 Conclusions
Based on the observations of quiet Sun using SOT/SP aboard the Hinode spacecraft, we have statistically studied the distributions of granular magnetic flux, vector magnetic fields, the continuum intensity and the Doppler velocity. Moreover, a model of average solar granular cell is reconstructed.
The granular flux spans the range from Mx to Mx with a peak distribution at Mx. The granular vertical apparent flux density is weaker than the corresponding horizontal apparent flux density, and there is a positive correlation between them. The range of granular inclination to the surface that is vertical to the LOS is from 4.8 to 76.7 degrees with a peak distribution at 25 degrees, and the magnetic vectors in the granules is more vertical than that in the inter-granular lanes. There is a strong preference that the vertical and horizontal fields reside in the inter-granular lanes. There is a range for the Doppler velocity from -3.3 km (blueshift) to 2.0 km (redshift) after removing the velocity components due to the oscillation. Some granules are darker than the quiet photosphere in intensity, the relative intensity of granules has a range spanning from 0.97 to 1.14. There is a linear correlation between granular intensity and Doppler velocity.
A model of an average solar granular cell has been built by analyzing one hundred granules, and the variations of the vector magnetic fields, the Doppler velocity and the continuum intensity from the inter-granular lanes to the granular center are studied. For the average solar granular cell, it is also confirmed that the vertical and horizontal fields have a strong preference in the inter-granular lanes. The changes of apparent flux densities, convection flow, and relative intensity with the distance from granular center to the corresponding inter-granular lanes can be empirically formulated. Interestingly, the transverse apparent flux density distribution can well be formulated by a Gaussian function; however, the unsigned longitudinal field distributions can only be best fitted by double-peak Gaussian functions. These empirical formulation may serve as some quantitative constraints on the magneto-convection simulations.
References
- (1) Bahng, J., & Schwarzschild, M. 1961, ApJ, 134, 312
- (2) Bray, R. J., & Loughhead, R. E. 1977, Sol. Phys., 54, 319
- (3) Bray, R. J., Loughhead, R. E. & Durrant, C. J. 1984, The Solar Granulation, Cambridge University Press
- (4) Centeno, R., Socas-Navarro, H., Lites, B., et al. 2007, ApJ, 666L, 137
- (5) Cheung, M., Schssler, M., Moreno-Insertis, F., et al. 2007, A&A, 467, 703
- (6) de Boer, C. R., & Kneer, F. 1992, A&A, 264, 24
- (7) De Pontieu, B. 2002, ApJ, 569, 474
- (8) Dialetis, D., Macris, C., Prokakis, T., et al. 1986, A&A, 168, 330
- (9) Domínguez, Cerdea I., Kneer, F. & Snchez, Almeida J. 2003, ApJ, 582, L55
- (10) Harvey, J. W., Branston, D., Henney, C. J., et al. 2007, ApJ, 659L, 177
- (11) Krieg, J., Kneer, F., Koschinsky, M., et al. 2000, A&A, 360, 1157
- (12) Lin, H. S., & Rimmele, Thomas. 1999, ApJ, 514, 448
- (13) Lites, B. W., Kubo, M., Socas-Navarroet, H. et al. 2008, ApJ, 672, 1237
- (14) Lites, B. W., Leka, K. D., Skumanich, A., et al. 1996, ApJ, 460, 1019
- (15) Lites, B. W., Rutten, R. J., & bERGER, T. E. 1999, ApJ, 517, 1013
- (16) Lites, B. W., Socas Navarro, H., Berger, T., et al. 2007a, AAS, 210, 6303
- (17) Lites, B. W., Socas-Navarro, H., Kubo, M., et al. 2007b, PASJ, 59, 571
- (18) Lites, B. W., & Skumanich, A. 1990, ApJ, 348, 747
- (19) Martínez González, M. J., Collados, M. & Ruiz Cobo, B. 2006, A&A, 456, 1159
- (20) Mattig, W., Mehltretter, J. P., & Nesis, A. 1981, A&A, 96, 96
- (21) Mehltretter, J. P. 1978, A&A, 62, 311
- (22) Namba, O., & Diemel, W. E. 1969, Sol. Phys., 7, 167
- (23) Orozco Surez, D., Bellot Rubio, L. R., Del Toro Iniesta, J. C., et al. 2007a, PASJ, 59, 837
- (24) Orozco Surez, D., Bellot Rubio, L. R., Del Toro Iniesta, J. C., et al. 2007b, ApJ, 670, L61
- (25) Peter N Brandt 2000, Encyclopedia of Astronomy and Astrophysics: Granulation, p2659-2662
- (26) Roudier, Th., & Muller, R. 1986, Sol. Phys., 107, 11
- (27) Sobotka Michal, Bonet Jose, A., & Vazquez Manuel 1994, ApJ, 426, 404
- (28) Socas-Navarro, H. 2001, in ASP Conf. Ser. 236, 487
- (29) Stix, M. 2002, The Sun: An Introduction, Astronomy and Astrophysics Library.
- (30) Title, A. M., Tarbell, T. D., Simon, G. W., et al. 1986, Adv. Space Res. 6, 253
- (31) Wang, J. X, Wang, H. M., Tang, F., et al. 1995, Sol. Phys., 160, 277
- (32) Yokoyama, T. 2008, in preparation
| Term | average | range |
|---|---|---|
| Continuum intensity(n-dim)……………… | 1.07 | 0.971.14 |
| Doppler velocity(km )…………………. | -0.82 | -3.32.0 |
| Total magnetic flux(Mx)………….. | 14.2 | 0.1334.4 |
| Unsigned longitudinal apparent flux density(Mx ) ……… | 12 | 0212 |
| Transverse apparent flux density(Mx )…………………….. | 79 | 4218 |
| Inclination to the surface being vertical to the LOS(degrees)… | 27.1 | 4.876.7 |