UPR2191, CNRS, Gif-sur-Yvette, France
11email: Destexhe@unic.cnrs-gif.fr
Self-sustained asynchronous irregular states and Up–Down states in thalamic, cortical and thalamocortical networks of nonlinear integrate-and-fire neurons
Abstract
Randomly-connected networks of integrate-and-fire (IF) neurons are known to display asynchronous irregular (AI) activity states, which resemble the discharge activity recorded in the cerebral cortex of awake animals. However, it is not clear whether such activity states are specific to simple IF models, or if they also exist in networks where neurons are endowed with complex intrinsic properties similar to electrophysiological measurements. Here, we investigate the occurrence of AI states in networks of nonlinear IF neurons, such as the adaptive exponential IF (Brette-Gerstner-Izhikevich) model. This model can display intrinsic properties such as low-threshold spike (LTS), regular spiking (RS) or fast-spiking (FS). We successively investigate the oscillatory and AI dynamics of thalamic, cortical and thalamocortical networks using such models. AI states can be found in each case, sometimes with surprisingly small network size of the order of a few tens of neurons. We show that the presence of LTS neurons in cortex or in thalamus, explains the robust emergence of AI states for relatively small network sizes. Finally, we investigate the role of spike-frequency adaptation (SFA). In cortical networks with strong SFA in RS cells, the AI state is transient, but when SFA is reduced, AI states can be self-sustained for long times. In thalamocortical networks, AI states are found when the cortex is itself in an AI state, but with strong SFA, the thalamocortical network displays Up and Down state transitions, similar to intracellular recordings during slow-wave sleep or anesthesia. Self-sustained Up and Down states could also be generated by two-layer cortical networks with LTS cells. These models suggest that intrinsic properties such as adaptation and low-threshold bursting activity are crucial for the genesis and control of AI states in thalamocortical networks.
Keywords: Computational models; Cerebral cortex; Thalamus; Thalamocortical system; Intrinsic neuronal properties; Network models
1 Introduction
In awake animals, the activity of single cortical neurons consist of seemingly noisy activity, with very irregular discharges at frequencies of 1-20 Hz and considerable fluctuations at the level of the membrane potential (Vm) (Matsumara et al., 1988; Steriade et al., 2001; Destexhe et al., 2003; Lee et al., 2006). Model networks of leaky integrate-and-fire (IF) neurons can display activity states similar to the irregular spike discharge seen in awake cortex. These so-called “asynchronous irregular” (AI) states contrast with the “synchronous regular” (SR) states, or with oscillatory states (Brunel, 2000). AI states have been observed more recently as a self-sustained activity in more realistic IF networks with conductance-based synapses (Vogels and Abbott, 2005). Such AI states typically require large network sizes, of the order of a few thousand neurons, to display characteristics consistent with experimental data (El Boustani et al., 2007; Kumar et al., 2008).
In reality, neurons do not behave as leaky IF models, but rather display complex intrinsic properties, such as adaptation or bursting, and these intrinsic properties may be important for neuronal function (Llinas, 1988). However, it is not clear to what extent AI states also appear in networks of more realistic neurons. Similarly, the genesis of AI states has never been investigated in the thalamocortical system. Recent efforts have been devoted to model intrinsic neuronal properties using variants of the IF model (Smith et al., 2000; Izhikevich, 2004; Brette and Gerstner, 2005). In the present paper, we use such models to analyze the genesis of AI states in cortical, thalamic and thalamocortical networks of neurons expressing complex intrinsic properties.
2 Methods
We successively describe the equations used for modeling neurons and synapses, the connectivity of the different network models, as well as the methods used to quantify network activity.
2.1 Single-cell models
To capture the intrinsic properties of central neurons, such as the rebound bursting capabilities of thalamic cells and the spike-frequency adaptation in cortex, we considered the adaptive exponential IF (aeIF) model. This model consists of the two-variable IF model proposed by Izhikevich (2004), which was modified to include an exponential non-linearity around spike threshold, based on the exponential IF model of Fourcaud-Trocme et al. (2003). These two models were combined by Brette and Gerstner (2005), leading to the following set of equations:
| (1) | |||||
where = 1 F/cm2 is the specific membrane capacitance, = 0.05 is the resting (leak) conductance, = -60 mV is the resting potential (which is also equal to the reset value after spike), = 2.5 mV is the steepness of the exponential approach to threshold, = -50 mV is the spike threshold, and = 20,000 m2 is the membrane area. When reaches threshold, a spike is emitted and is instantaneously reset and clamped to the reset value during a refractory period of 2.5 ms. is an adaptation variable, with time constant = 600 ms, and the dynamics of adaptation is given by parameter (in S). At each spike, is incremented by a value (in nA), which regulates the strength of adaptation, as analyzed in more detail in the next section.
2.2 Single-cell intrinsic properties
The Brette-Gerstner-Izhikevich model was reported to display a wide range of intrinsic neuronal properties (Izhikevich, 2004; Brette and Gerstner, 2005). We focus here only on a few cell types commonly encountered in the thalamocortical system. Cortical neurons were modeled as “regular spiking” (RS) cells with spike-frequency adaptation (Connors and Gutnick, 1990), which corresponds to the parameters = 0.001 S and = 0.04 nA in the aeIF model (Fig. 1A). The strength of adaptation can be modulated by varying the parameter , with = 0.005 nA for weakly adapting cells (Fig. 1B). This parameter was estimated heuristically based on Hodgkin-Huxley type models and RS cells found in different preparations (Pospischil et al., 2008). For , the model generated responses with a negligible level of adaptation (Fig. 1C), similar to the “fast-spiking” (FS) cells encountered in cortex, and which corresponds mostly to cortical inhibitory neurons (Connors and Gutnick, 1990). The latter will be used to model cortical inhibitory interneurons in the present model.

Increasing the parameter leads to bursting activity (Izhikevich, 2004). If we consider a moderate value of = 0.02 S, the model neuron also displays spike-frequency adaptation, even with (Fig. 1D, top). However, this model also generates a rebound burst in response to hyperpolarizing pulses, while the conventional spike threshold is unchanged (Fig. 1D, bottom). This behavior is similar to the cortical low-threshold spike (LTS) cells (de la Peña and Geijo-Barrientos, 1996).
A further increase of parameter leads to more robust bursting activity and weaker spike-frequency adaptation, producing patterns of responses with moderate adaptation and strong rebound bursts (Fig. 1E). This behavior was obtained for = 0.04 S and . With larger values, = 0.08 S and = 0.03 nA, the model generated bursting activity in response to both depolarizing and hyperpolarizing stimuli (Fig. 1F), similar to thalamic reticular (RE) neurons (Destexhe and Sejnowski, 2003).
Similar intrinsic properties as well as other types of behavior could be generated by other combinations of parameters (see Izhikevich, 2004), but were not considered here.
2.3 Network models
Network models were constructed based on this aeIF model, according to the following equations:
| (2) | |||||
where is the membrane potential of neuron , and all parameters are as in Eqs. 1, but were indexed to allow variations according to cell type (see Results). The term accounts for synaptic interactions, where is the conductance of the synapse from neuron to neuron (and which can be zero), and is the reversal potential of the synapse ( = 0 mV for excitatory synapses and -80 mV for inhibitory synapses). Synaptic conductance time courses were exponential; once the presynaptic cell fired, a fixed increment was assigned to the corresponding ( and for excitatory and inhibitory synapses, respectively), after which decays exponentially with a fixed time constant (5 ms for excitation and 10 ms for inhibition). Different synaptic strengths and were considered depending on the network type (see Results). No synaptic delays were considered.
Note that because only small networks are considered here (of the order of tens to a few thousand neurons), synaptic strengths need necessarily to be large compared to physiological values. Typical values are = 6 nS and = 67 nS (Vogels and Abbott, 2005), which correspond to postsynaptic potential sizes of 11 mV and 8.5 mV, respectively, at -70 mV and at rest. The amplitude of postsynaptic potentials will be vastly different in an active network, with typical values around 0.5 mV, respectively (El Boustani et al., 2007). Such a large difference is of course a property only seen in conductance-based models. It was shown that large networks (10,000 to over 100,000 neurons), with large numbers of synapses per neuron (), are necessary to achieve configurations with plausible synaptic conductance values (El Boustani et al, 2007; Kumar et al., 2008).
To initiate activity, a number of randomly-chosen neurons (from 2% to 10% of the network) were stimulated by random excitatory inputs during the first 50 ms of the simulation. The mean frequency of this random activity was high enough (200-400 Hz) to evoke random firing in the recipient neurons. In cases where self-sustained activity appeared to be unstable, different parameters of this initial stimulation were tested. It is important to note that after this initial period of 50 ms, no input was given to the network and thus the activity states described here are self-sustained with no external input or added noise. The only source of noise was the random connectivity (also termed “quenched noise”.)
All equations were solved using the NEURON simulation environment (Hines and Carnevale, 1997).
2.4 Connectivity
In all cases, the connectivity was random, but respected the anatomical and morphological constraints about the connection probability between the different cell types, as described below for thalamus, cortex and thalamocortical relations.
2.4.1 Thalamus
The structure of the thalamus was approximated by a two layer network of randomly connected cells, including one layer of thalamocortical (TC) relay cells and one layer of thalamic reticular (RE) cells. In a number of species such as rodents, some thalamic nuclei are devoid of interneurons (Jones, 1985). There is also evidence that thalamic interneurons do not play a major role in the genesis of internal dynamics, for example in oscillations (Steriade et al., 1985; von Krosigk et al., 1993). Thus, thalamic interneurons were not incorporated for simplicity. The thalamic network had 10 times less neurons compared to the cortical network, which corresponds to morphological estimates (Sherman and Guillery, 2001). Based on anatomical data showing that axonal projections within the thalamic circuitry are local but sparse (FitzGibbon et al., 1995; Jones, 1985; Minderhoud, 1971), the excitatory projection from TC to RE cells had a connection probability of 2%, as in cortex, while the RE to TC inhibitory projection was more dense (Kim et al., 1997), and was here of a probability of about 8%. The same density was assumed from inhibitory connections between RE cells.
This connectivity scheme corresponds to thalamic networks of size =100. When comparing networks of different size, the connection probability was rescaled inversely to network size, such that the number of synapses received by the neurons was invariant to size.
2.4.2 Cortex
In area 5 of cat cerebral cortex, axon collaterals from pyramidal cells are profuse and dense but remain localized within a few hundreds of microns (Avendaño et al., 1988). The connection densities of cells in the cortical network were organized such that each pyramidal cell (PY) or interneuron (IN) projected to a small proportion of about 2% of the size of the network. The same connection probability was also assumed for inhibitory connections. This connectivity was the same as that assumed in a previous model of cortical AI states (Vogels and Abbott, 2005). These connection probabilities correspond to a cortical network of =2000 neurons. As for thalamic networks, when different cortical network size were compared, the connection probability was rescaled inversely to network size to preserve the number of connections per neuron.
2.4.3 Thalamocortical relations
The thalamocortical and corticothalamic connections were also random, and their densities were estimated from morphological studies as follows. Ascending thalamocortical fibers give most of their synaptic contacts in layers I, IV and VI of cerebral cortex (White, 1986). Given that layer VI pyramidal neurons constitute the major source of corticothalamic fibers, these cells therefore mediate a monosynaptic excitatory feedback loop (thalamus-cortex-thalamus; White and Hersch, 1982), which was modeled here. This monosynaptic loop is also demonstrated by thalamically-evoked antidromic and monosynaptic responses in the same, deeply lying cortical cell (see Fig. 5 in Steriade et al., 1993b). The model incorporated the fact that all thalamic-projecting layer VI pyramidal cells connect TC cells while leaving axon collaterals in the RE nucleus. However, lower layer V pyramids also project to thalamic nuclei, but they do not leave collaterals in the RE nucleus (Bourassa and Deschênes, 1995); the latter were not modeled. We did not include either the influence of some thalamic intralaminar nuclei that project diffusely to the cerebral cortex as well as receive projections from it (Jones, 1985).
Projections between thalamus and cortex are also local and sparse (Avendaño et al., 1985; Jones, 1985; Robertson and Cunningham, 1981; Updyke, 1981) but have more divergence than intrathalamic or intracortical connections (Bourassa and Deschênes, 1995; Freund et al., 1989; Landry and Deschênes, 1981; Rausell and Jones, 1995). In the model, each PY cell had some probability of connecting to TC and RE cells, but due to the large number of cortical neurons, this corticothalamic connectivity was much more extended than local thalamic connectivity, so that cortical synapses were majoritary in thalamus (80% of synapses in TC cells were from cortex), as demonstrated experimentally (Sherman and Guillery, 2001). Similarly, each TC cell projected to PY and IN cells, using a connection probability of 2%. In these conditions, cortical connectivity was still dominated by intracortical synapses, as only about 6% of excitatory synapses were from thalamus, which corresponds well to estimates from morphological estimates (Braitenberg and Shutz, 1998).
Thus, similar to a previous model (Destexhe et al., 1998), this thalamocortical model can be thought of representing cerebral cortex Layer VI, connected reciprocally with its corresponding thalamic area. All axonal projections of a given type were identical in extent from cell to cell and all synaptic conductances were equal. The total synaptic conductance on each neuron was the same for cells of the same type, independently of the size of the network. The connection probabilities are summarized in Table 1.
| Connection type | Connection probability | Nb. synapses / neuron |
| PY PY | 2 % | 32 |
| PY IN | 2 % | 32 |
| IN PY | 2 % | 8 |
| IN IN | 2 % | 8 |
| PY TC | 2 % | 32 |
| PY RE | 2 % | 32 |
| TC RE | 2 % | 2 |
| RE TC | 8 % | 8 |
| RE RE | 8 % | 8 |
2.4.4 Two-layer cortical model
Interlayer connectivity in cerebral cortex involves both excitatory and inhibitory connections, but is predominantly excitatory, with a connection density specific to the layers considered (Thomson and Bannister, 2003; Binzegger et al., 2004). Interlayer (vertical) connectivity is also in general less dense than intra-layer (horizontal) connections. Two layers of cortical networks were modeled as described above, with excitatory-only interlayer connectivity with a probability of 1%, which is twice less dense than intra-layer connectivity (2%; see Table 1).
2.5 Quantification of network states
Network states were quantified according to two aspects: regularity and synchrony. To quantify the degree of temporal regularity, we used the coefficient of variation (CV) of the interspike intervals (ISI), averaged over all cells the network:
| (3) |
where the brackets indicate an average over all neurons, while and are respectively the mean and standard deviation of the ISIs of neuron . The is expected to take large values for temporally irregular systems (the CV is 1 for a Poisson process). In this paper, we considered that a system is “irregular” if the exceeds a value of 1.
The degree of synchrony was quantified using the averaged pairwise cross-correlation between neurons in the network:
| (4) |
where the brackets indicate an average over a large number
of disjoint pairs of neurons (in general 500 pairs were used),
is the covariance between two spike counts ,
and is the standard deviation of each spike count.
Spike counts were computed by counting spikes in successive time bins
of fixed duration (5 ms; all results were also checked using 2 ms).
The is comprised between -1 and 1, and takes high values only
for synchronous states. A given network state can reasonably be
considered as “asynchronous” if is low enough (typically ). These criteria and methods were similar to that used
previously to characterize different states in network models
(Brunel, 2000; Kumar et al., 2008; El Boustani and Destexhe, 2009).
3 Results
We successively consider network models for thalamus, cortex and the thalamocortical system, and analyze their dynamics as a function of their size and intrinsic properties.
3.1 Networks of thalamic neurons
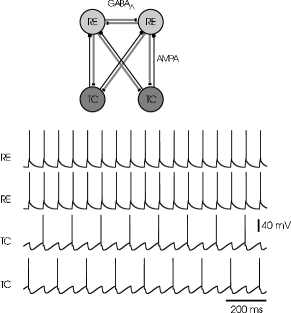
Interconnected thalamic TC and RE cells can generate oscillations in the spindle (7-14 Hz) frequency range (reviewed in Destexhe and Sejnowski, 2003). We first verified that the aeIF models outlined above were capable of replicating this oscillatory behavior. A small circuit of interconnected TC and RE cells was built, where all cells were interconnected, except for TC cells which do not have interconnections (Fig. 2, scheme). As shown in Fig. 2, this circuit generated self-sustained oscillations at a frequency around 10 Hz, with RE cells firing in response to EPSPs from TC cells, and TC cells firing in rebound to IPSPs from RE cells; the TC cells also generated subharmonic firing. These features are typical of spindle oscillations (Steriade, 2003). This behavior is only possible by taking into account the intrinsic properties of thalamic cells, and in particular the rebound bursting properties of TC cells (Destexhe and Sejnowski, 2003). As in more complex models, the oscillation frequency was dependent on the decay kinetics of synaptic currents, and the oscillation was observed for a large range of synaptic weights provided they were strong enough (not shown).
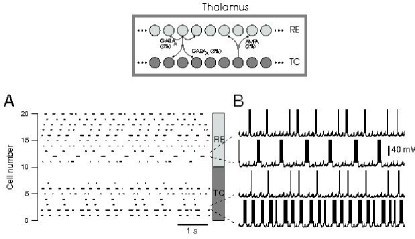
Small-size networks of TC and RE cells were considered by considering more diffuse and random connectivity between the two TC and RE layers, and weaker synaptic weights (see scheme in Fig. 3). In these conditions, a =20 network (10 TC and 10 RE cells) generated oscillatory behavior, but in contrast to the small circuit considered above, these oscillations appeared to be aperiodic, as seen from both rasterplot and single cells in Fig. 3. A phase plot between two TC cells (Fig. 3B, inset), as well as the high value of the coefficient of variation ( = 1.36 in this case), confirmed the aperiodic character of the oscillation. The raster plot also shows that there is little synchrony in the firing of TC or RE cells, unlike the circuit of Fig. 2. This was confirmed by the low value of the averaged cross-correlation ( = 0.025). This state resembles the “asynchronous regular” states described earlier (Brunel, 2000). This behavior was robust to long integration times (up to 100 sec were tested) without evidence for periodic behavior, suggesting that this type of dynamics is self-sustained and aperiodic. Note that there is a possibility that these regimes are periodic, but with a very long period which grows exponentially with network size (Cessac, 2008; Cessac and Viéville, 2009; see also Crutchfield and Kaneko, 1988; Tél and Lai, 2008).
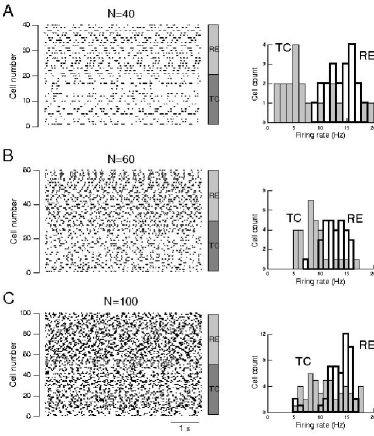
Networks comprising more thalamic neurons were considered based on a similar connectivity scheme and the same synaptic weights as for =20. By increasing the size from =40 to =100 generated patterns of aperiodic oscillatory activity (Fig. 4). With larger sizes, the activity became more and more similar to an “asynchronous irregular” state. For example, for a =100 network (Fig. 4C), the irregularity was high ( = 1.47) and the synchrony was low ().
This behavior was seen for a large domain of values for the synaptic conductances. This aspect, and more generally the robustness of irregular oscillations to synaptic conductances, was quantified in more detail in Fig. 5. The domain of oscillatory behavior was relatively large, provided both conductances were above some threshold value (about 4 nS for excitatory conductance inputs and 40 nS for inhibitory conductances). The firing rate tended to increase with the level of inhibition, which is presumably a consequence of the rebound properties of thalamic neurons. There were also small differences between =20 and =100 networks: the mean firing rate tended to be larger for , while the averaged pairwise correlation was lower (Fig. 5, bottom panels).

3.2 Cortical networks
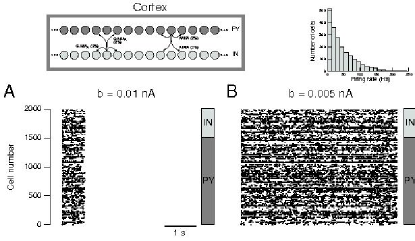
We next considered the activity of cortical networks composed of excitatory RS and inhibitory FS cells, randomly connected. Unlike thalamic networks, cortical circuits of this type do not generate self-sustained AI states unless large networks are considered (Vogels and Abbott, 2005; Kumar et al., 2008). Compared to previous studies using leaky IF models, the present model considers more complex IF models, in particular for RS cells which display prominent spike-frequency adaptation. The cortical network had 80% excitatory and 20% inhibitory cells, and was randomly connected (see scheme in Fig. 6). In these conditions, the genesis of self-sustained AI states was possible, but was highly dependent on the level of adaptation, as illustrated in Fig. 6. For strong to moderate adaptation, the network generated AI states but they were transient and did not survive more than a few seconds (Fig. 6A). For weak adaptation, the AI states could be sustained (Fig. 6B).
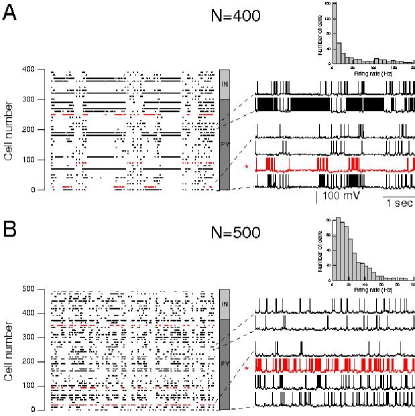
The situation was radically different in the presence of LTS cells. Networks of relatively small size, =400 (Fig. 7A) or =500 (Fig. 7B), could generate self-sustained AI states if a proportion of LTS cells was present (LTS cells were connected identically as for RS cells). For =400, the system exhibited intermittent-like dynamics (Fig. 7A), which was typical of the transition between self-sustained oscillations, and AI type behavior. In this intermittency, the network switches between SR and AI states, while for larger networks, the dynamics remain in the AI state without intermittency (Fig. 7B).
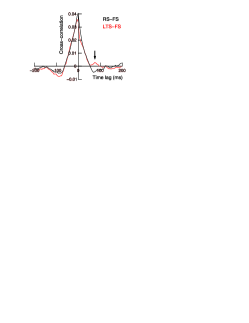
To further characterize the role of LTS cells, the cross-correlation between LTS cells and inhibitory FS cells was calculated and compared with the cross-correlation between RS and RS cells (Fig. 8). Because the firing FS cells leads only to inhibition of RS cells, the cross-correlation is negative for positive values of the time lag (Fig. 8, arrow in black curve). It is also negative for negative time lags, presumably due to the inhibition between FS cells. However, when correlating LTS cells with FS cells, the pattern was different for positive time lags, and positive correlations appeared (Fig. 8, arrow in red curve). This indicates that FS cells tend to excite LTS cells after some delay of about 70 ms, which seems to correspond to the post-inhibitory rebound because LTS and RS cells had the same connectivity. This positive value was also observed for other network configurations with LTS cells (not shown).
These results suggest that, through their post-inhibitory rebound property, the presence of LTS cells increases the excitability of the network, enabling the genesis of AI states with relatively small network sizes. Indeed, by simulating different network size, with and without LTS cells, revealed that the minimal size needed to sustain AI states was highly reduced in the presence of LTS cells (Fig. 9). Moreover, the minimal size was inversely related to the proportion of LTS cells (from 0% to 20%; see Fig. 9).

3.3 Thalamocortical networks
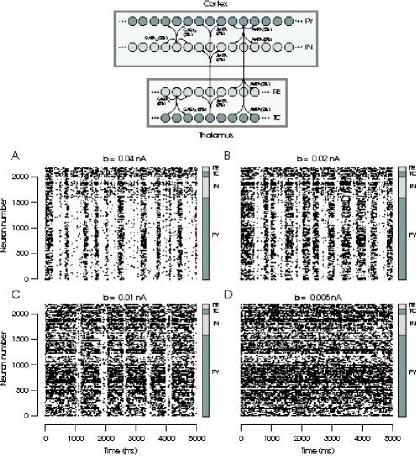
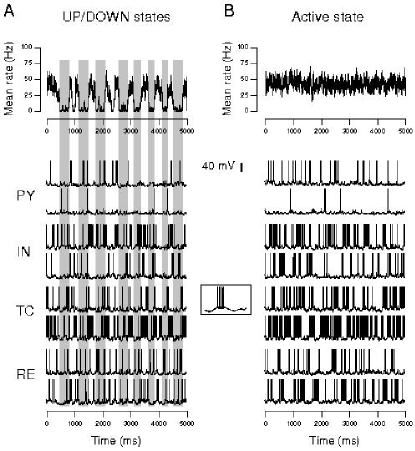
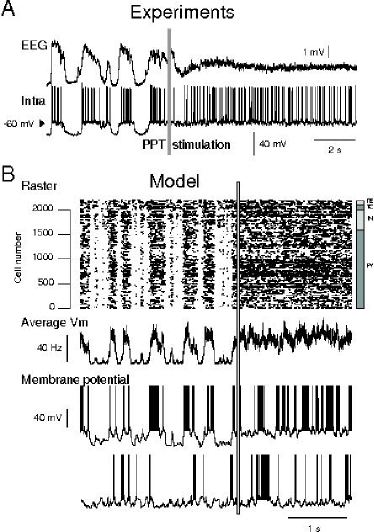
The behavior of a thalamocortical network connected as schematized in Fig. 10 (top) also depends on the level of adaptation in cortical cells. With strong adaptation, the network displayed alternating dynamics of active and silent periods (Up/Down states; see Fig. 10A). Progressively diminishing adaptation (Fig. 10B-C) led to dynamics where the silent periods (Down states) were diminished while the active (Up) states were longer. For weak adaptation, the network displayed self-sustained AI states with no silent period (continuous Up state; Fig. 10D). This latter state qualifies as an AI state, with = 2.45 and = 0.004. The corresponding cellular activities are shown in Fig. 11. Note that the firing rate of the model (around 40 Hz on average) is larger than experimental data, for both up states and AI states. This is due to the relatively small size of the network, as only networks of large size can self-sustain AI states at low rates (El Boustani and Destexhe, 2009).
Because neuromodulatory substances, such as acetylcholine or noradrenaline, block the K+ conductances responsible for adaptation (McCormick, 1992), the transition from Up & Down states to self-sustained active states in Fig. 10 by reducing spike-frequency adaptation reminds the brain activation process. Experimentally, a transition from Up/Down state dynamics to self-sustained activated states can be obtained by electrical stimulation of the brain stem, inducing a cascade of cholinergic actions in thalamus and cortex (Fig. 12A; Steriade et al., 1993a; Rudolph et al., 2005). One of the most prominent of these actions is a reduction in spike-frequency adaptation (McCormick, 1992). A very similar transition can be obtained in the model when the adaptation is reduced (from =0.02 nA in A to =0.005 nA; see Fig. 12B).
3.4 Two-layer cortical networks
The above mechanism for Up/Down states relies on the fact that the
thalamus displays self-sustained AI states. In the present section,
we present a similar mechanism but internal to cortex, in better
agreement with experiments which reported self-sustained Up/Down
state dynamics in cortical slices (Sanchez-Vives and McCormick, 2000;
Cossart et al., 2003). To this end, the results from preceding
sections were combined into a “two layer” cortical network in which
one layer consisted of RS and FS cells, as described above
(Fig. 6A), while a second layer was a smaller network of
RS and FS cells, with some proportion of LTS cells, as in
Fig. 7B. These two networks were referred as “Layer A”
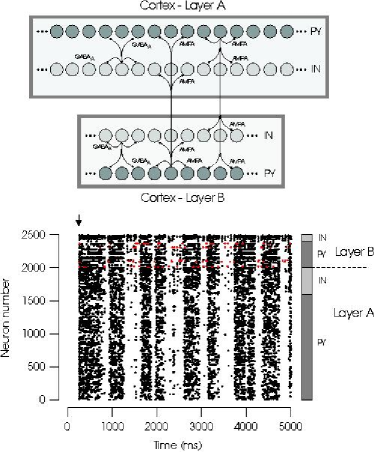
and “Layer B”, respectively (see scheme in Fig. 13).
When reciprocally connected with excitatory synapses, this 2-layer
system exhibited Up/Down state dynamics with a mechanism similar to
that described in the preceding section for thalamocortical networks.
In the present case, the Layer B network generated self-sustained
activity, which served to ignite activity in the Layer A (see raster
in Fig. 13, bottom). Interestingly, this simulation shows
that a network displaying transient dynamics (Fig. 6A)
connected with a network displaying AI states (Fig. 7B)
yields a system displaying a different type of activity, Up and Down
states in this case. This dynamics was entirely self-sustained and
coexisted with a stable resting state (Fig. 13, arrow).
All of these behaviors are indissociable from the particular
intrinsic properties of the neurons present in the system.
4 Discussion
In this paper, we have shown that networks of neurons displaying complex intrinsic properties can display various type of AI states. The main finding were that (a) thalamic networks, where neurons are endowed with rebound bursting capabilities, can display AI states for remarkably small size (N100). (b) Cortical networks display AI states, as reported previously (Brunel 2000, Vogels and Abbott, 2005), but when adaptation is included in excitatory neurons, cortical networks generate AI states only for weak adaptation. (c) Including a small proportion of LTS cells in cortical networks greatly reduces the minimal size needed to generate AI states. (d) thalamocortical networks can display AI states or Up/Down state dynamics, depending on the level of adaptation in cortical cells. (e) Two-layer cortical networks can self-sustain Up/Down states solely from intrinsic dynamics.
These numerical observations suggest that spike-frequency adaptation acts against the genesis of AI states, and tends to silence the network (Fig. 6). Adaptation diminishes excitability, and several neuromodulators increase cortical excitability by blocking the slow K+ conductances responsible for adaptation (McCormick, 1992). Neuromodulation has also strong effects on leak conductances, in particular in the thalamus (McCormick, 1992). We did not attempt to incorporate such effects in this model, but the precise modeling of neuromodulation, and possible transitions from AI to various types of oscillatory behavior, constitutes a possible extension of the model.
The presence of LTS neurons tends to greatly favor AI states. This is consistent with the genesis of AI states in very small thalamic networks (N100; Fig. 4), where all neurons display LTS. In cortex, inclusion of a small proportion of LTS cells (as observed experimentally; see de la Pena and Geijo-Barrientos, 1996; Destexhe et al., 2001), greatly reduces the minimal size to display AI states. The probable mechanisms is that LTS cells renders the network insensitive to “gaps” of firing, caused by occasional synchronized inhibition, and which usually stops the activity. These gaps are followed by rebound bursts in a minority of LTS cells if they are present, and thus renders the network less vulnerable to such gaps. This also suggests that LTS cells could be indicative of networks that generate AI type of activity. It would be interesting to investigate in more detail, and perhaps theoretically, the contrasting effects of adaptation and LTS on the genesis of AI states. Inclusion of other types of bursting cells, such as intrinsically bursting neurons (Connors and Gutnick, 1990) or inhibitory LTS cells (Xiang et al., 1998), also constitutes a possible extension of this study.
In the thalamocortical system, the association of thalamic networks and cortical networks generates a variety of states, including AI states and different forms of Up/Down state dynamics, for different levels of adaptation in cortical excitatory cells. Reducing adaptation, mimicking the action of some neuromodulators such as acetylcholine, may induce a transition from Up/Down state dynamics to sustained AI states. This transition is similar to the activation of the brain by neuromodulators, which also can produce a transition between slow-wave activity with Up/Down state dynamics, to the so-called “desynchronized” EEG activity. This transition naturally occurs upon awakening from slow-wave sleep (Steriade, 2003), or can be induced by stimulation of the ascending neuromodulatory systems (Steriade et al, 1993a; Fig. 12A), and can be mimicked by the thalamocortical model by a reduction of the adaptation parameter (Fig. 12B). This is consistent with the action of neuromodulators, such as acetylcholine, to block or reduce K+ conductances responsible for spike-frequency adaptation (McCormick, 1992).
In this paper, there was no attempt to reproduce the correct cellular conductance patterns of the different network states. Experimental measurements show that the input resistance of cortical neurons in vivo is reduced by 3 to 5 times compared to quiescent states, in both anesthetized animals (Contreras et al., 1996; Borg-Graham et al., 1998; Pare et al., 1998; Destexhe and Pare, 1999) and awake animals (Baranyi et al., 1993a, 1993b; Steriade et al., 2001; reviewed in Destexhe et al., 2003; Destexhe, 2007). The excitatory and inhibitory synaptic conductances were also measured in anesthetized (Borg-Graham et al., 1998; Rudolph et al., 2005) and awake preparations (Rudolph et al., 2007). Reproducing the correct conductance state in individual neurons requires large network sizes (El Boustani et al., 2007; Kumar et al., 2008), and was not attempted here. We rather focused on the minimal size necessary to obtain AI states in different network configurations, but obtaining states fully consistent with experimental data will require substantial computational resources to simulate large networks of aeIF neurons, and constitutes a logical follow-up of this study.
It is also interesting to note that this thalamocortical model is different than previous models of Up/Down states in cortical networks (Timofeev et al., 2000; Compte et al., 2003; Parga and Abbott, 2007). Previous models have considered additional mechanisms to initiate Up states, which amounts to have some cortical neurons spontaneously firing or external noise. In contrast, Up/Down state dynamics arise here entirely from self-sustained activity. In the thalamocortical model, the cortex is in a state generating transient dynamics (as in Fig. 6A), while the thalamus is in an AI state. The system generates a transient Up state, then the activity stops, leading to a Down state. The activity restarts due to the firing of TC cells which triggers a new Up state, and the cycle restarts. This model therefore does not generate Up/Down state dynamics in the cortex alone, contrary to observations of Up/Down states in cortical slices (Sanchez-Vives and McCormick, 2000; Cossart et al., 2003) or in cortical organotypic cultures (Plenz and Aertsen, 1996). It nevertheless accounts for the fact that the thalamus ignites the Up states in the intact thalamocortical system in vivo (Contreras and Steriade, 1995; Grenier et al., 1998).
Similar Up/Down state dynamics were also observed in a more sophisticated model of the cortex allowing layered connectivity, in which a small sub-network played the role of AI state generator, while the rest of the network was passive and generated transient dynamics, as in Fig. 6A. The interconnections between two such networks generated Up/Down state dynamics very similar to the thalamocortical model, except that in this case, the activity was entirely generated within the cortex, in agreement with cortical slice experiments. The sub-network displaying self-sustained AI states (Layer B in Fig. 13) may represent Layer V networks, which were reported to initiate the activity during Up states in cortical slices (Sanchez-Vives and McCormick, 2000). Also similar to the thalamocortical model, this two-layer model of the cortex generated Up/Down state dynamics entirely from the internal dynamics of the system, without the requirement of spontaneously firing cells, or additional noise, as in previous models. The bistability of this system was illustrated by the coexistence of a stable resting state and Up/Down state dynamics (Fig. 13, arrow). Note that here, the specific choice of networks with LTS cells (layer B) should not be considered as a prediction, as similar dynamics should also be observed if Layer B was a network of RS and FS cells displaying AI states (as in Fig. 6B). The essential prediction here is that a network with self-sustained activity, combined with another network displaying spike-frequency adaptation, is a possible generator of self-sustained Up/Down state dynamics.
Finally, the present model reports a variety of AI states in different network configurations, but it is important to note that AI states may be transient in nature. Transient chaotic regimes have been extensively studied (Crutchfield and Kaneko, 1988; Zillmer et al., 2006; Cessac, 2008; Cessac and Viéville, 2009; reviewed in Tél and Lai, 2008). The lifetime of these transient regimes is known to increase exponentially with network size (Crutchfield and Kaneko, 1988; Kumar et al., 2008; Tél and Lai, 2008; El Boustani and Destexhe, 2009). For large networks, of the order of thousand or more neurons, this lifetime can reach considerable times (beyond any reasonable simulation time; see Kumar et al., 2008). It is thus difficult to formally establish the transient nature of such states with numerical simulations. However, although AI states may not represent a stable attractor of the system, they are nevertheless relevant because they represent the dynamics of the system within any reasonably accessible time period.
In conclusion, we have shown here what should be considered as the beginning of an exploration of the collective dynamics of populations of neurons endowed with complex intrinsic properties as given by the aeIF model. The presence of such properties has important effects on network behavior, and in particular affects the genesis of AI state. AI states are not possible in small networks without LTS properties, which certainly constitutes an interesting prediction. More generally, future studies should investigate intrinsic properties as a continuum rather than distinct neuronal classes. Such a continuum should be possible to define using IF models such as the aeIF model used here.
Acknowledgments
Thanks to Sami El Boustani for comments on the manuscript. Research supported by the Centre National de la Recherche Scientifique (CNRS, France), Agence Nationale de la Recherche (ANR, France) and the Future and Emerging Technologies program (FET, European Union; FACETS project). Additional information is available at http://cns.iaf.cnrs-gif.fr
References
- 1(1)Avendano88 Avendaño C, Rausell E, Perez-Aguilar D, and
Isorna S. (1988) Organization of the association cortical afferent
connections of area 5: a retrograde tracer study in the cat. J.
Comp. Neurol. 278: 1-33.
2(2)Avendano85 Avendaño C, Rausell E and Reinoso-Suarez F.
(1985) Thalamic projections to areas 5a and 5b of the parietal cortex
in the cat: a retrograde horseradish peroxidase study. J. Neurosci.
5: 1446-1470.
3(3)BarWoo93a Baranyi A., Szente M.B., Woody C.D. (1993a)
Electrophysiological characterization of different types of neurons
recorded in vivo in the motor cortex of the cat. I. patterns of
firing activity and synaptic responses. J. Neurophysiol. 69:
1850-1864.
4(4)BarWoo93b Baranyi A., Szente M.B., Woody C.D. (1993b)
Electrophysiological characterization of different types of neurons
recorded in vivo in the motor cortex of the cat. II. Membrane
parameters, action potentials, current-induced voltage responses and
electrotonic structures. J. Neurophysiol. 69: 1865-1879.
5(5)Binzegger2004 Binzegger T, Douglas RJ and Martin, KAC.
(2004) A quantitative map of the circuit of cat primary visual
cortex. J. Neurosci. 24: 8441-8453.
6(6)BorFre98 Borg-Graham L.J., Monier C., Frégnac Y. (1998)
Visual input evokes transient and strong shunting inhibition in
visual cortical neurons. Nature 393: 369-373.
7(7)Bourassa95 Bourassa J and Deschênes M. (1995)
Corticothalamic projections from the primary visual cortex in rats: a
single fiber study using biocytin as an anterograde tracer.
Neuroscience 66: 253-263.
8(8)Braitenberg98 Braitenberg, V. and Schüz, A. (1998) Cortex: statistics and geometry of neuronal connectivity (2nd
edition). Springer-Verlag, Berlin.
9(9)Brette2005 Brette R and Gerstner W. (2005) Adaptive
exponential integrate-and-fire model as an effective description of
neuronal activity. J. Neurophysiol. 94: 3637-3642.
10(10)Brunel2000 Brunel N. (2000) Dynamics of sparsely connected
networks of excitatory and inhibitory spiking neurons. J. Comput.
Neurosci. 8: 183-208.
11(11)Cessac2008 Cessac, B. (2008) A discrete time neural network
model with spiking neurons. Rigorous results on the spontaneous
dynamics. J. Math. Biol. 56: 311-345.
12(12)Cessac-Vieville2008 Cessac, B. and Viéville, T. (2009)
On dynamics of integrate-and-fire neural networks with conductance
based synapses. Front. Comput. Neurosci. 3: 1.
13(13)Crutchfield88 Crutchfield, J.P. and Kaneko, K. (1988) Are
attractors relevant to turbulence? Phys. Rev. Lett. 60: 2715-2718.
14(14)Compte2003 Compte, A., Sanchez-Vives, M.V., McCormick, D.A.
and Wang, X.J. (2003) Cellular and network mechanisms of slow
oscillatory activity (<<1 Hz) and wave propagations in a cortical
network model. J. Neurophysiol. 89: 2707-2725.
15(15)Connors90 Connors, B.W. and Gutnick, M.J. (1990) Intrinsic
Firing patterns of diverse neocortical neurons. Trends Neurosci. 13:
99-104.
16(16)Contreras95 Contreras D and Steriade M (1995) Cellular
basis of EEG slow rhythms: a study of dynamic corticothalamic
relationships. J. Neurosci. 15: 604-622.
17(17)ConSte96 Contreras D., Timofeev I., Steriade M. (1996)
Mechanisms of long lasting hyperpolarizations underlying slow sleep
oscillations in cat corticothalamic networks. J. Physiol. 494:
251-264.
18(18)Cossart2003 Cossart R, Aronov D, Yuste R. (2003) Attractor
dynamics of network UP states in the neocortex. Nature 423: 283-238.
19(19)delaPena96 de la Peña E and Geijo-Barrientos E. (1996)
Laminar organization, morphology and physiological properties of
pyramidal neurons that have the low-threshold calcium current in the
guinea-pig frontal cortex. J. Neurosci. 16: 5301-5311.
20(20)Destexhe2007 Destexhe, A. (2007) High-conductance state.
Scholarpedia 2(11): 1341 http://www.scholarpedia.org/article/High-Conductance\_State
21(21)Destexhe-Contreras2006 Destexhe A and Contreras D. (2006)
Neuronal computations with stochastic network states. Science 314:
85-90.
22(22)DesPar99 Destexhe A and Paré D. (1999) Impact of network
activity on the integrative properties of neocortical pyramidal
neurons in vivo. J. Neurophysiol. 81: 1531-1547.
23(23)JNP98 Destexhe A, Contreras D and Steriade M. (1998)
Mechanisms underlying the synchronizing action of corticothalamic
feedback through inhibition of thalamic relay cells. J.
Neurophysiol. 79: 999-1016.
24(24)CxSW Destexhe A, Contreras D and Steriade M. (2001) LTS
cells in cerebral cortex and their role in generating spike-and-wave
oscillations. Neurocomputing 38: 555-563.
25(25)TINS2007 Destexhe A., Hughes SW, Rudolph M, Crunelli V.
(2007) Are corticothalamic ‘up’ states fragments of wakefulness?
Trends Neurosci. 30: 334-342.
26(26)DP99 Destexhe A, Paré D. (1999) Impact of network
activity on the integrative properties of neocortical pyramidal
neurons in vivo. J. Neurophysiol. 81: 1531-1547.
27(27)Dest2003 Destexhe A, Rudolph, M, Paré D (2003) The
high-conductance state of neocortical neurons in vivo. Nature
Reviews Neurosci. 4: 739-751.
28(28)PhysiolRev2003 Destexhe A, Sejnowski TJ. (2003)
Interactions between membrane conductances underlying thalamocortical
slow-wave oscillations. Physiol. Reviews 83: 1401-1453.
29(29)Master2008 El Boustani, S. and Destexhe, A. (2009) A
master equation formalism for macroscopic modeling of asynchronous
irregular activity states. Neural Comput. 21: 46-100.
30(30)Sami2007 El Boustani S, Pospischil M, Rudolph-Lilith M,
Destexhe A. (2007) Activated cortical states: experiments, analyses
and models. J. Physiol. Paris 101: 99-109.
31(31)FitzGibbon95 FitzGibbon T, Tevah LV and Jervie-Sefton A.
(1995) Connections between the reticular nucleus of the thalamus and
pulvinar-lateralis posterior complex: a WGA-HRP study. J. Comp.
Neurol. 363: 489-504.
32(32)Fourcaud2003 Fourcaud-Trocme N, Hansel D, van Vreeswijk C
and Brunel N. (2003) How spike generation mechanisms determine the
neuronal response to fluctuating inputs. J. Neurosci. 23:
11628-11640.
33(33)Freund89 Freund TF, Martin KA, Soltesz I, Somogyi P and
Whitteridge D. (1989) Arborisation pattern and postsynaptic targets
of physiologically identified thalamocortical afferents in striate
cortex of the macaque monkey. J. Comp. Neurol. 289: 315-336.
34(34)Grenier98 Grenier F, Timofeev I and Steriade M. (1998)
Leading role of thalamic over cortical neurons during postinhibitory
rebound excitation. Proc. Natl. Acad. Sci. USA 95: 13929-13934.
35(35)Hines97 Hines, M.L. and Carnevale, N.T. (1997). The Neuron
simulation environment. Neural Computation 9: 1179-1209.
36(36)Izhikevich2004 Izhikevich EM. (2004) Which model to use for
cortical spiking neurons? IEEE Trans. Neural Networks. 15: 1063-1070.
37(37)Jones:Thalamus Jones, E.G. (1985) The Thalamus.
Plenum Press, New York.
38(38)Kim97 Kim U, Sanches-Vives MV and McCormick DA. (1997)
Functional dynamics of GABAergic inhibition in the thalamus. Science
278: 130-134.
39(39)Kumar2008 Kumar A, Schrader S, Aertsen A, Rotter S. (2008)
The high-conductance state of cortical networks. Neural Comput. 20:
1-43.
40(40)Landry81 Landry P and Deschênes M. (1981) Intracortical
arborizations and receptive fields of identified ventrobasal
thalamocortical afferents to the primary somatic sensory cortex in
the cat. J. Comp. Neurol. 199: 345-371.
41(41)Lee2006 Lee AK, Manns ID, Sakmann B and Brecht M. (2006)
Whole-cell recordings in freely moving rats. Neuron 51: 399-407.
42(42)Llinas88 Llinás RR. (1988) The intrinsic
electrophysiological properties of mammalian neurons: a new insight
into CNS function. Science 242: 1654-1664.
43(43)Matsumara88 Matsumura M, Cope T, Fetz EE. (1988) Sustained
excitatory synaptic input to motor cortex neurons in awake animals
revealed by intracellular recording of membrane potentials. Exp.
Brain Res. 70: 463-469.
44(44)McCormick92 McCormick DA. (1992) Neurotransmitter actions
in the thalamus and cerebral cortex and their role in neuromodulation
of thalamocortical activity. Prog. Neurobiol. 39: 337-388.
45(45)Minderhoud71 Minderhoud JM. (1971) An anatomical study of
the efferent connections of the thalamic reticular nucleus. Exp.
Brain Res. 112: 435-446.
46(46)Muller2007 Muller E, Buesing L, Schemmel J, Meier K. (2007)
Spike-frequency adapting neural ensembles: beyond mean adaptation and
renewal theories. Neural Computation 19: 2958-3010.
47(47)Pare98 Paré D, Shink E, Gaudreau H, Destexhe A, Lang EJ.
(1998) Impact of spontaneous synaptic activity on the resting
properties of cat neocortical neurons in vivo. J. Neurophysiol. 79:
1450-1460.
48(48)Parga2007 Parga N and Abbott LF. (2007) Network model of
spontaneous activity exhibiting synchronous transitions between up
and down States. Front. Neurosci. 1: 57-66.
49(49)Plenz96 Plenz, D., and Aertsen, A. (1996) Neural dynamics
in cortex-striatum co-cultures II - spatiotemporal characteristics of
neuronal activity. Neuroscience 70: 893-924.
50(50)Lausanne2008 Pospischil, M., Toledo-Rodriguez, M., Monier,
C., Piwkowska, Z., Bal, T., Frégnac, Y., Markram, H. and Destexhe,
A. (2008) Minimal Hodgkin-Huxley type models for different classes
of cortical and thalamic neurons. Biol. Cybernetics 99: 427-441.
51(51)Raussell95 Rausell E and Jones EG. (1995) Extent of
intracortical arborization of thalamocortical axons as a determinant
of representational plasticity in monkey somatic sensory cortex. J.
Neurosci. 15: 4270-4288.
52(52)Robertson81 Robertson RT and Cunningham TJ. (1981)
Organization of corticothalamic projections from parietal cortex in
cat. J. Comp. Neurol. 199: 569-585.
53(53)PPT Rudolph, M., Pelletier, J-G., Paré, D. and Destexhe,
A. (2005) Characterization of synaptic conductances and integrative
properties during electrically-induced EEG-activated states in
neocortical neurons in vivo. J. Neurophysiol. 94: 2805-2821.
54(54)Rud2007 Rudolph, M., Pospischil, M., Timofeev, I. and
Destexhe, A. (2007) Inhibition determines membrane potential
dynamics and controls action potential generation in awake and
sleeping cat cortex. J. Neurosci. 27: 5280-5290.
55(55)Sanchez2000 Sanchez-Vives, MV and McCormick, DA. (2000)
Cellular and network mechanisms of rhythmic recurrent activity in
neocortex. Nat. Neurosci. 10: 1027-1034.
56(56)Sherman2001 Sherman, S. M. & Guillery, R. W. (2001) Exploring the Thalamus. Academic Press, New York.
57(57)Smith2000 Smith GD, Cox CL, Sherman M and Rinzel J. (2000).
Fourier analysis of sinusoidally driven thalamocortical relay neurons
and a minimal integrate-and-fire-or-burst model. J. Neurophysiol. 83:
588-610.
58(58)Ster70 Steriade M. (1970) Ascending control of thalamic and
cortical responsiveness. Int. Rev. Neurobiol. 12: 87-144.
59(59)Ster2001 Steriade, M. (2001) Impact of network activities
on neuronal properties in corticothalamic systems. J. Neurophysiol.
86: 1-39.
60(60)Ster2003 Steriade, M. (2003) Neuronal Substrates of
Sleep and Epilepsy. Cambridge University Press, Cambridge, UK.
61(61)Ster93a Steriade M, Amzica F, Nunez A. (1993a) Cholinergic
and noradrenergic modulation of the slow (∼similar-to\sim0.3 Hz) oscillation
in neocortical cells. J Neurophysiol 70: 1384-1400.
62(62)Steriade85 Steriade M, Deschênes M, Domich L and Mulle C.
(1985) Abolition of spindle oscillations in thalamic neurons
disconnected from nucleus reticularis thalami. J. Neurophysiol. 54:
1473-1497.
63(63)Ster90 Steriade, M., McCarley, R.W. (1990) Brainstem
Control of Wakefulness and Sleep, Plenum Press, New York.
64(64)Steriade:slow2 Steriade M, Nunez A and Amzica F. (1993b)
Intracellular analysis of relations between the slow (<< 1 Hz𝐻𝑧Hz)
neocortical oscillation and other sleep rhythms of the
electroencephalogram. J. Neurosci. 13: 3266-3283.
65(65)Steriade2001 Steriade M, Timofeev I, Grenier F. (2001)
Natural waking and sleep states: a view from inside neocortical
neurons. J. Neurophysiol. 85: 1969-1985.
66(66)Tel2008 Tél, T. and Lai, Y.-C. (2008) Chaotic transients
in spatially extended systems. Physics Rep. 460: 245-275.
67(67)Timofeev2000 Timofeev I, Grenier F, Bazhenov M, Sejnowski
TJ and Steriade M. (2000) Origin of slow cortical oscillations in
deafferented cortical slabs. Cereb. Cortex 10: 1185-1199.
68(68)Thomson2003 Thomson AM and Bannister AP. (2003)
Interlaminar connections in the neocortex. Cereb. Cortex 13: 5-14.
69(69)Updyke81 Updyke BV. (1981) Projections from visual areas
of the middle suprasylvian sulcus onto the lateral posterior complex
and adjacent thalamic nuclei in cat. J. Comp. Neurol. 201: 477-506.
70(70)Vogels2005 Vogels TP and Abbott LF. (2005) Signal
propagation and logic gating in networks of integrate-and-fire
neurons. J. Neurosci. 25: 10786-10795.
71(71)McCormick:spindles von Krosigk M, Bal T and McCormick, DA.
(1993) Cellular mechanisms of a synchronized oscillation in the
thalamus. Science 261: 361-364.
72(72)White86 White EL. (1986) Termination of thalamic afferents
in the cerebral cortex. In: Cerebral Cortex (Jones EG, Peters
A, eds) Vol. 5, pp 271-289. New York: Plenum Press.
73(73)White-Hersch82 White EL and Hersch SM. (1982) A
quantitative study of thalamocortical and other synapses involving
the apical dendrites of corticothalamic cells in mouse SmI cortex.
J. Neurocytol. 11: 137-157.
74(74)Xiang98 Xiang, Z., Huguenard, J.R. and Prince, D.A. (1998)
Cholinergic switching within neocortical inhibitory networks. Science
281: 985-988.
75(75)Zillmer2006 Zillmer R, Livi R, Politi A and Torcini A.
(2006). Desynchronization in diluted neural networks. Phys. Rev. E.
74: 036203.