The Extragalactic Distance Scale without Cepheids
Abstract
Distances of galaxies in the Hubble Space Telescope Key Project are based on the Cepheid period-luminosity relation. An alternative basis is the tip of the red giant branch. Using archival HST data, we calibrate the infrared Tully-Fisher relation using 14 galaxies with tip of the red giant branch measurements. Compared with the Key Project, a higher value of the Hubble Constant by 10% 7% is inferred. Within the errors the two distance scales are therefore consistent. We describe the additional data required for a conclusive tip of the red giant branch measurement of H0.
1 Introduction
The extragalactic distance scale based on the Cepheid period-luminosity (PL) relation and secondary distance indicators, such as the Tully-Fisher relation, the supernova standard candle (Gibson et al., 2000), surface brightness fluctuations, and the fundamental plane (Freedman et al., 2001; Mould et al., 2000) has been criticized recently (Tammann et al., 2008a; Sandage et al., 2007) on the grounds that the PL relation may not be unique. Indeed, the finite width of the Cepheid instability strip in the HR diagram implies that nuisance parameters such as metallity and star formation history may play a role in determining the PL relation. Metallicity was considered as a second parameter by Freedman et al. (2001), Sakai et al. (2004), and Macri et al. (2006). Romaniello et al. (2008) have reviewed the situation and concluded that the Cepheid PL relation is not universal.
It is of interest, therefore, to see how well the distance scale can be measured without reference to Cepheids at all. In this Letter we use the tip of the red giant branch (TRGB) distance indicator to calibrate the Tully-Fisher relation. The TRGB is a good standard candle because it results from the helium flash on the red giant branch, which theory suggests is relatively immune to metallicity effects in old stellar populations.
2 TRGB distances
The TRGB is unquestionably the most practical distance indicator for nearby galaxies. It is versatile, fast, and theoretically verified (Salaris & Cassisi, 1997; Madore & Freedman, 1999; Salaris et al., 2002).
The zero point of the TRGB magnitude, however, has been debated in several papers. Da Costa & Armandroff (1990) first derived the bolometric magnitude of the TRGB. The distance modulus measured by the TRGB method is then estimated via , where the bolometric correction () and the bolometric magnitude () are both dependent on the color of the TRGB stars. Using this calibration, the TRGB magnitude in I-band is determined to be between and depending on the colors of the RGB stars found. The absolute zero point of this calibration was based on the distances to Galactic globular clusters that were measured using the RR Lyrae method zero point based on Lee et al. (1990). On the other hand, Salaris & Cassisi (1997) presented a theoretical calibration of the TRGB zero point and concluded that the empirical calibration by Da Costa & Armandroff was too faint by 0.1 mag, likely due to the fact that the RGB population of Galactic globular clusters used in the empirical calibration were not well populated around the tip.
Most recently, Rizzi et al. (2007) explored the calibration issue and established a new calibration based on the assumed luminosity for the horizontal branch and the identification of this feature in five Local Group galaxies. This calibration gives the I-band TRGB magnitude of at mag. Furthermore, the Rizzi et al. (2007) calibration is not linked to the Cepheid distance scale in any way and is completely independent.
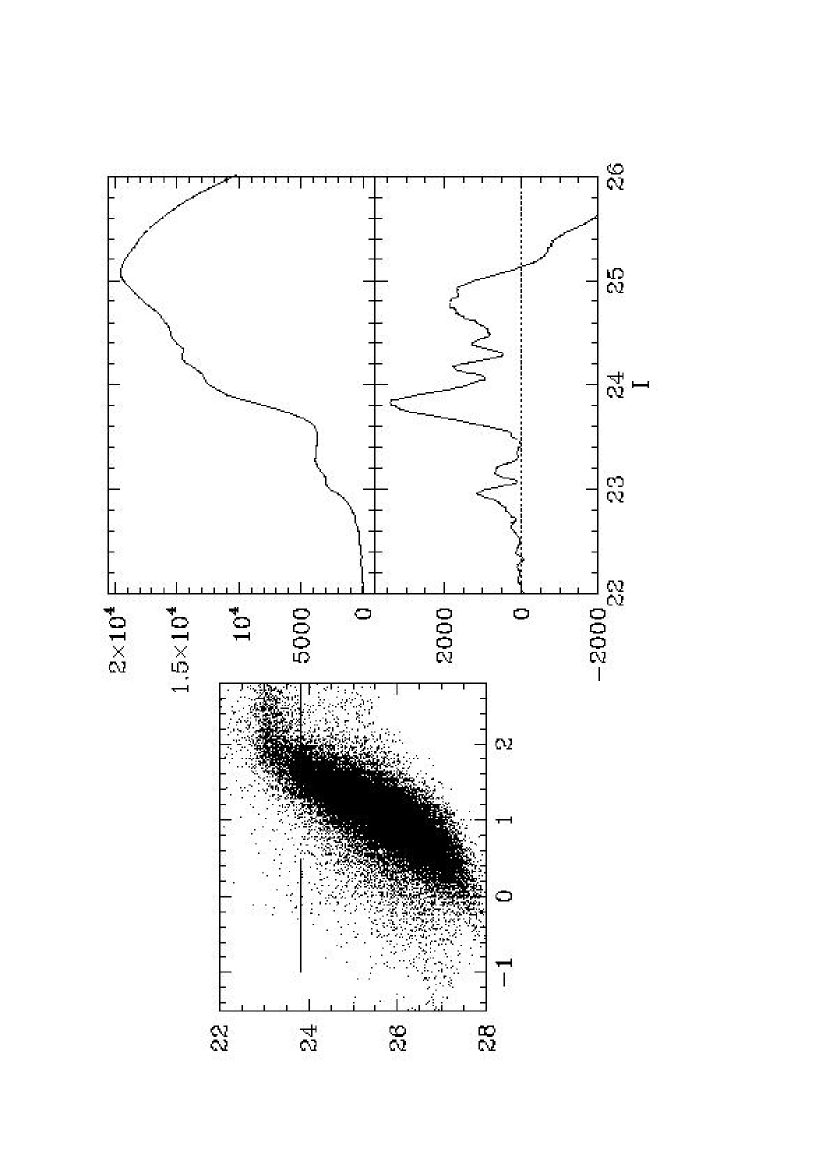
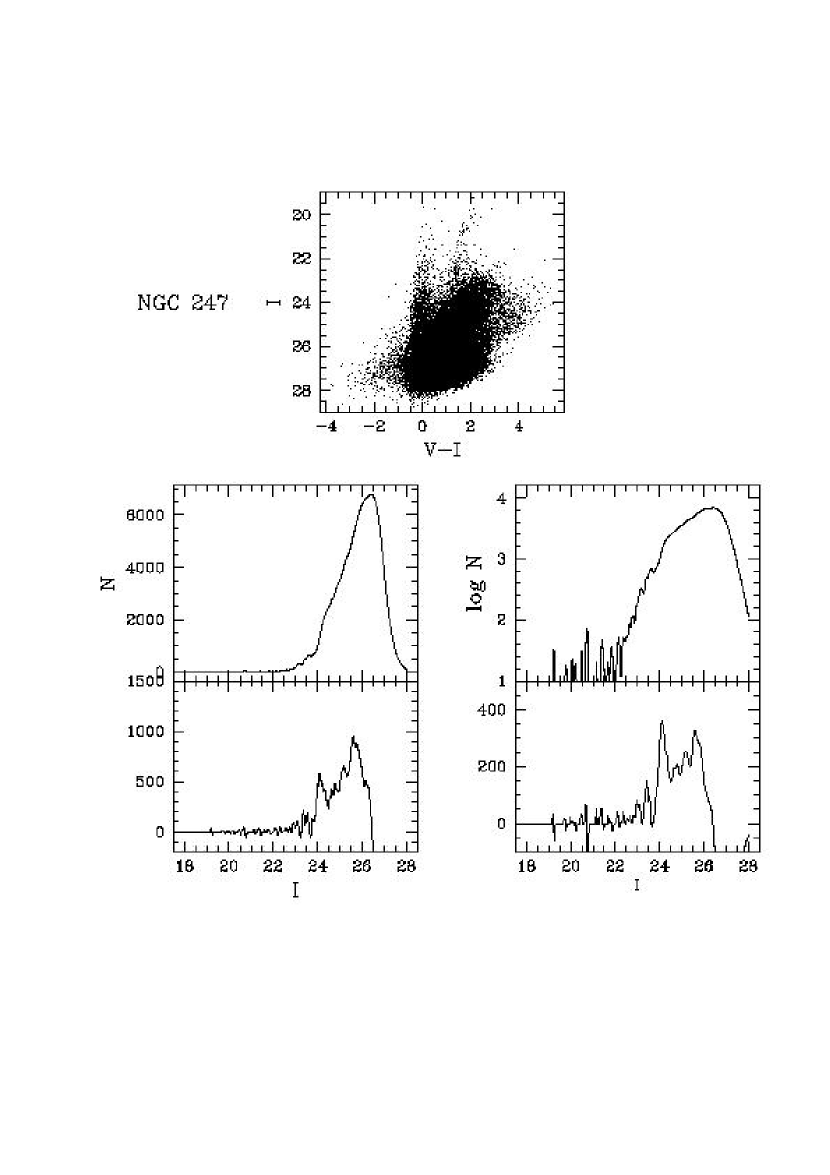
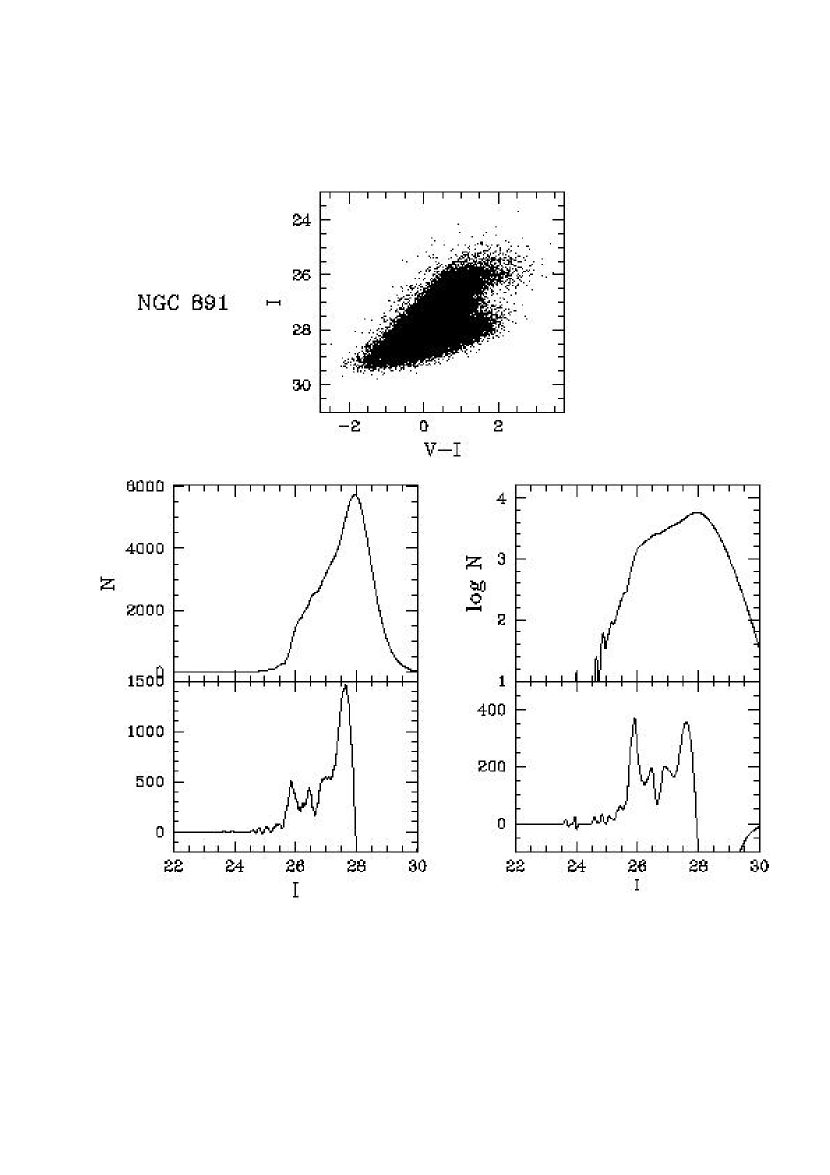
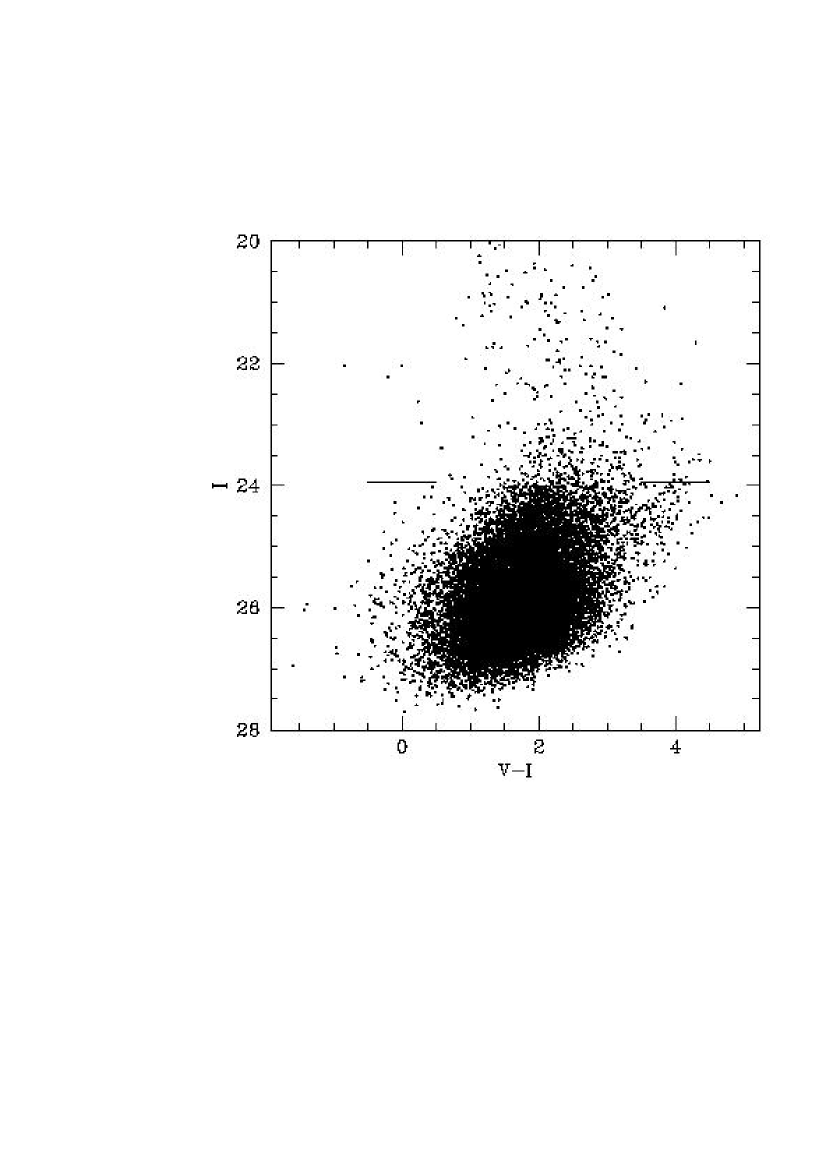
The sample for this section was drawn from those galaxies within 10 Mpc with infrared photometry, distance estimates, and 21 cm data cataloged by Aaronson et al. (1982) and with V & I imaging in the Hubble Space Telescope data archive (Table 1). These images were downloaded and photometry carried out with the DAOPHOT software of Stetson (1987). Point spread functions (PSFs) supplied by Stetson for the H0 Key Project were employed (Kennicutt, Freedman, & Mould, 1995) for WFPC2 data. For ACS data we used PSFs constructed from the images themselves. The ALLSTAR program was run twice to obtain as deep a starlist as possible. Areas of the galaxy with strong Population I signatures were edited out. Aperture corrections were made and color magnitude diagrams (CMDs) were calibrated and corrected for charge transfer effects (CTE) following Dolphin111 http://purcell.as.arizona.edu/wfpc2_calib (2000). ACS data were calibrated as described by Sirianni et al. (2005) and corrected for CTE using the standard algorithm222http://www.stsci.edu/hst/acs/performance/cte/cte_formula_acs_page.pdf. CMDs for NGC 247, 891, 4826, 4945, and 5253 are shown in figures 1–5.
For the detection of the TRGB in our target galaxies, we used the edge-detection method described in Sakai et al. (1997), and the results are recorded in Table 2. Reddening values in the table are those of Schlegel et al. (1998). Literature values of TRGB distance moduli are from Karachentsev et al. (2003) and Karachentsev (2005). We have preferred our value of TRGB, I = 24.10 to that of Davidge (2006), whose measurement of i′ = 24.5 0.1 can be transformed to I = 24.03, using V–I = 1.6 and the formulae of Smith et al. (2002). Six galaxies in our sample have Cepheid distance moduli, and these are given in the last columns of Table 2.
3 Magnitudes and velocity widths
The principal sources of infrared and 21 cm data are Aaronson et al. (1982) and Sakai et al. (2000). For other galaxies we used isophotal magnitudes from the 2MASS Large Galaxy Atlas, transforming them with H – Hmk20fe = 0.27 0.03 mag, based on 123 galaxies in common. For NGC 4945 and 5102 we used 20% velocity widths from HIPASS (Meyer et al., 2004) and Tully (1988) respectively, correcting them for cosmology (1+z) and inclination. Following Sakai et al. (2000), we omitted the 3∘ additive term in the inclination adopted by Aaronson et al. (1982) and Tully (1988). Column (5) of Table 2 is the corrected infrared magnitude; column (6) is the corrected velocity width.
4 Calibration of the Tully-Fisher relation
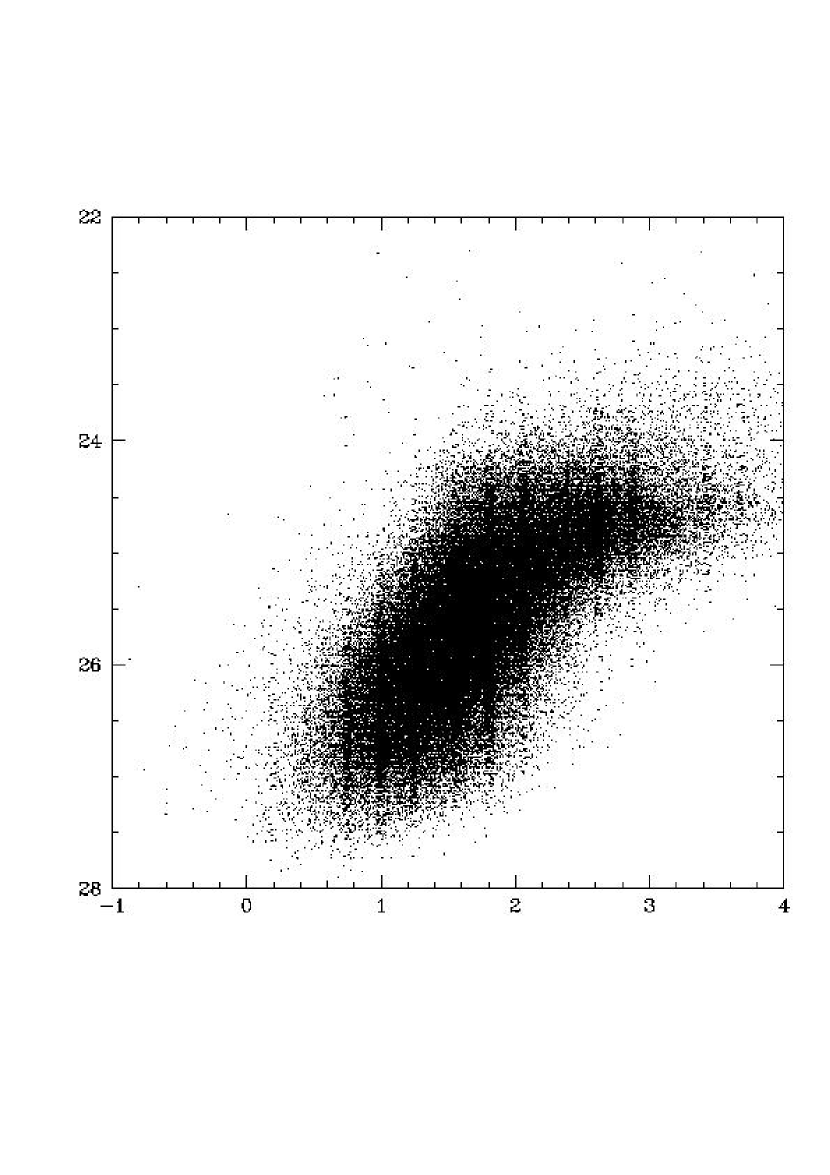
The Tully-Fisher relation for galaxies with TRGB distances is shown in Figure 6. The ordinate is the absolute H magnitude corrected for internal extinction following Sakai et al. (2000). To correspond in range of velocity width to that of the cluster galaxies to which the calibration will be applied (Aaronson et al., 1986), we ignore galaxies with 200 km s-1. The straight line in Figure 6 is the calibration by Sakai et al. (2000) using Cepheid distances. The mean difference in distance modulus between the 14 TRGB galaxies and the 21 Cepheid galaxies is 0.19 0.13 mag. Applying their Cepheid Tully-Fisher calibration, Sakai et al. (2000) found H0 = 67 3 10 km s-1 Mpc-1. With our TRGB Tully-Fisher relation applied to the same cluster data, we would obtain a 10% higher value, 73 5 km s-1 Mpc-1, where our quoted uncertainty is the statistical error only.
5 Discussion and conclusions
Sakai et al. (2000) obtained H0 = 71 4 7 km s-1 Mpc-1 from their multiwavelength Cepheid-based Tully-Fisher calibration. The largest term in the 7 km s-1 Mpc-1 systematic error is due to the distance of the Large Magellanic Cloud. The largest term in the absolute calibration of the TRGB (population II) distance scale is the uncertainty in MI,TRGB = –4.05 0.02 mag (Rizzi et al., 2007), associated with the absolute magnitude of the horizontal branch.
Our principal finding is that, within the 1.5 uncertainty, the mean difference of the distance moduli derived from Cepheids and from the TRGB magnitude for our sample of 14 galaxies is consistent with zero.
In addition, we conclude that the further steps to a more accurate Cepheid-independent value of H0 are (i) a larger sample of TRGB distances to galaxies which calibrate secondary distance indicators, (ii) multiwavelength photometry of these galaxies, and (iii) TRGB calibration of type Ia supernovae (Tammann et al., 2008b), surface brightness fluctuations, and the fundamental plane.
References
- Aaronson et al. (1982) Aaronson, M. et al. 1982, ApJS, 50, 241
- Aaronson et al. (1986) Aaronson, M. et al. 1986, ApJ, 302, 536
- Da Costa & Armandroff (1990) Da Costa, G. & Armandroff, T. 1990, AJ, 100, 162
- Dalcanton, Seth & de Jong (2005) Dalcanton, J., Seth, A. & de Jong, R. 2005, AJ, 129, 1331
- Davidge (2006) Davidge, T. 2006, ApJ, 641, 822
- Dolphin (2000) Dolphin, A. 2000, PASP, 112, 1397
- Ferrarese et al. (2001) Ferrarese, L. et al. 2001, ApJS, 128, 431
- Freedman et al. (2001) Freedman, W. et al. 2001, ApJ, 553, 47
- Garcia-Varela et al. (2008) Garcia-Varela, A. et al. 2008, astro-ph 0808.3327
- Gibson et al. (2000) Gibson, B. et al. 2000, ApJ, 529, 723
- Karachentsev et al. (2003) Karachentsev, I. et al. 2003, A&A, 404, 93
- Karachentsev (2005) Karachentsev, I. 2005, AJ, 129, 178
- Kennicutt, Freedman, & Mould (1995) Kennicutt, R., Freedman, W. & Mould, J. 1995, AJ, 110, 1476
- Lee et al. (1990) Lee, Y.-W., Demarque, P., & Zinn, R. 1990, ApJ, 350, 155
- Macri et al. (2006) Macri, L. et al. 2006, ApJ, 652, 1113
- Madore & Freedman (1999) Madore, B. & Freedman, W. 1999, ASP Conference Series, 167, 161
- Meyer et al. (2004) Meyer, M. et al. 2004, MNRAS, 350, 1195
- Mould et al. (2000) Mould, J. et al. 2000, ApJ, 529, 786
- Rizzi et al. (2007) Rizzi, L. et al. 2007, ApJ, 661, 815
- Romaniello et al. (2008) Romaniello, M. et al. 2008, astro-ph 0807.1196
- Sakai et al. (2004) Sakai, S., Ferrarese, L., Kennicutt, R., & Saha, A. 2004, ApJ, 608, 42
- Sakai et al. (1997) Sakai, S., Madore, B. & Freedman, W. 1997, ApJ, 461, 713
- Sakai et al. (2000) Sakai, S., et al. 2000, ApJ, 529, 698
- Salaris & Cassisi (1997) Salaris, M. & Cassisi, S.1997, MNRAS, 289, 406
- Salaris et al. (2002) Salaris, M., Cassisi, S., & Weiss, A., PASP, 114, 375
- Sandage et al. (2007) Sandage, A., Tammann, G. 2007, ARA&A, 44, 93
- Schlegel et al. (1998) Schlegel, D. et al. 1998, ApJ, 500, 525
- Sirianni et al. (2005) Sirianni, M. et al. 2005, PASP, 117, 1049
- Smith et al. (2002) Smith, J. Allyn et al. , AJ, 123, 2121
- Stetson (1987) Stetson, P. 1987, PASP, 99, 191
- Tammann et al. (2008a) Tammann, G., Sandage, A., & Reindl, B. 2008a, ApJ, 679, 52
- Tammann et al. (2008b) Tammann, G., Sandage, A., & Reindl, B. 2008b, astro-ph 0806.3018
- Tully (1988) Tully, R.B. 1988, Nearby Galaxies Catalogue, Cambridge: CUP.
| Galaxy | Archive dataset | Filter |
|---|---|---|
| NGC 247 | j9ra78kqq, ksq, kuq, kwq | F606W, F814W |
| NGC 891 | j8eo01e9q, edq, ehq, eyq, f3q, f7q, g0q | F606W |
| j8eo02ofq, owq, p1q, p5q, q0q, q5q, q9q | F814W | |
| NGC 4826 | j9ov16uaq, ubq, udq, ufq | F606W, F814W |
| NGC 4945 | u6ep1101r, 1102r, 1103r …1109r, | |
| 110ar, 110br, 110cr | F606W, F814W | |
| NGC 5253 | j9k501dbq, deq, dmq, doq | F555W, F814W |
| Galaxy | ITRGB | AI | (m-M)0 | H | (0) | Ref. | Ceph. mod. | Ref. |
|---|---|---|---|---|---|---|---|---|
| NGC 7793 | 23.95 | 0.22 | 27.78 | 7.89 | 255 | 5 | ||
| NGC 224 | 20.53 | 0.15 | 24.37 | 0.91 | 555 | 1 | 24.44 | a |
| NGC 247 | 24.10 | 0.03 | 28.12 | 7.69 | 233 | 2 | 27.80 | b |
| NGC 253 | 23.97 | 0.19 | 27.83 | 4.74 | 443 | 5 | ||
| NGC 598 | 20.91 | 0.08 | 24.71 | 4.38 | 249 | 1 | 24.64 | a |
| NGC 891 | 25.90 | 0.13 | 29.82 | 6.84 | 483 | 2 | ||
| NGC 3031 | 23.91 | 0.16 | 27.70 | 4.38 | 524 | 1 | 27.80 | a |
| NGC 3351 | 25.92 | 0.05 | 29.92 | 7.45 | 385 | 1,6 | 30.01 | a |
| NGC 3621 | 25.38 | 0.16 | 29.26 | 7.40 | 316 | 1 | 29.13 | a |
| NGC 4244 | 28.26 | 8.75 | 221 | 3 | ||||
| NGC 4826 | 24.64 | 0.08 | 28.61 | 6.10 | 376 | 2 | ||
| NGC 4945 | 23.95 | 0.10 | 27.90 | 5.16 | 382 | 2,4 | ||
| NGC 5102 | 27.66 | 7.57 | 235 | 3,4 | ||||
| NGC 5253 | 23.82 | 0.11 | 27.76 | 8.96 | 103 | 2 | 27.61 | a |
| IC 5052 | 24.84 | 0.10 | 28.80 | 10.24 | 211 | 7 |