11email: pgrosbol@eso.org 22institutetext: Instituto de Física, Univ. Federal do Rio Grande do Sul, Av. Bento Gonçalves 9500, 91501-970 Porto Alegre, RS, Brazil
22email: dottori@ufrgs.br
Statistics of young starforming complexes in spiral galaxies using NIR photometry ††thanks: Based on observations collected at the European Southern Observatory, Chile; program: ESO 68.A-0085 and 69.A-0021
Abstract
Aims. Very young stellar clusters and cluster complexes may be embedded in dust lanes along spiral arms in disk galaxies and escape detection in visual bands. Observations in the near-infrared K-band offer an almost unbiased view of such clusters or complexes due to the small attenuation by dust at this wavelength. The objective is to determine their population size, absolute K-band magnitude distribution above the limiting magnitude imposed by the data, and location relative to the spiral pattern in disk galaxies.
Methods. All slightly extended sources were identified on deep K-band maps of 46 spiral galaxies reaching at least K=20.3 mag arcsec-2 at a signal-to-noise level of 3. The galaxies had inclination angles and linear resolutions pc with seeing better than . The sample includes both barred and normal spirals with a wide spread in types. We also analyzed J- and H-band colors for 4 galaxies for which such images were available. An apparent magnitude limit of K = 19 mag was used for the sources analyzed in order to avoid marginal detections. Furthermore, we derived the source distributions of magnitudes and relative locations with respect to the spiral patterns.
Results. Almost 70% (15/22) of the grand-design spiral galaxies show significant concentration of bright K-band knots in their arm regions corresponding to 30% (15/46) of the full sample. Color-color diagrams for the 4 spirals with JHK photometry suggest that a significant fraction of the diffuse sources found in the arms are complexes of young stellar clusters with ages 10 Myr and reddened with several magnitudes of visual extinction. The brightest knots reach an absolute K-band magnitude MK of -15.5 mag corresponding to stellar clusters or complexes with total masses up to at least 105 M⊙. Brightest magnitude and number of knots correlate with the total absolute magnitude of the host galaxy. More knots are seen in galaxies with high far-infrared flux and strong two-armed spiral perturbations. The bright knots constitute up to a few percent of the total K-band flux from their parent galaxy and account for a star formation rate of 1 M⊙ yr-1 for the brightest grand-design spiral galaxies.
Key Words.:
galaxies: spiral – galaxies: structure – galaxies: star clusters – infrared: galaxies – techniques: photometric1 Introduction
The present star formation rate (SFR) in the local Universe is important as a part of the history of galaxy build-up and as a means of comparison for the study of star formation at higher redshifts. For spiral galaxies, significant variation is observed as a function of Hubble type and luminosity class. Extinction by dust in spiral arms makes it difficult to get a full census from observations in visual bands, whereas near-infrared (NIR) colors offer a much higher transparency.
In a study of the NIR K-band images of spiral galaxies, Grosbøl & Patsis (1998) noticed that several grand-design spirals have bright knots along their arms, suggesting that such knots are related to the spiral structure. Young stellar clusters may expel gas left over after their main star formation phase and may then experience violent relaxation (Bastian & Goodwin 2006). This could lead to their destruction on time scales of a few tens of Myr (Goodwin & Bastian 2006). The knots are marginally resolved, suggesting sizes of less than 100 pc. Unbound stellar clusters will exceed this size due to diffusion of stellar orbits within 50 Myr (Wielen 1977). These points indicate that the knots are dynamically young.
Patsis et al. (2001) studied such knots in two galaxies using narrow-band filters in the K-band and concluded that the major contribution to their K-band fluxes comes from continuum radiation. In many cases these knots are embedded in dust lanes and invisible in visual bands. Taking advantage of the mutual alignment of eight of these knots along the southern arm of NGC 2997, Grosbøl et al. (2006) obtained spectroscopy in the J- and K-bands detecting hydrogen Brγ in emission, undoubtedly demonstrating that the knots are HII regions deeply enshrouded in dust, confirming the results previously suggested by Patsis et al. (2001). They also explored the relative position of the knots with respect to the ridge of the K-band arm to derive kinematic parameters of the density wave to constrain the star formation regime and ages of the knots.
Their absolute luminosity and Brγ emission suggest they are very young, massive stellar complexes that would host a significant fraction of the heaviest stars formed in a galaxy. Thus, the statistics of them in spiral galaxies may imply SFR of stars on the upper part of the initial mass function (IMF) and rate of supernovae type II in such systems. The low attenuation by dust in the K-band makes it possible to obtain almost complete samples while many clusters and complexes may be missed on visual images due to heavy obscuration in dust lanes. To estimate internal mean physical properties of these NIR starforming knots, we used the theoretical models starburst99 by Leitherer et al. (1999, hereafter SB99). The rate of star formation, derived from NIR data, may complement or correct the one derived from the observations of optical HII regions, as done by SINGG (Meurer et al. 2006; Hanish et al. 2006). Indeed, due to the dust absorption, few of the NIR knots would contribute significantly to the Hα emission line, used by SINGG to estimate the star formation rate in their sample of galaxies.
Thus, the knots we are studying in this paper may constitute the first phases of the star formation that escape detection in optical bands, or might well be the dusty, densest part of large HII region complexes. We present statistics of such knots detected on K-band images of 46 spiral galaxies. For the four galaxies observed in the J-, H-, and K-bands, we also compared their colors with simple SB99 models using different star formation scenarios.
2 Data and reductions
The current sample of galaxies was selected from two data sets containing deep, high-resolution K-band images of nearby spiral galaxies. The first set, designated A, was observed to study the morphology of bar and spiral perturbations in disk galaxies through K-band imaging (Grosbøl et al. 2004), while the second set (B) with both H- and K-band maps included galaxies in which supernovae Ia had recently been observed. Some galaxies in the second set also had J-band images and were designated with (C). All observations were made with SOFI at the NTT telescope at ESO, La Silla, using a Rockwell Hg:Cd:Te 10241024 detector with a pixel size of 0.29″. The preliminary sample was 95 galaxies, selecting only targets with inclination angles ° and seeing ″.
General data for the galaxies were taken from the Third Reference Catalog (de Vaucouleurs et al. 1991, hereafter RC3) such as types, systemic velocities, total magnitudes, and radio fluxes. Distances were computed from the velocity VGSR, corrected to the Galactic Standard of Rest, using a Hubble constant of 75 km sec-1 Mpc-1.
The final sample was restricted to galaxies with distances D Mpc, to avoid galaxies in which individual stars could be resolved, absolute blue magnitudes M mag, to exclude dwarf galaxies, surface brightness at a signal-to-noise (S/N) of 3 for the K-band maps mag arcsec-2 , and a linear resolution s pc. The 46 spiral galaxies in the sample are listed in Table 1, which also gives their Hubble type and luminosity class. The Hubble types listed are taken from RC3 where the two first letters give the main morphology with SA for ordinary spirals, SB for barred systems, and SX for intermediate or weakly barred galaxies. The third character indicate the bar/spiral interface, whereas the final number gives the numeric type T going from (1) for early-type spirals to (9) for late-type systems. The sample is slightly biased against barred spirals with 18 SA, 21 SX, and only 7 SB galaxies due to the definition of the two original data sets. Eight galaxies (NGC 1068, NGC 3351, NGC 3368, NGC 3627, NGC 4321, NGC 4535, NGC 4579, and NGC 5247) are in common with the BIMA SONG survey (Helfer et al. 2003), while 6 galaxies (NGC 1566, NGC 3351, NGC 3621, NGC 3627, NGC 4321, and NGC 4579) are also in the Spitzer SINGS sample (Kennicutt et al. 2003).
| Galaxy | Type | L | Set | FWHM | D | s | |
|---|---|---|---|---|---|---|---|
| NGC 157 | SXT4 | 1.8 | A | 0.7 | 21.1 | 23.1 | 80 |
| NGC 210 | SXS3 | 1.1 | A | 0.9 | 20.7 | 22.4 | 96 |
| NGC 289 | SBT4 | 2.2 | B | 1.0 | 20.8 | 21.5 | 99 |
| NGC 578 | SXT5 | 2.4 | A | 0.6 | 20.7 | 21.5 | 61 |
| NGC 685 | SXR5 | 4.0 | A | 0.8 | 20.7 | 16.6 | 65 |
| NGC 895 | SAS6 | 1.9 | A | 0.6 | 20.8 | 30.6 | 95 |
| NGC 1068 | SAT3 | 2.3 | A | 0.9 | 20.7 | 8.2 | 34 |
| NGC 1084 | SAS5 | 3.1 | B | 0.8 | 20.9 | 18.5 | 76 |
| NGC 1087 | SXT5 | 5.5 | A | 0.8 | 20.7 | 20.3 | 74 |
| NGC 1187 | SBR5 | 2.1 | B | 0.9 | 20.8 | 17.7 | 73 |
| NGC 1255 | SXT4 | 3.3 | A | 0.8 | 21.0 | 21.5 | 85 |
| NGC 1300 | SBT4 | 1.1 | B | 0.8 | 20.7 | 19.9 | 80 |
| NGC 1350 | SBR2 | 3.0 | B | 0.7 | 20.7 | 23.6 | 82 |
| NGC 1357 | SAS2 | - | A | 0.5 | 20.7 | 25.8 | 66 |
| NGC 1365 | SBS3 | 1.3 | B | 0.8 | 21.1 | 20.5 | 85 |
| NGC 1371 | SXT1 | - | A | 0.8 | 21.1 | 18.3 | 67 |
| NGC 1398 | SBR2 | 1.1 | B | 0.8 | 20.5 | 17.4 | 64 |
| NGC 1425 | SAS3 | 3.2 | B | 1.0 | 20.9 | 18.6 | 89 |
| NGC 1566 | SXS4 | 1.7 | B | 0.9 | 20.9 | 17.6 | 76 |
| NGC 2775 | SAR2 | - | A | 0.6 | 20.8 | 16.3 | 50 |
| NGC 2855 | SAT0 | - | A | 0.7 | 20.9 | 23.0 | 81 |
| NGC 2935 | SXS3 | 2.1 | B | 0.6 | 20.4 | 27.6 | 85 |
| NGC 2997 | SXT5 | 1.6 | A | 0.8 | 20.9 | 11.6 | 43 |
| NGC 3351 | SBR3 | 3.3 | B | 0.6 | 20.4 | 9.0 | 28 |
| NGC 3368 | SXT2 | 3.4 | B | 0.6 | 20.4 | 10.6 | 33 |
| NGC 3370 | SAS5 | 3.4 | B | 0.6 | 20.4 | 16.0 | 45 |
| NGC 3389 | SAS5 | 4.2 | B | 0.7 | 20.4 | 16.0 | 51 |
| NGC 3621 | SAS7 | 5.8 | B | 0.7 | 20.5 | 7.0 | 22 |
| NGC 3627 | SXS3 | 3.0 | B | 0.7 | 20.5 | 8.6 | 30 |
| NGC 3810 | SAT5 | 2.4 | B | 0.9 | 20.5 | 12.2 | 55 |
| NGC 4030 | SAS4 | 1.6 | A | 0.9 | 20.7 | 18.0 | 75 |
| NGC 4321 | SXS4 | 1.1 | B | 0.9 | 20.5 | 20.5 | 94 |
| NGC 4535 | SXS5 | 1.6 | B | 0.6 | 20.5 | 25.2 | 71 |
| NGC 4579 | SXT3 | 3.1 | B | 1.0 | 20.5 | 19.6 | 94 |
| NGC 4941 | SXR2 | 3.4 | A | 1.0 | 20.8 | 13.6 | 65 |
| NGC 4965 | SXS7 | 4.7 | A | 0.7 | 20.6 | 28.3 | 98 |
| NGC 4981 | SXR4 | 3.4 | A | 0.7 | 20.3 | 21.3 | 75 |
| NGC 5085 | SAS5 | 2.7 | C | 0.8 | 20.6 | 24.4 | 89 |
| NGC 5134 | SAS3 | 4.7 | B | 0.8 | 20.6 | 21.8 | 87 |
| NGC 5247 | SAS4 | 1.8 | C | 0.7 | 20.6 | 16.7 | 60 |
| NGC 5364 | SAT4 | 1.1 | C | 0.7 | 20.6 | 16.2 | 57 |
| NGC 5668 | SAS7 | 4.3 | B | 0.8 | 20.6 | 21.1 | 77 |
| NGC 5861 | SXT5 | 2.2 | C | 0.7 | 20.6 | 24.8 | 88 |
| NGC 6384 | SXR4 | 1.1 | B | 0.8 | 20.5 | 23.8 | 87 |
| NGC 7213 | SAS1 | - | A | 0.9 | 20.3 | 23.6 | 99 |
| NGC 7418 | SXT6 | 3.5 | A | 0.8 | 20.7 | 19.3 | 78 |
All observations were done with the same template, which included a jitter pattern on the target with offsets of around 10″ interleaved with sky exposures around 10′ from the galaxy. Sky fields were explicitly selected not to contain bright stars. Typical exposure times on target were 4m, 4m, and 10m for the J-, H-, and K-bands, respectively, whereas some galaxies in data set (A) were exposed longer. For a few galaxies with major axes larger than 5′ several SOFI fields were mosaiced together. The reductions of the frames followed the procedure described by Grosbøl et al. (2004) including determination of sky projection parameters. Depth, expressed as , and seeing of the final maps are given in Table 1.
Photometric calibration was done by observing standard stars in the list of Persson et al. (1998) several times during each night. The error of the K-band zero-point for galaxies from data set (A) was around 0.07 mag, while the remaining galaxies had errors of 0.03 mag. Typical errors for the H- and J-band were estimated to 0.03 mag. For the four galaxies with J-, H-, and K-band observations, the location of foreground stars in the (J-H)–(H-K) diagram can be used to check zero-point errors as they have a characteristic shape with a relative narrow range (see Fig. 5). Comparing their location with that of the local main-sequence and giant stars, color offsets were estimated to (J-H) -0.07 mag and (H-K) 0.06 mag. These corrections were applied to the colors, while the K-band magnitudes were not modified as the origin of the color offsets are unclear (possibly a zero-point error in the H-band photometry). The positional errors were on average 0.5″ and the actual detector pixel size estimated to be 0.288″.
3 Detection of sources
The maps of the galaxies have linear resolutions in the range of 20-100 pc, which in most cases are not sufficient to resolve individual stellar clusters. The majority of sources detected in the images are therefore more likely to be associated to complexes of clusters rather than single discrete clusters. To check this issue, the Hubble Space Telescope archive was searched for ACS/WFC frames of the galaxies taken with the F814W filter. Reasonable deep exposures in 7 galaxies (i.e. NGC 1068, NGC 1300, NGC 3368, NGC 3370, NGC 3621, NGC 3810, and NGC 6384) were identified with linear scales in the range of 2-5 pc pixel-1. The comparison of our K-band images with the ACS/WFC, with more than 10 times better resolution, suggests that the non-stellar sources detected are a mixture of both individual stellar clusters and more complex aggregates of starforming regions sometimes associated with ionized gas. Several objects seen on the K-band frames had no obvious counterpart on the ACS/WFC frames possibly due to the significant extinction by dust in the F814W filter.
The SExtractor program v.2.5 (Bertin & Arnouts 1996) was applied to the frames to identify all significant sources in the fields. A detection threshold of 2.5 times local noise and a minimum area for objects of 5 pixels were used. No internal digital filtering was selected, and the background mesh was reduced to 16 so as to better follow variation in the arm regions of the galaxies. Location and basic photometric parameters for the sources as detected on the K-band images were saved with the galaxy–star classifier class_star. Aperture photometry was then performed on all frames using the positions derived from SExtractor and a diameter of 3.0″. This procedure gave significant smaller scatter in the color indices compared to an independent search on frames in the other colors since SExtractor often yields slightly different source coordinates for each frame. Aperture magnitudes were used since isophotal magnitudes depend too strongly on the exact inclusion of pixels within the isophote on different color maps and therefore display a wider spread in color indices.
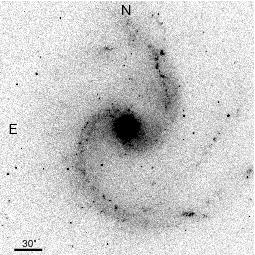
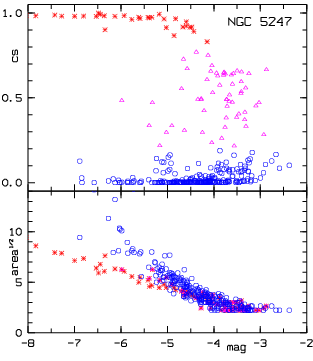
NGC 5247 (see Fig. 1 for a K-band image) was selected to illustrate the results since all three NIR colors were available, and its morphology provides a clean view of its spiral structure. SExtractor found a total of 337 sources, which fulfilled the criteria on the K-band image. The galaxy–star classifier class_star (denoted by cs), which ranges from 0.0 for diffuse, extended sources to 1.0 for stellar type objects, is shown as a function of the internal aperture magnitude in the upper panel of Fig. 2, while the lower one displays the square root of the number of pixels included in the source. A linear relation between magnitude and square root of the area is expected for stellar type objects with Gaussian profiles (as seen in Fig. 2). More diffuse sources have larger areas for the same magnitude and scatter above the relation for stars.
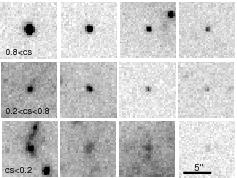
Depending on the galaxy–star classifier, the sources were divided into three categories, namely: star-like objects with 0.8cs, compact sources in the range 0.2cs0.8, and diffuse targets with cs0.2. These are illustrated on Fig 3 where cutouts around typical sources in the NGC 5247 field (see Fig 1) are presented. The subframes are arranged in three rows, one for each category, and show brighter sources to the left. The linear scale of NGC 5247 is 81 pc arcsec-1 while the resolution corresponds to 60 pc. This suggests that most of the extended sources associated to the galaxy are complexes of clusters and/or HII regions rather than individual clusters.
The sources detected in the fields can generally be placed in three groups, namely objects associated to the galaxies, foreground stars, and background galaxies. To deal with foreground star contamination, we used the synthetic model of structure and evolution of the Milky Way (Robin et al. 2003, 2004), which allows an estimate of the amount of stars up to a certain brightness limit expected in a given sky direction. We crosschecked this number for each galaxy with the number of star-like objects (0.8cs) in the same field furnished by SExtractor. Since the galaxies in our sample are at reasonably high galactic latitudes, both numbers agree closely when adopting a mean Milky Way extinction model. Thus, we concluded that foreground stars could safely be rejected by relying on the SExtractor classification.
The number of background galaxies expected for a given field was estimated with the program GalaxyCount developed by Ellis & Bland-Hawthorn (2006). Within a galactic disk of 10 arcmin2, 449 galaxies brighter than K = 19 mag are expected. The brighter part of the stellar cluster is less contaminated because only 62 galaxies with K 17 mag are estimated. These values are average estimates and do not take the existence of clusters of background galaxies into account in the field. This was checked by visual inspection of all K-band frames. Background clusters were found in the fields of NGC 1255, NGC 2775, NGC 3389, and NGC 5668 but in all cases well outside the disk of the galaxies. To reduce the possible contamination by background galaxies, only sources within the disk of the galaxies were considered. The disk radius was estimated on the K-band frames as the higher value of either the outer extent of the spiral pattern or the radius within which 90% of galaxy’s K-band luminosity was emitted.
The globular cluster systems of the galaxies themselves may also contribute to the sample of stellar clusters. Since their expected, average absolute magnitude is M mag, they will not represent a major contribution. The mean color indices for 31 Milky Way clusters, including all the Messier plus Omega Cen and 47 Tuc, are H-K = 0.240.06 and J-H = 0.690.09, which are just above the stellar sequence (see Fig. 5).
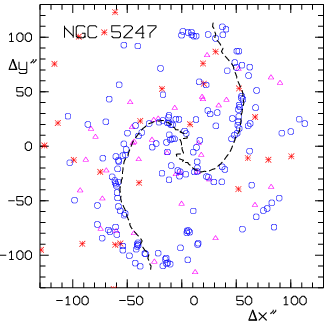
The spatial distribution of the three source categories, differentiated according to the SExtractor criterion, is shown in a projection corresponding to that of the disk of NGC 5247 (see Fig. 4) where the locations of the spiral arms in the K-band are also indicated by dashed lines as defined by the azimuthal phase of the m=2 Fourier component. Position angle PA = 110° and inclination angle IA = 34° for NGC 5247 were derived from the K-band image as described by Grosbøl et al. (2004) where the value of PA differs significantly from the estimate of 20° given by RC3. Whereas sources with cs0.2 are uniformly distributed over the field, the more diffuse sources are strongly concentrated in the arm regions. This suggests that most of these sources are complexes of young stellar clusters, although some of the larger ones could also be background galaxies. Sources with an area of more than 100 pixels were excluded to reduce the influence of background galaxies and complex starforming regions, which may be grouped together by the detection algorithm. For NGC 5247, this limit corresponds to a circle with a diameter of 265 pc (i.e. 3.3″).
4 Color distribution
The (H-K)–(J-H) color-color diagrams could be calculated for NGC 5247, NGC 5086, NGC 5364 and NGC 5861 and are shown in Fig. 5. To analyze the diagrams, several SB99 models were computed with upper mass limit Mu = 30 M⊙, a Salpeter IMF, and solar metallicity. Models with both continuous or bursty star formation were calculated up to 40 Myr. In Fig. 5, representative evolutionary tracks for one continuous and one instantaneous model are drawn with the standard reddening vector using a galactic absorption law. Both evolutionary tracks start around (0.5, 0.2) and evolve to bluer (J-H) and (H-K) colors. After the appearance of the red super-giants (RSG), they redden again in (J-H), while (H-K) almost remains the same irrespective of the model type.
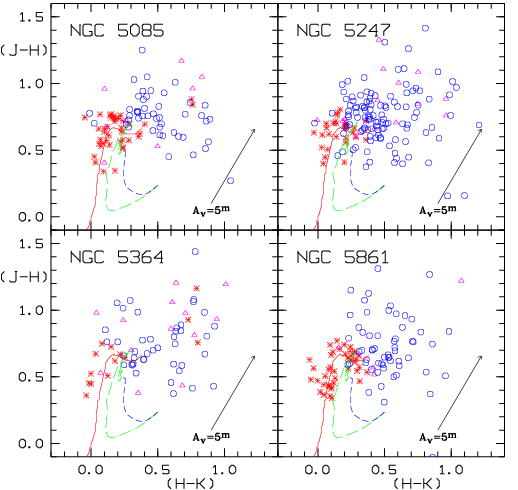
Extended sources occupying the upper left or lower right corners of the color-color diagrams cannot be explained by the models, neither by different star formation histories nor by standard extinction. Composed colors with (J-K)2 can be explained by the presence of C-stars (Dottori et al. 2005), which could indicate that such clusters are older than 1 Gyr. The majority of the condensations may well be young stellar complexes in different stages of evolution with different degrees of internal reddening, from zero age HII regions on, up to 10-20 Myr old complexes. The position of the condensations with regard to the models indicates that a substantial amount of dust (i.e. AV in the range 2-7 mag) accompanies their evolution during this phase of their lives. Because the measure of dust absorption relies on colors integrated over an entire complex, significant internal variations are expected where some inner parts may even be obscured in the K-band. The outliers amount to a few percent of the samples, with NGC 5247 having slightly more, and may also represent gross errors due to crowding or matching of sources from different bands.
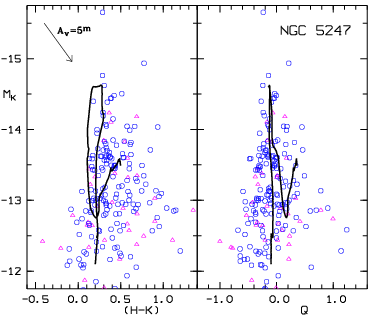
The color-magnitude diagrams for NGC 5247 are given in Fig. 6 where MK is shown as a function of (H-K) and a reddening-corrected index Q = (H-K) - 0.59(J-H). This reddening correction corresponds to standard galactic dust extinction for a screen model (Rieke & Lebopsky 1985) and will take into account neither different dust properties nor complex dust-star geometry in starforming regions (Witt et al. 1992; Pierini et al. 2004). The evolution track of a typical SB99 model with instantaneous star formation and total mass of 104 M⊙ is overlayed for reference in Fig. 6. Typical errors in (H-K) and Q are in the range of 0.2-0.3 mag for MK=-13 mag. The (H-K) colors scatter redwards of the SB99 model tracks (except for some faint sources with larger errors) indicating strong attenuation by dust even at NIR wavelengths. In the MK–(H-K) diagram, all the points to the right of the evolutionary track can be explained with reddening (see reddening arrow in Fig. 6) which is not the case for the ‘reddening free’ diagram. This most probably indicates that the screening extinction model is not correct, and dust is mixed with gas and stars in a more complex way in most of these cases (Witt et al. 1992). Sources with (H-K)0.0 are too blue compared to the models and cannot be explained by dust reddening. These objects can be blue background galaxies, quasars, or sources with significant non-thermal radiation. The majority of extended sources (cs0.8) in NGC 5247, considering problems in reddening corrections, are compatible with stellar clusters or complexes with total masses up to 5104 M⊙ using bursty SB99 models (see Fig. 6). Continuous models give similar results with slightly higher Q values. It is not possible to distinguish between the two models based only on broad band colors but spectroscopic studies suggest a continuous formation is more likely (Grosbøl et al. 2006).
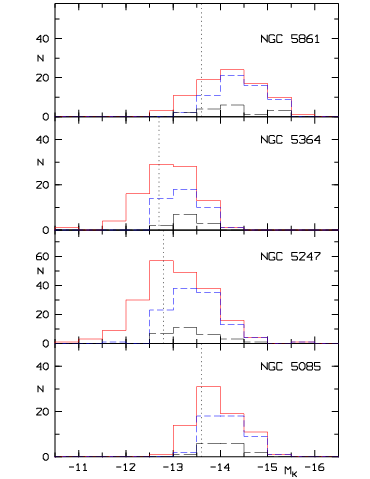
The distribution of absolute K-band magnitudes, MK, for extended sources is shown in Fig. 7 for the four galaxies with JHK photometry. For each galaxy, the histograms for all extended sources identified are given with an indication of the limiting magnitude for which the estimated error is 0.1 mag. Similar diagrams for the full sample of galaxies are given in the appendix available on-line. In Fig. 7, the distribution of diffuse sources (cs0.2) and that of the youngest of these objects (0.0Q) are also displayed. There is a significant spread in the distribution of the brightest knots, which range up to almost -16 mag in MK. The material is not deep enough to show the full shape or size of the distributions. Thus, it is not possible to say whether the variation of the brightest knots is real or just associated to the population size in the galaxy. Although a falling frequency at the faint end of the distributions is suggested for some galaxies (see e.g. NGC 1365, NGC 2935, and NGC 5861), the limiting magnitude makes it impossible to make a general statement on the faint end of the distribution of clusters and complexes.
5 Spatial distribution
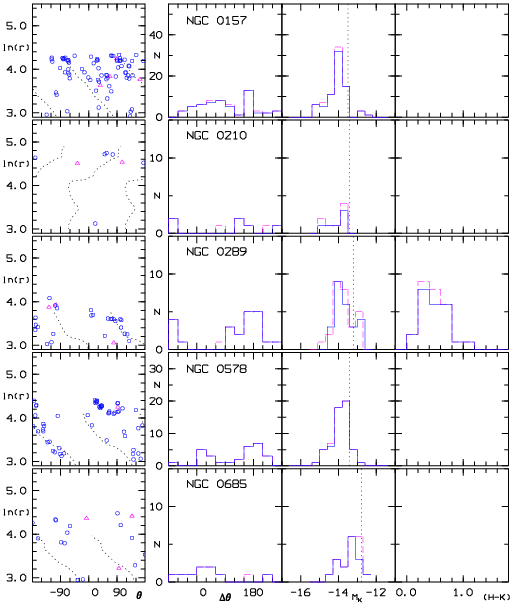
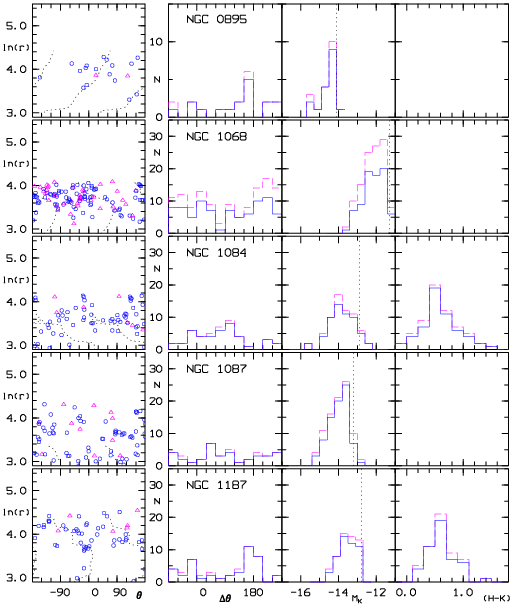
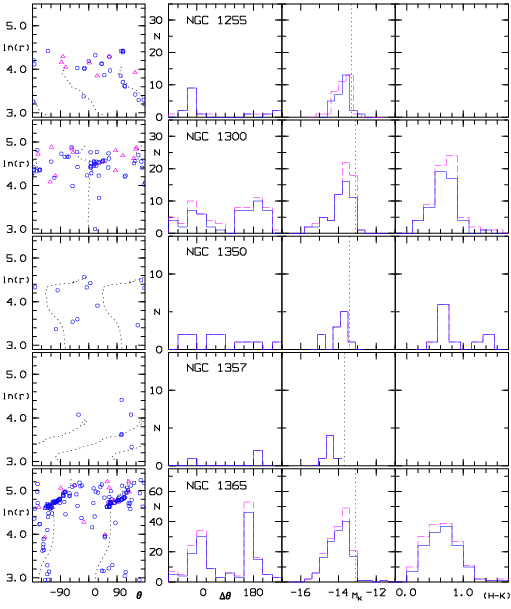
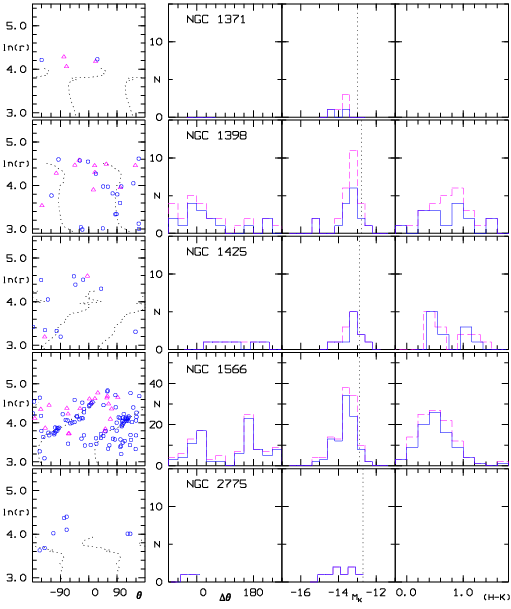
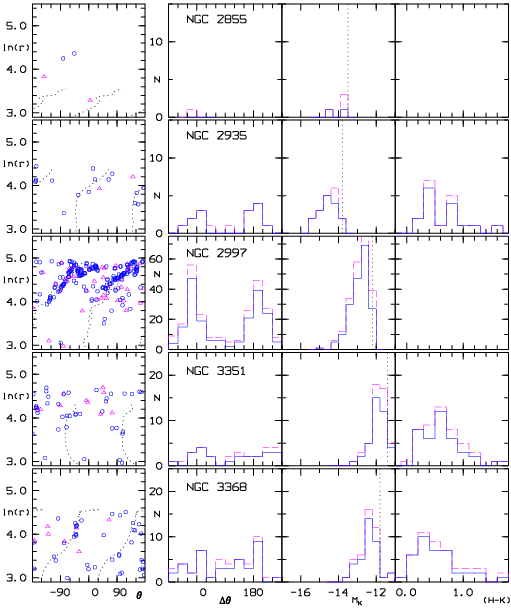
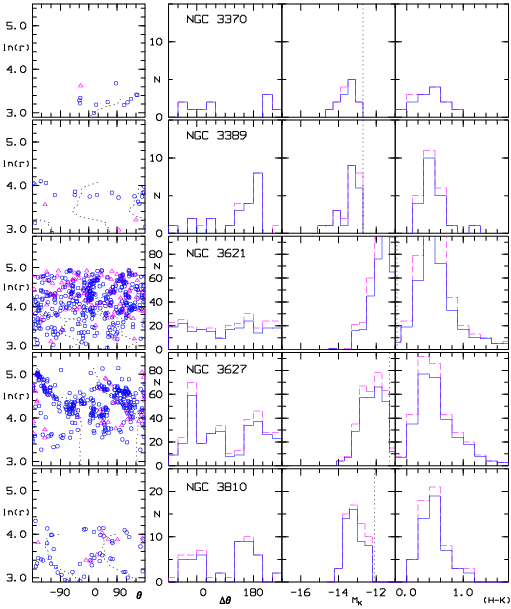
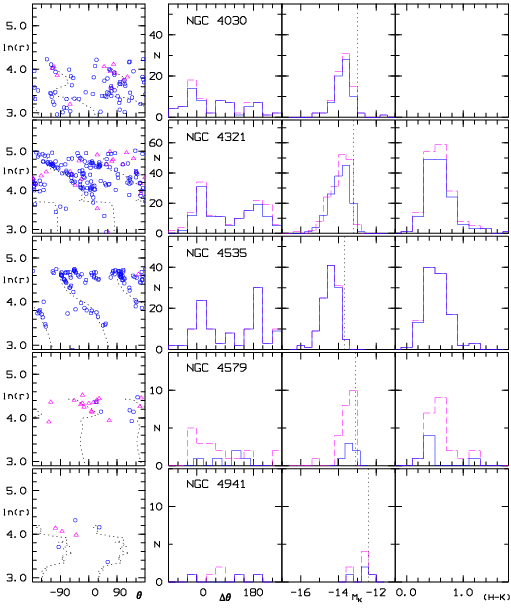
It is of interest to look at the locations of the knots relative to the spiral pattern in the host galaxy to find possible relations between the formation of massive stellar clusters and spiral perturbations. As an example, the spatial distribution of extended objects relative to the average, two-armed spiral perturbation in NGC 5247 is shown in Fig. 8. It gives the linear radius of the knots as a function of their phase difference from the m=2 intensity maximum as determined by a Fourier analysis of the azimuthal K-band intensity variation in the disk. The histogram of phase differences is displayed in the top diagram where compact and diffuse sources are shown separately. Similar diagrams for all galaxies in the sample are available in the online material (see Figs. 14-22).
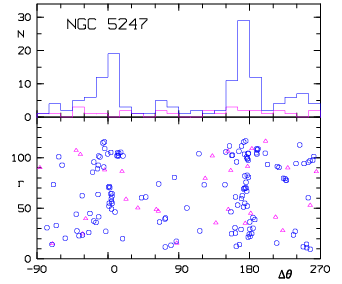
While the compact sources have a uniform distribution, the diffuse objects are concentrated in the spiral arms (i.e. = 0°and 180°) but still with a significant number of knots in the inter-arm regions. In this and several other grand-design galaxies, one can observe average phase offsets between the knots in the arms and the associated K-band spiral intensity maximum. Furthermore, differences in pitch angle between the string of knots along an arm and that of the K-band spiral may be seen in some galaxies (e.g. NGC 157, NGC 1566, NGC 2997, NGC 3627, and NGC 5247). This may be caused by systematic, radial offsets of large-scale shocks in the gas relative to the spiral potential minimum (Gittins & Clarke 2004), combined with the drift of material through the arms in a density wave scenario (Lin & Shu 1964; Roberts 1969). Although these offsets could provide information on the pattern speed of an underlying density wave, reliable estimates cannot be obtained without age information on the individual condensations.
When the diffuse sources are concentrated in arms, they seldom have an even distribution between the two arms. This suggests that perturbations other than bisymmetric ones are affecting the formation of the detected condensations. A scenario in which the perturbation and the perturbed material show different temporal phases or trigger an m=1 perturbation, like in Junqueira & Combes (1996), may well also be at work. Another option would be that the asymmetry is linked to the generation and destruction of molecular gas clouds in spiral arms if the time scale for these processes (Wada & Norman 1999) is comparable to that with which the gas encounters the arms.
On inspection of both visual images in Sandage & Bedke (1994) and our K-band maps, we find that 15 of the 22 grand-design spirals in our sample show a significant concentration of bright knots in their spiral arms. The remaining 7 grand-design galaxies show little or no concentration. They have relatively weak two-armed spiral perturbations, except NGC 895, which also has a relatively high number of interarm knots and therefore a smaller arm-interarm difference. Of the 24 galaxies classified as multiple armed spirals, only NGC 3389 has a significant increase of knots in one of its arms. This galaxy is a member of the Leo group and may have experienced recent interactions.
6 Statistics of knots
Characterizing the distributions of young stellar clusters and complexes in the individual galaxies, only knots within the disks and with cs0.2 were considered. The main problems are the contamination by older stellar clusters and background galaxies and the limiting magnitude of around K = 19 mag, which does not allow examination of the faint tail of the distributions. As an indicator of the most luminous stellar complex in a galaxy, the quantity M was defined as MK of the 5th brightest knot. Especially elliptical galaxies may be difficult to distinguish morphologically from stellar clusters or complexes. Assuming that 20-30% of the background galaxies are elliptical galaxies, counts presented in Sect. 3 suggest less than 6 of them brighter than the limiting magnitude of this sample (i.e. K = 19 mag) would be found in an area of 5 arcmin2 corresponding to the typical disk. Thus, the choice of the 5th brightest knot in the definition of M will avoid a strong bias due to such background galaxies with bright apparent magnitudes.
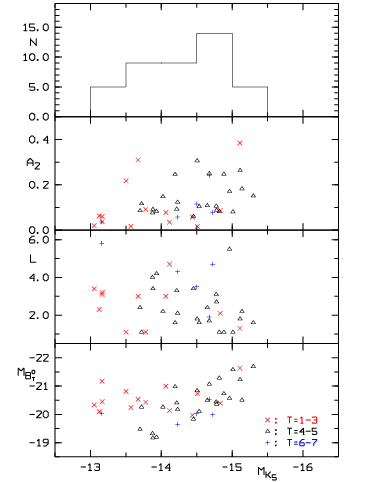
The distribution of M is shown in Fig.9 where correlations with absolute blue magnitude M, luminosity class L, and amplitude, A2, of the two-armed spiral pattern for the host galaxy are also given. The values of M and A2 are listed in Table 2. While absolute magnitude and luminosity class were taken from RC3, the amplitudes A2 were derived from the azimuthal m=2 Fourier component of the K-band maps as described by Grosbøl et al. (2004). The overall distribution of M ranges from the detection limit around -13.0 mag (depending on distance modulus) to a maximum close to -15.5 mag where early-type spirals occupy the fainter range. For later-type spirals (T3), M shows a clear correlation with the absolute magnitude of the host galaxy. Generally, brighter values of M are found for galaxies with luminosity class I-II and stronger spiral perturbations.
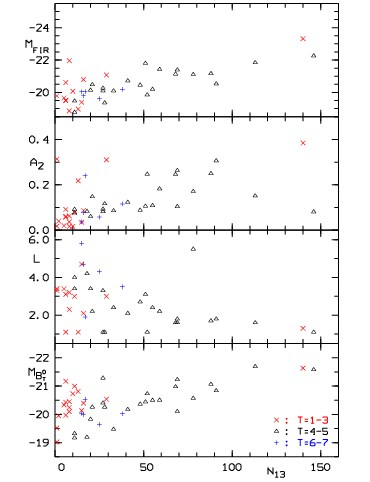
It is impossible to get a true measure of the population size since the present sample of images is too shallow to include the faint end of the stellar cluster/complex population. The detection limit M, in absolute magnitude, was defined by an instrumental magnitude of -4 mag corresponding on average to MK = -13 mag, depending on the distance modulus of the individual galaxies (see Table 2). The number of diffuse objects, N13, with MK-13 mag was used to indicate the size of the population of knots. The values of N13 are listed in Table 2, while Fig. 10 shows the relations to M, L, A2, and absolute magnitude of far-infrared flux MFIR as given by RC3. It is noted that M and N13 will correlate if all galaxies have the same distribution function of knots since a larger population will also have a brighter M magnitude.
For late-type spirals, both M and N13 correlate well with the absolute luminosity of the host galaxy and may be related to the total population size of young complexes in these galaxies. The early-type spirals have few complexes but a wide spread in the luminosity of their brightest member suggesting that another mechanism beside the population size is important for the upper brightness limit of the knots.
Galaxies in luminosity class I-II have, on average, more luminous knots, as measured by M, than those in higher classes as expected from the definition (van den Bergh 1960). A similar trend is seen for N13 where higher luminosity classes typically have fewer knots than the classes I-II.
The number of knots correlates with the K-band amplitude, A2, of the two-armed spiral pattern, whereas galaxies with M-14 have weak spiral perturbations. The two exceptions, NGC 3351 and NGC 3627, both have strong bars that may have biased the estimate of A2. These relations could suggest a threshold effect in the sense that only galaxies with strong spiral perturbations (i.e. 0.1A2) are able to form many and bright stellar complexes. This may be related to the ability of spiral large-scale shocks to compress giant molecular clouds (Elmegreen 1981).
The magnitude M of the brightest knot in a galaxy does not depend on its far-infrared flux, MFIR, whereas the population size N13 increases with increasing flux. Thus, the amount of dust in a galaxy is likely to influence the number of clusters or complexes formed but not their luminosity.
Restricting the sample to later type spirals with T3, one may derive the following two correlations:
and
where the dependency on the amplitude of the spiral perturbation is marginal due to the low values of A2 for the 2 brightest spirals in the sample.
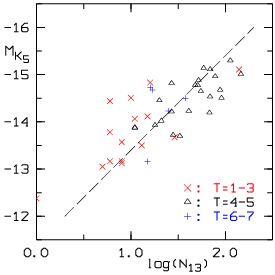
The logarithmic sample size, N13, and the magnitude of the 5th brightest knot given by M correlate well as seen in Fig. 11. Although a formal regression gives a shallower slope, the distribution is compatible with a power law with an index of -2 as found for most luminosity functions of young clusters (see e.g. Whitmore et al. 1999; Whitmore 2004). The significant spread in the limiting absolute magnitude of the sample will affect the completeness and bias the distribution. A general correlation between sample size and brightest member is expected as a trivial sampling effect of continuous distribution functions.
| Galaxy | A2 | M | M | N13 | Mc | M | SFR |
|---|---|---|---|---|---|---|---|
| NGC 157 | 0.26 | -13.5 | -15.1 | 69 | -18.9 | 5.4 | 0.73 |
| NGC 210 | 0.09 | -13.4 | -13.8 | 6 | -16.2 | 7.4 | 0.06 |
| NGC 289 | 0.15 | -13.2 | -14.0 | 21 | -17.3 | 6.4 | 0.17 |
| NGC 578 | 0.11 | -13.4 | -14.6 | 55 | -18.4 | 4.6 | 0.47 |
| NGC 685 | 0.08 | -12.8 | -13.9 | 11 | -16.5 | 5.6 | 0.09 |
| NGC 895 | 0.24 | -14.1 | -14.7 | 17 | -17.8 | 5.5 | 0.27 |
| NGC 1068 | 0.06 | -11.3 | -13.1 | 8 | -17.1 | 6.5 | 0.14 |
| NGC 1084 | 0.11 | -12.9 | -14.8 | 51 | -18.5 | 5.0 | 0.51 |
| NGC 1087 | 0.17 | -13.2 | -15.0 | 78 | -18.8 | 4.3 | 0.72 |
| NGC 1187 | 0.12 | -12.8 | -14.2 | 41 | -17.9 | 5.3 | 0.29 |
| NGC 1255 | 0.09 | -13.3 | -14.2 | 27 | -17.4 | 5.5 | 0.19 |
| NGC 1300 | 0.25 | -13.1 | -14.9 | 52 | -18.4 | 5.2 | 0.49 |
| NGC 1350 | 0.08 | -13.4 | -14.1 | 11 | -16.7 | 7.8 | 0.10 |
| NGC 1357 | 0.06 | -13.7 | -14.4 | 6 | -16.5 | 7.5 | 0.08 |
| NGC 1365 | 0.38 | -13.1 | -15.1 | 140 | -19.5 | 5.6 | 1.36 |
| NGC 1371 | 0.04 | -13.0 | - | 2 | -14.9 | 8.7 | 0.02 |
| NGC 1398 | 0.22 | -12.8 | -13.5 | 13 | -16.8 | 7.6 | 0.11 |
| NGC 1425 | 0.04 | -12.9 | -13.2 | 8 | -16.0 | 7.2 | 0.05 |
| NGC 1566 | 0.25 | -12.9 | -14.7 | 88 | -18.8 | 5.5 | 0.67 |
| NGC 2775 | 0.02 | -12.7 | -13.6 | 8 | -16.2 | 7.9 | 0.06 |
| NGC 2855 | 0.01 | -13.5 | - | 2 | -15.0 | 9.0 | 0.02 |
| NGC 2935 | 0.09 | -13.8 | -14.8 | 16 | -17.7 | 6.4 | 0.25 |
| NGC 2997 | 0.25 | -12.2 | -14.2 | 68 | -18.7 | 4.8 | 0.64 |
| NGC 3351 | 0.31 | -11.4 | -12.4 | 1 | -16.0 | 6.9 | 0.05 |
| NGC 3368 | 0.02 | -11.8 | -13.1 | 5 | -16.4 | 7.3 | 0.08 |
| NGC 3370 | 0.09 | -12.7 | -13.9 | 11 | -16.5 | 5.3 | 0.08 |
| NGC 3389 | 0.08 | -12.7 | -13.9 | 18 | -16.9 | 4.7 | 0.12 |
| NGC 3621 | 0.04 | -10.9 | -13.2 | 15 | -18.2 | 4.2 | 0.42 |
| NGC 3627 | 0.31 | -11.3 | -13.7 | 29 | -18.5 | 5.2 | 0.54 |
| NGC 3810 | 0.09 | -12.1 | -13.7 | 33 | -17.5 | 5.1 | 0.20 |
| NGC 4030 | 0.10 | -13.0 | -14.5 | 69 | -18.5 | 5.4 | 0.54 |
| NGC 4321 | 0.08 | -13.2 | -15.0 | 146 | -19.5 | 5.4 | 1.31 |
| NGC 4535 | 0.15 | -13.7 | -15.3 | 113 | -19.7 | 4.8 | 1.55 |
| NGC 4579 | 0.06 | -13.1 | -13.2 | 6 | -15.3 | 9.5 | 0.03 |
| NGC 4941 | 0.02 | -12.4 | - | 1 | -14.2 | 8.3 | 0.01 |
| NGC 4965 | 0.08 | -14.0 | -14.7 | 16 | -17.6 | 4.6 | 0.22 |
| NGC 4981 | 0.06 | -13.5 | -14.5 | 20 | -17.5 | 5.8 | 0.21 |
| NGC 5085 | 0.09 | -13.6 | -14.8 | 48 | -18.4 | 5.5 | 0.49 |
| NGC 5134 | 0.03 | -13.3 | -14.1 | 15 | -17.0 | 6.5 | 0.13 |
| NGC 5247 | 0.31 | -12.8 | -14.5 | 91 | -18.8 | 4.6 | 0.68 |
| NGC 5364 | 0.12 | -12.7 | -13.7 | 28 | -17.4 | 5.6 | 0.18 |
| NGC 5668 | 0.06 | -13.3 | -14.2 | 25 | -17.5 | 4.8 | 0.20 |
| NGC 5861 | 0.18 | -13.6 | -15.1 | 59 | -19.0 | 4.5 | 0.81 |
| NGC 6384 | 0.08 | -13.5 | -14.8 | 27 | -17.9 | 6.3 | 0.31 |
| NGC 7213 | 0.02 | -13.9 | -14.5 | 10 | -17.5 | 7.3 | 0.22 |
| NGC 7418 | 0.12 | -13.1 | -14.5 | 38 | -17.8 | 5.1 | 0.29 |
7 Discussion
The total absolute magnitude Mc of the population of young clusters and complexes was estimated by integrating the luminosity of all diffuse sources (cs0.2) in the individual galaxies. The magnitude difference M between this total luminosity of the complexes and the parent galaxy is listed in Table 2. This suggests that at most a few percent of the K-band flux of a normal spiral galaxy originates from very young, starforming complexes.
Without detailed color information on the individual sources, it is difficult to estimate the SFR associated with the bright K-band knots. A crude calculation can be done by assuming that the young complexes have an age around 10 Myr. Using SB99 models with a standard Salpeter IMF and solar abundances, such complexes with an SFR of 1 M⊙ yr-1 would have an absolute magnitude M mag. The SFR can then be estimated and is listed in Table 2. These values may have errors of almost an order of magnitude due to the strong luminosity evolution around 6 Myr.
The possible correlation of the knots presented in this paper with H emitting complexes, such as those used by SINGG (Meurer et al. 2006; Hanish et al. 2006), remains an open issue. The NIR emitting knots and the Hα emitting complexes could present two different moments in the process of star formation, or they could be different parts of the same complexes. The detection of NIR-emitting knots in our sample represents an intermediate wavelength between SINGG and the SONGG survey proposed for the Spitzer telescope to be observed in 8 m. While SINGG and SONGG look at global fluxes, we instead try to observe with higher spatial resolution in order to study the connection to the perturbations that trigger the process of star formation. Thus, an identification of NIR-emitting knots and Hα-emitting ones necessitates imagery with the same resolution.
Our sample has only one galaxy, NGC 895, in common with the SINGG survey. The estimated SFR is compatible within the errors being 40% higher than that given by Meurer et al. (2006). There are 5 galaxies (i.e. NGC 3351, NGC 3621, NGC 3627, NGC 4321, and NGC 4579) with Hα-based SFR in Kennicutt et al. (2003). These estimates are more than an order of magnitude higher than our values. It could suggest that we only measure the most massive complexes representing the very upper range of the IMF, while SFR derived from Hα are sensitive to the formation of lower mass stars.
Another important issue to be tackled from our results is the behavior of dust during the NIR knots’ evolution. In fact, comparison with SB99 models for the four galaxies observed in JHK colors shows that very young NIR knots (2 Myr), as well as the oldest ones (50-70 Myr), approach the models more than do intermediate age knots. Only at the very end of the model’s life are there some knots that might be considered absorption free (Fig. 5). This may indicate that processes occurring during the life of the knots are renewing and/or remodeling the dust content so as to increase the optical depth. Contaminating candidates are the beginning of the RSG phase, as well as other poorly collimated outflows, such as those observed in Orion IRc2 (Churchwell 2002).
8 Conclusion
The K-band images of spiral galaxies provide an almost clear view of their young stellar clusters and starforming complexes that in visual bands are partly obscured by dust absorption (e.g. by dust lanes in spiral arms). This allows an unbiased study, within the resolution and magnitude limits imposed by the present sample, of the distribution of such complexes in 46 nearby spiral galaxies.
The (H-K)–(J-H) diagrams for the 4 galaxies, for which JHK photometry is available, suggest that the majority of diffuse sources (cs0.2) are starforming complexes that have been reddened with more than 4 mag of visual extinction. This is supported by their concentration in arm regions in many grand-design galaxies. Since the clusters complexes are unresolved, the internal attenuation by dust could vary very significantly and may obscure part of it even in the K-band. Some background galaxies may be included, whereas globular clusters are expected to be significantly fainter. Due to the high extinction and lack of color information for the majority of the sample, detailed conclusions cannot be made on the star formation process and its parameters.
Around 70% (15/22) of grand-design spirals in the sample show significant concentration of bright, diffuse knots in their arms corresponding to 30% (15/46) of the complete sample. The 7 grand-design systems that do not display a significant concentration of knots all have weak two-armed spiral perturbations. This suggests that only disk galaxies with strong spiral perturbation (i.e. 0.1A2) will be able to develop a starforming front associated to its spiral pattern, while galaxies with weaker spirals will have a more random star formation in their disks.
The brightest clusters/complexes as measured by M, the 5th brightest diffuse knot, reach absolute magnitudes of M mag but depend on absolute magnitude, type, luminosity type, and strength of the spiral perturbation of the host galaxy. Early type spirals have, on average, fainter complexes than later types. The brightest complexes are found in more luminous late-type spirals in luminosity class I-II with strong two-armed spiral patterns.
The number of clusters and complexes in a galaxy indicated by N13, diffuse knots with M mag, shows the same trends as M. In addition, the number correlates well with the far-infrared flux, suggesting a dependency on the amount of dust in the galaxy.
Star formation rates were estimated from the total integrated K-band luminosity of the diffuse knots in each galaxy. The values range up to 1 M⊙ yr-1 for grand-design spirals but may only indicate the formation of the most massive complexes.
Acknowledgements.
The ESO-MIDAS system and SExtractor were used for the reduction and analysis of the data. HD thanks ESO and the Brazilian Council of Research CNPq, Brazil, for support. We would also like to thank the referee, Dr. P. Anders, for his comments and suggestions, which significantly improved the paper.References
- Bastian & Goodwin (2006) Bastian, N. & Goodwin, S. P. 2006, MNRAS, 369, L9
- Bertin & Arnouts (1996) Bertin, E. & Arnouts, S. 1996, A&AS, 117, 393
- Churchwell (2002) Churchwell, E. 2002, ARA&A, 40, 27
- de Vaucouleurs et al. (1991) de Vaucouleurs, G., de Vaucouleurs, A., Cowien, H., et al. 1991, Third reference catalogue of bright galaxies (New York: Springer)
- Dottori et al. (2005) Dottori, H., Díaz, R. J., Carranza, G., Lípari, S., & Santos, J. J. 2005, ApJ, 628, L85
- Ellis & Bland-Hawthorn (2006) Ellis, S. C. & Bland-Hawthorn, J. 2006, AAO Newsletter, 110, 16
- Elmegreen (1981) Elmegreen, B. G. 1981, ApJ, 243, 512
- Gittins & Clarke (2004) Gittins, D. M. & Clarke, C. J. 2004, MNRAS, 349, 909
- Goodwin & Bastian (2006) Goodwin, S. P. & Bastian, N. 2006, MNRAS, 373, 752
- Grosbøl et al. (2006) Grosbøl, P., Dottori, H., & Gredel, R. 2006, A&A, 453, L25
- Grosbøl & Patsis (1998) Grosbøl, P. & Patsis, P. A. 1998, A&A, 336, 840
- Grosbøl et al. (2004) Grosbøl, P., Patsis, P. A., & Pompei, E. 2004, A&A, 423, 849
- Hanish et al. (2006) Hanish, D. J., Meurer, G. R., Ferguson, H. C., et al. 2006, ApJ, 649, 150
- Helfer et al. (2003) Helfer, T. T., Thornley, M. D., Regan, M. W., et al. 2003, ApJS, 145, 259
- Junqueira & Combes (1996) Junqueira, S. & Combes, F. 1996, A&A, 312, 703
- Kennicutt et al. (2003) Kennicutt, R. C., Armus, L., Bendo, G., et al. 2003, PASP, 115, 928
- Leitherer et al. (1999) Leitherer, C., Schaerer, D., Goldader, J. D., et al. 1999, ApJS, 123, 3
- Lin & Shu (1964) Lin, C. C. & Shu, F. H. 1964, ApJ, 140, 646
- Meurer et al. (2006) Meurer, G. R., Hanish, D. J., Ferguson, H. C., et al. 2006, ApJS, 165, 307
- Patsis et al. (2001) Patsis, P. A., Héraudeau, P., & Grosbøl, P. 2001, A&A, 370, 875
- Persson et al. (1998) Persson, S. E., Murphy, D. C., Krzeminski, W., Roth, M., & Rieke, M. J. 1998, AJ, 116, 2475
- Pierini et al. (2004) Pierini, D., Gordon, K. D., Witt, A. N., & Madsen, G. J. 2004, ApJ, 617, 1022
- Rieke & Lebopsky (1985) Rieke, G. H. & Lebopsky, M. J. 1985, ApJ, 288, 618
- Roberts (1969) Roberts, W. W. 1969, ApJ, 158, 123
- Robin et al. (2003) Robin, A. C., Reylé, C., Derrière, S., & Picaud, S. 2003, A&A, 409, 523
- Robin et al. (2004) —. 2004, A&A, 416, 157
- Sandage & Bedke (1994) Sandage, A. & Bedke, J. 1994, The Carnegie atlas of galaxies (Washington, D.C.: Carnegie Inst. of Washington)
- van den Bergh (1960) van den Bergh, S. 1960, ApJ, 131, 215
- Wada & Norman (1999) Wada, K. & Norman, C. A. 1999, ApJ, 516, L13
- Whitmore (2004) Whitmore, B. C. 2004, in ASPC, Vol. 322, The Formation and Evolution of Mssive Young Star Clusters, 419–426
- Whitmore et al. (1999) Whitmore, B. C., Zhang, Q., Leitherer, C., et al. 1999, AJ, 118, 1551
- Wielen (1977) Wielen, R. 1977, A&A, 60, 263
- Witt et al. (1992) Witt, A. N., Thronson, H. A., & Capuano, Jr., J. M. 1992, ApJ, 393, 611
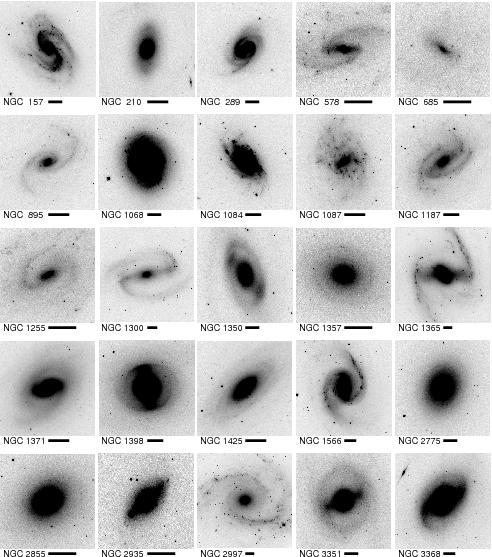
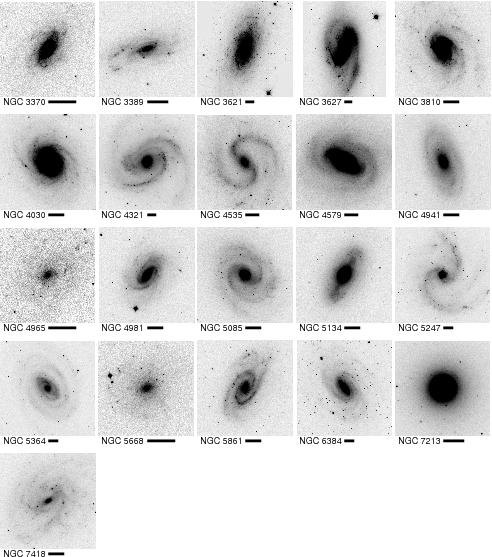
Appendix A Individual galaxies
This section provides direct K-band images for the entire sample of galaxies used to study the statistics of bright knots in spiral galaxies (see Fig. 12–13). Diagrams of the distribution of extended sources in the individual galaxies are shown in Fig. 14–22. For each galaxy, the leftmost plot gives the locations of knots in a polar map where the position of the two-armed spiral pattern, as derived from the phase of the azimuthal m=2 Fourier component, is indicated by dashed lines. Sources with star_class in the range 0.2cs0.8 are plotted as () while the most diffuse ones with cs0.2 are shown as (+). The next diagram shows the azimuthal distribution of the knots relative to the spiral pattern where 0° and 180° indicates the maxima of K-band intensity of the two-armed spiral. It is noted that only 15 of the galaxies (mainly grand-design spiral) show a concentration of knots in their arm regions. The third plot gives the histogram of absolute magnitudes MK, where the vertical dotted line indicates the limiting magnitude M, The rightmost shows the distribution of the (H-K) color index for galaxies when available. For the histograms, the top, dashed line indicates the distribution for all knots with cs0.8 whereas the lower full drawn line only includes knots with cs0.2.