High-resolution radio continuum survey of M33
III. Magnetic fields
Abstract
Aims. We study the magnetic field structure, strength, and energy density in the Scd galaxy M33.
Methods. Using the linearly polarized intensity and polarization angle data at 3.6, 6.2 and 20 cm, we determine variations of Faraday rotation and depolarization across M33. We fit a 3-D model of the regular magnetic field to the observed azimuthal distribution of polarization angles. We also analyze the spatial variation of depolarization across the galaxy.
Results. Faraday rotation, measured between 3.6 and 6.2 cm at an angular resolution of 3 (0.7 kpc), shows more variation in the south than in the north of the galaxy. About 10% of the nonthermal emission from M33 at 3.6 cm is polarized. High degrees of polarization of the synchrotron emission () and strong regular magnetic fields in the sky plane (G) exist in-between two northern spiral arms. We estimate the average total and regular magnetic field strengths in M33 as 6.4 and 2.5 G, respectively. Under the assumption that the disk of M33 is flat, the regular magnetic field consists of horizontal and vertical components: however the inferred vertical field may be partly due to a galactic warp. The horizontal field is represented by an axisymmetric () mode from 1 to 3 kpc radius and a superposition of axisymmetric and bisymmetric () modes from 3 to 5 kpc radius.
Conclusions. An excess of differential Faraday rotation in the southern half together with strong Faraday dispersion in the southern spiral arms seem to be responsible for the north-south asymmetry in the observed wavelength dependent depolarization. The presence of an axisymmetric mode of the regular magnetic field in each ring suggests that a galactic dynamo is operating in M33. The pitch angles of the spiral regular magnetic field are generally smaller than the pitch angles of the optical spiral arms but are twice as big as simple estimates based on the mean-field dynamo theory and M33’s rotation curve. Generation of interstellar magnetic fields from turbulent gas motions in M33 is indicated by the equipartition of turbulent and magnetic energy densities.
Key Words.:
galaxies: individual: M33 – radio continuum: galaxies – galaxies: magnetic field – galaxies: ISMtabataba@mpifr-bonn.mpg.de
1 Introduction
Magnetic fields in galaxies can be traced by radio polarization measurements. The linearly polarized intensity gives information about the magnetic field strength and orientation in the plane of the sky, Faraday rotation measurements enable us to determine the magnetic field strength and direction along the line of sight and depolarizing effects can be sensitive to both components.
M33, the nearest Scd galaxy at a distance of 840 kpc, with its large angular size [high-frequency radio continuum emission was detected in an area of , 39] and medium inclination of 56∘, allows determination of the magnetic field components both parallel and perpendicular to the line of sight equally well. The first RM study of M33, based on polarization observations at 11.1 and 21.1 cm [2], suggested a bisymmetric regular magnetic field structure in the disk of M33. [8] confirmed the presence of this bisymmetric field using two further polarization maps at 6.3 and 17.4 cm. However, these results may be affected by weak polarized intensity and the consequent high uncertainty in RM in the southern half of M33, due to the low-resolution (7.7 or 1.8 kpc) and low-sensitivity of the observations.
Our recent observations of this galaxy provided high-sensitivity and high-resolution () maps of total power and linearly polarized intensity at 3.6, 6.2, and 20 cm presented by [39]. These data are ideal to study the rotation measure (RM), magnetic fields (structure and strength), and depolarization effects in detail.
[39] found a north-south asymmetry in the polarization distribution that is wavelength-dependent, indicating a possible north-south asymmetry in Faraday depolarization. Investigation of this possibility requires a knowledge of the distribution of RM, turbulent magnetic field and thermal electron density in the galaxy. Furthermore, depolarization is best quantified using the nonthermal degree of polarization rather than the fraction of the total radio emission that is polarized. [38] developed a new method to separate the thermal and nonthermal components of the radio continuum emission from M33 which yielded maps of the nonthermal synchrotron emission and the synchrotron spectral index variations across the galaxy [37]. The nonthermal maps are used in this paper to determine the nonthermal degree of polarization at different wavelengths, and hence to study how the radio continuum emission from different parts of M33 is depolarized.
By combining an analysis of multi-wavelength polarization angles with modeling of the wavelength dependent depolarization, [20] and [6] derived the 3-D regular magnetic field structures in M31 and M51, respectively. The high sensitivity of our new observations allows a similar study for M33.
We first determine the nonthermal degree of polarization using the new nonthermal maps (Sect. 2). Then we calculate a map of the RM intrinsic to M33 with a spatial resolution of 3 or 0.7 kpc and probe its mean value in rings in the galactic plane in Sect. 3. The regular magnetic field structure is derived in Sect. 4 and the estimated strengths are presented. We derive a map for the observed depolarization and discuss the possible physical causes of depolarization sources in Sect. 5. Furthermore, we discuss the resulting vertical fields and pitch angles in Sect. 6. The estimated energy density of the magnetic field is compared to the thermal and turbulent energy densities of the interstellar gas.
| Snth | SPI | ||
|---|---|---|---|
| (cm) | (mJy) | (mJy) | |
| 3.6 | 370 60 | 38 4 | 10.3 2.0 |
| 6.2 | 696 110 | 79 5 | 11.3 1.9 |
| 20 | 1740 65 | 115 10 | 6.6 0.6 |
2 Nonthermal degree of polarization
The degree to which synchrotron emission is polarized reflects the degree of coherent structure in the magnetic field within one beam-area; a purely regular magnetic field will produce about 75%111If a nonthermal spectral index of is used. fractional polarization of synchrotron emission. The quantity of interest is the degree of polarization of the synchrotron emission or ‘nonthermal degree of polarization’, P, where PI is the intensity of the linearly polarized emission and is the intensity of the nonthermal emission.
Since we observe the total intensity , which consists of both nonthermal and thermal intensities at cm wavelengths, Pnth cannot be calculated straightforwardly. To date, Pnth has been estimated by assuming either a fixed ratio or has been derived assuming a fixed spectral index of the synchrotron emission. Here we use a new, more robust method for determining the distribution of by correcting H maps for dust extinction, using multi-frequency infra-red maps at the same resolution, and thus independently estimating [38]. Using the PI maps of Tabatabaei et al. [39] and the nonthermal maps obtained by Tabatabaei et al. [38], we derived maps of Pnth at different wavelengths.
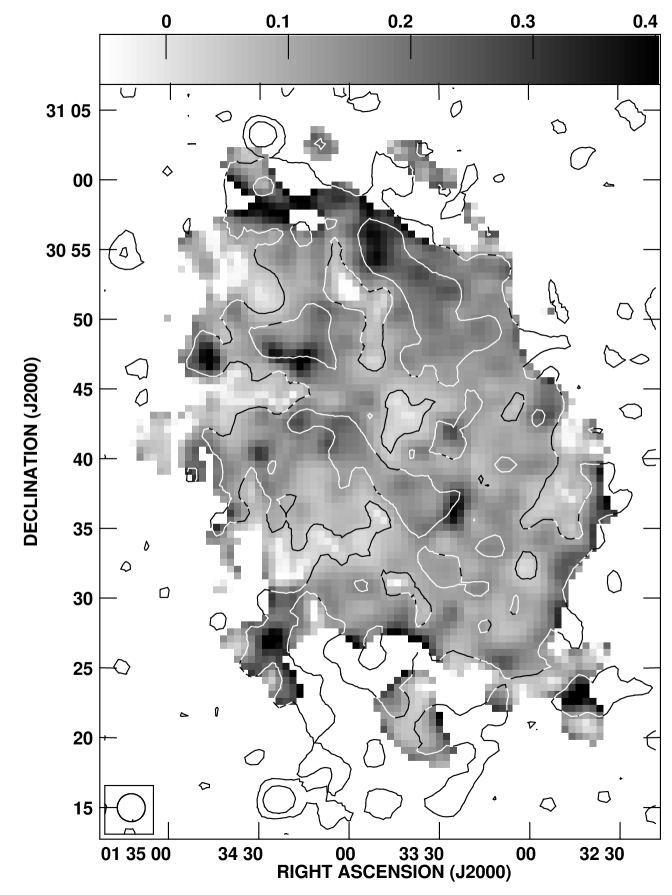
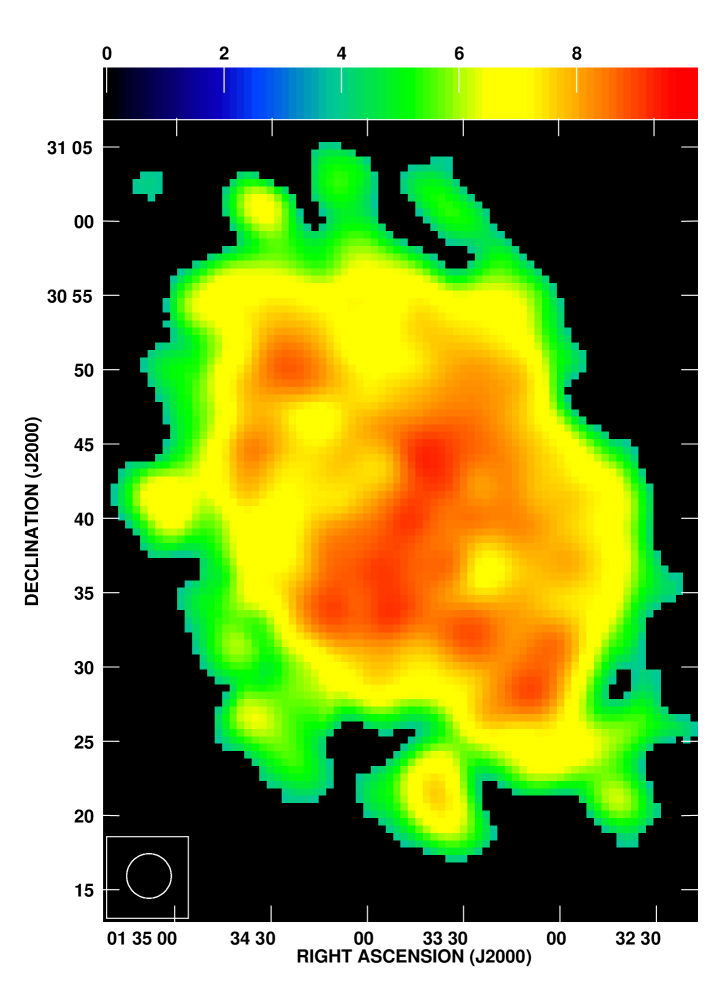
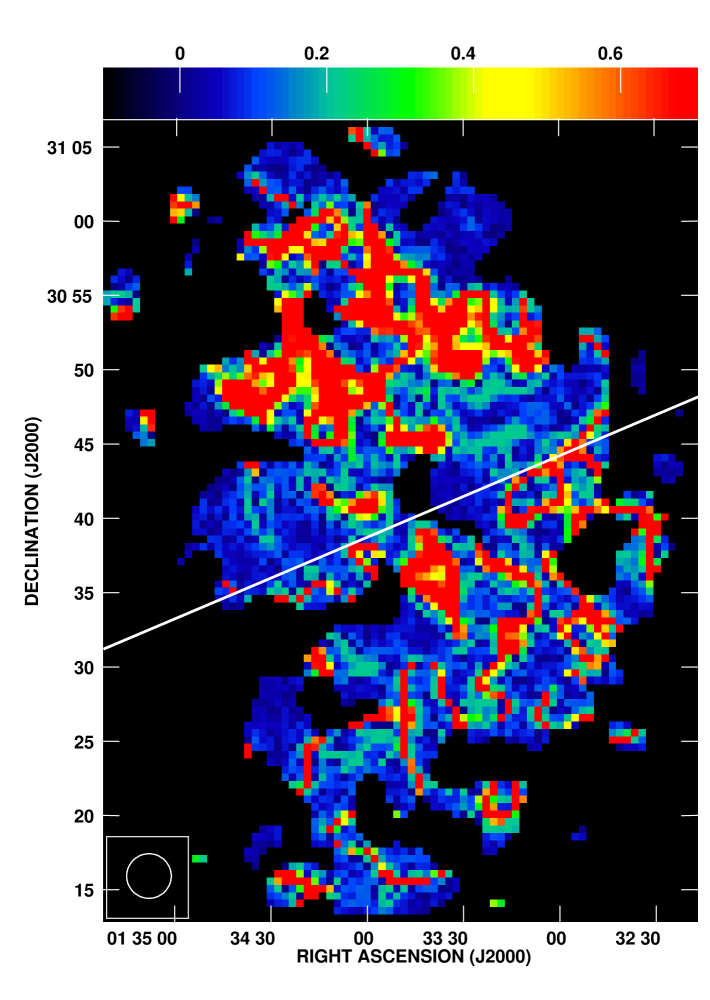
Figure 1 shows Pnth at 3.6 cm. High nonthermal degrees of polarization (P 30%) are found in several patches of M33, with the most extended region of high Pnth in the northern part of the magnetic filament identified by Tabatabaei et al. [39], inside the second contour at DEC in Fig. 1. The high Pnth also exist at 6.2 cm in these regions.
Integrating the polarized and nonthermal intensity maps in the galactic plane out to galactocentric radius of R 7.5 kpc, we obtained the flux densities of the nonthermal and linearly polarized emission along with the average nonthermal degree of polarization . Table 1 gives , , and at different wavelengths, all at the same angular resolution of 180. At 3.6 and 6.2 cm, is the same, demonstrating that Faraday depolarization effects are not significant at these wavelengths: the weaker SPI at 3.6 cm is due to lower synchrotron emissivity, as expected from the power-law behavior of synchrotron emission with respect to frequency. However, Faraday depolarization effects are possibly important at 20 cm reducing .
3 Rotation measures
When linearly polarized radio waves propagate in a magneto-ionic medium, their polarization vector is systematically rotated. The amount of Faraday rotation depends on the wavelength () of the radio emission, the strength of the magnetic field along the line of sight (that is the regular field in the line of sight ), and the number density of thermal electrons () along the line of sight ():
| (1) | |||||
where is the path length through the magneto-ionic medium. Hence, the measured polarization angle () differs from the intrinsic polarization angle () as
| (2) |
When Faraday depolarization is small (Faraday-thin condition), does not depend on wavelength [35] and an estimate for can be obtained from measurements of the polarization angles at two wavelengths:
| (3) |
In this definition, the unknown intrinsic polarization angle of the source (or sources along the line of sight) cancels. Positive RM indicates that points towards us.
Part of the measured RM is due to the interstellar medium of M33 (intrinsic RM or ), the rest is due to the Galactic foreground medium (), . The foreground rotation measure in the direction of M33 is mainly caused by the extended Galactic magnetic bubble identified as region by Simard-Normandin & Kronberg [34]. Assuming that the intrinsic contributions of the extragalactic sources 3C41, 3C42, and 3C48 (in a region around M33) themselves cancel out and the intragalactic contribution is negligible, [7] and [36] found a foreground rotation measure of rad m-2 for those sources. For the polarized sources in the M33 field, [8] found a foreground RM of rad m-2. About the same value was obtained by [21]. In the following we use .
Using the polarization data of Tabatabaei et al. [39], we first obtained the distribution of RM between 3.6 and 20 cm across M33 (Fig. 2, left panel), showing a smooth distribution of RM in the northern half of the galaxy. However, stronger and more abrupt fluctuations in RM occur in the southern half of the galaxy, which are not due to the rad m-2 ambiguity in RM between these wavelengths (). Weak polarized emission in the southern half at 20 cm [presented in 39] can be linked to these RM variations. Between 3.6 and 6.2 cm, RM varies less than between 3.6 and 20 cm in the south of the galaxy (Fig. 2, right panel). This indicates that the relation between and in Eq. (2) is not linear over the interval between 3.6 and 20 cm due to Faraday depolarization at 20 cm in the south of M33 and so RM measured at these wavelengths is not a good estimator for .
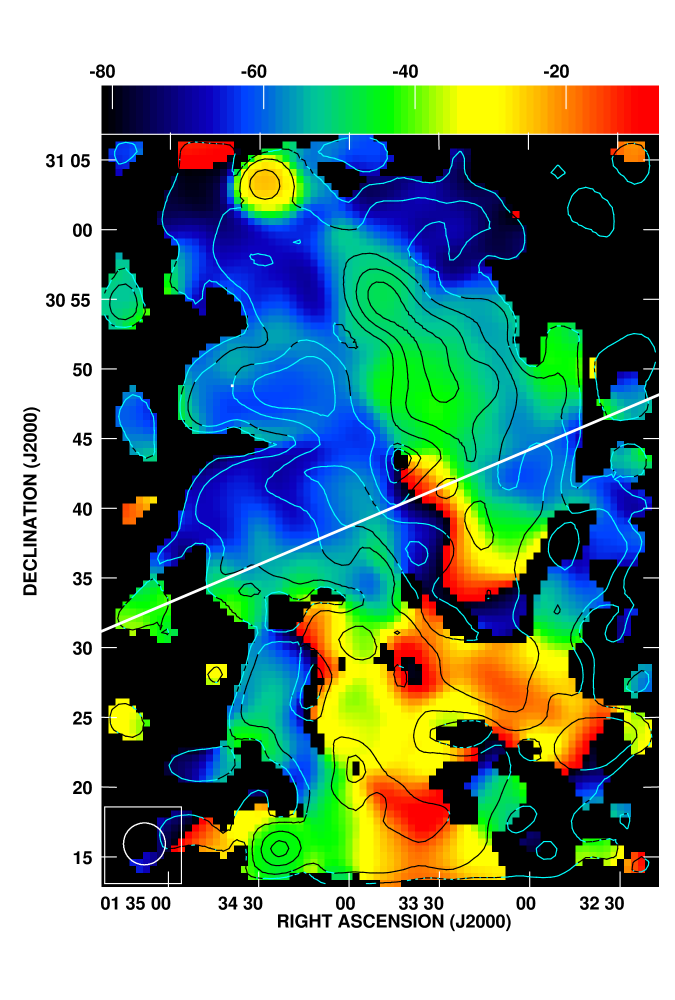
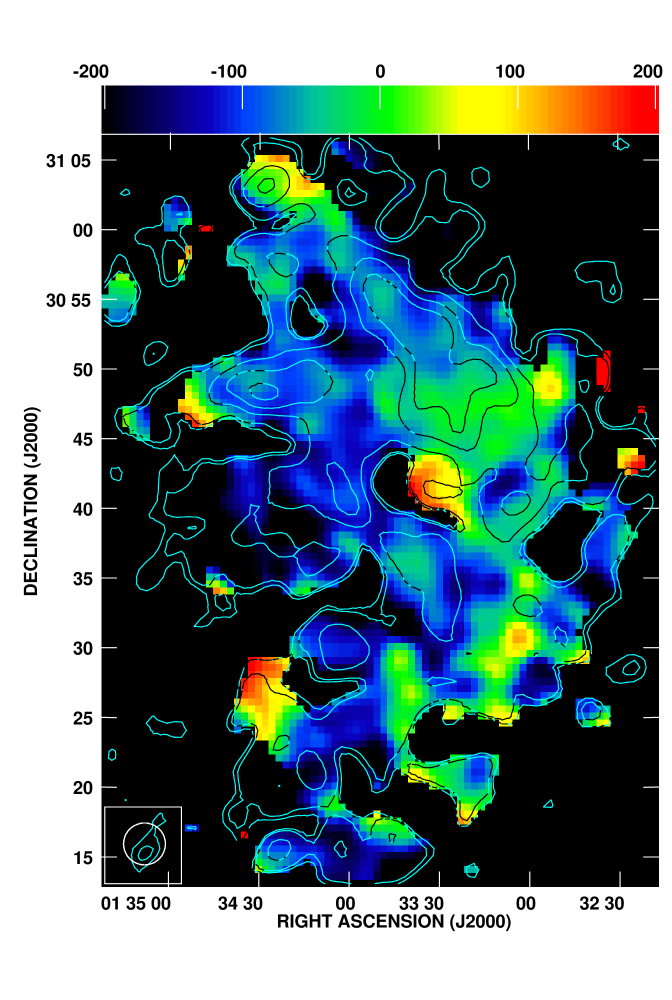
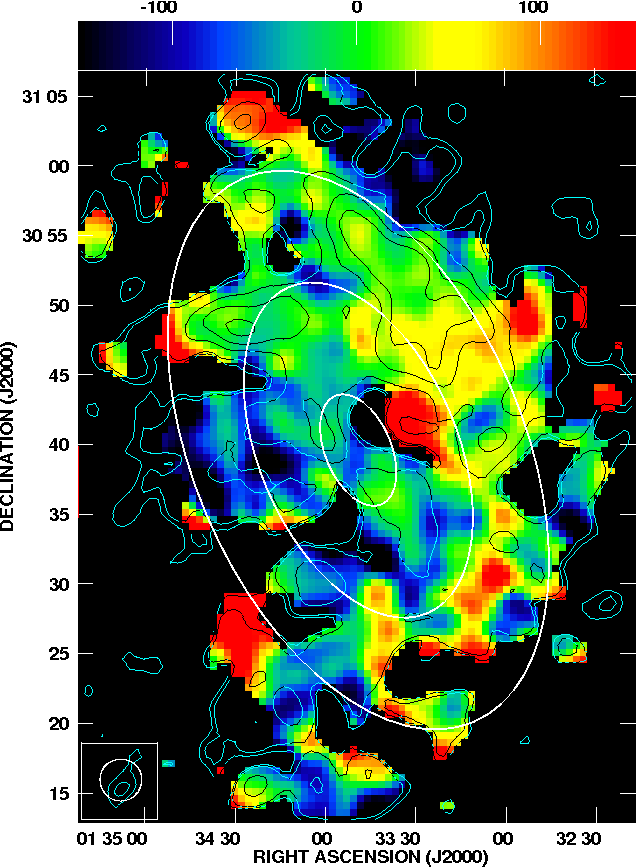
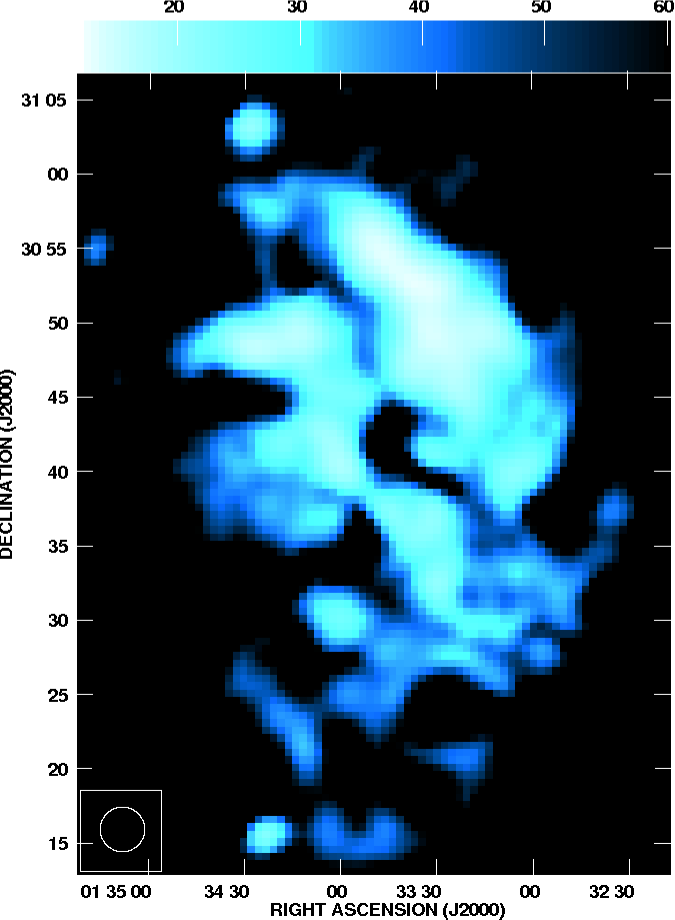
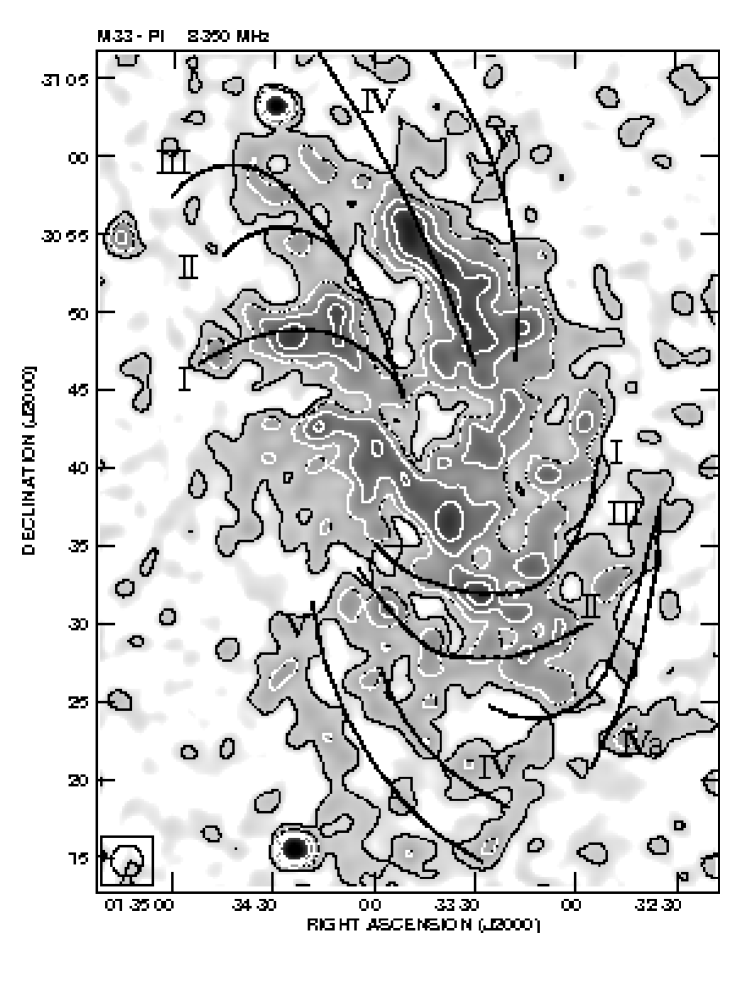
Figure 3 shows between 3.6 and 6.2 cm which varies in a range including both positive and negative values. Comparing with the overlayed contours of PI222Note that PI is related to the magnetic field in the plane of the sky that is a combination of both a mean field (or coherent regular field) and anisotropic (compressed or sheared) random fields. is related to only coherent regular field along the line of sight., seems to vary more smoothly in regions of high PI. The apparent agreement between the ordered magnetic field in the plane of the sky and the regular magnetic field in the line of sight is clearest in the north and along the minor axis and is best visible in the magnetic filament between the arms IV and V in the north-west of M33 [Fig. 4, see also 39] where shows small variation within the PI contours. This indicates that the ordered magnetic field in this region is mainly regular. Sign variations of RMi are more frequent (arising locally) in the southern half, where there is no correlation with PI, than in the northern half of the galaxy. This indicates that the regular magnetic field is more affected by local phenomena [like starforming activity, e.g. see 39] in the south than in the north of the galaxy. The local RMi variations between large positive and negative values may represent loop-like magnetic field structures going up from and down to the plane (e.g. Parker loops). This is particularly seen in the central part of the galaxy besides regions in the southern arm II S (Fig. 4).
Figure 3 also shows that the magnetic field is directed towards us on the western minor axis (at azimuth and ), but has an opposite direction on the eastern side. The large RMi values in regions with small electron density, e.g. on the eastern and western minor axis and in a clumpy distribution in the central south near the major axis with 30∘ 25DEC30∘ 30 [38], indicates a strong magnetic field along the line of sight and/or large path length through the magneto-ionic medium. Considerable Faraday rotation measured on the eastern and western minor axis hints to deviation from a purely toroidal structure for the large-scale magnetic field [22, 4]. Furthermore, along with the magnetic field parallel to the disk, the presence of a vertical field component to the galactic disk is indicated in kpc-scale regions of large RMi but small values. The existence of the vertical magnetic field in M33 (that is strong near the major axis) is shown in Sect. 4.
4 The magnetic field
4.1 The regular magnetic field structure
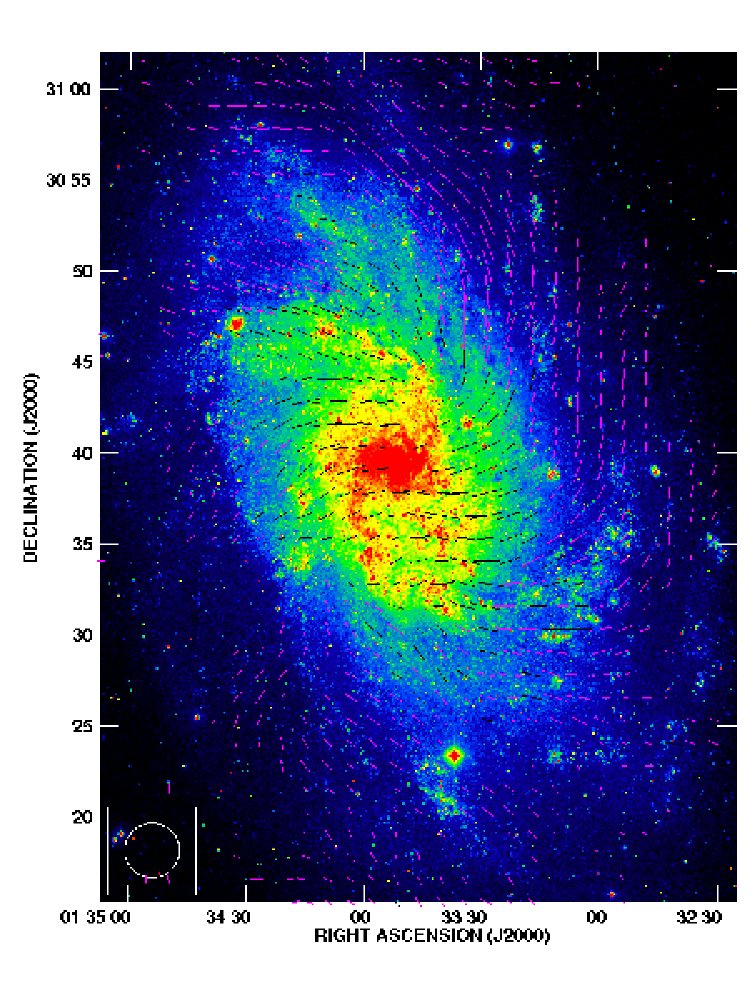
The polarization angles were corrected for Faraday rotation and rotated by to obtain the intrinsic orientation of the regular magnetic field component in the plane of the sky (). Figure 4 shows the derived superimposed on an optical image of M33. The orientation of shows a spiral magnetic field pattern with a similar pitch angle to the optical arms in the north and south, but larger pitch angles in the east and west of the galaxy.
The apparent continuity of the regular magnetic field straight through the center of M33 is remarkable. The Faraday rotation map (Fig. 3) shows that the field is oppositely directed on the east and west sides of the center. Unfortunately the current data lack the resolution to investigate the field properties in this region further.
The behavior of along the minor axis (, ) is also informative. on the minor axis clearly has a strong radial component (Fig. 4). If we assume that lies solely in the disc, so that is produced by the galaxy’s inclination (i.e. ), then the change of sign in RM along the minor axis (Fig. 3) indicates that the direction of the radial component of is towards center on both sides of the minor axis. This means that the dominant azimuthal mode of cannot be the bisymmetric mode suggested by earlier studies [2, 8]: we expect the dominant mode to be even.
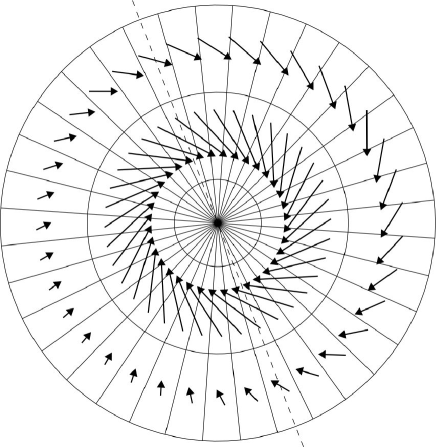
In order to identify the 3-D structure of the regular magnetic field we fit a parameterized model of to the observed polarization angles at different wavelengths using the method successfully employed by Berkhuijsen et al. [6] and Fletcher et al. [20] to determine the magnetic field structures of M51 and M31 respectively.
At each wavelength the maps in the Stokes parameters and are averaged in sectors of opening angle and radial width in the range kpc. The size of the sectors is chosen so that the area of the smallest sector is roughly equivalent to one beam-area. We also take care that the standard deviation of the polarization angle in each sector is greater than the noise (if the sector sizes are too small then fluctuations in angle due to noise can be larger than the standard deviation). Then the average and intensities are combined to give the average polarization angle and the average polarized emission intensity in each sector.
The observed polarization angles are related to the underlying properties of the regular magnetic field in M33 by333Note that we choose different symbols for the average polarization angle and the average polarization angle in sectors .
| (4) |
where is the intrinsic angle of polarized emission, is the Faraday rotation experienced by a photon as it passes through the magneto-ionic medium of M33 and is foreground Faraday rotation due to the Milky Way. is the component of the regular magnetic field of M33 that lies in the sky-plane and the component directed along the line-of-sight.
The cylindrical components of the regular field in the disk of M33 can be represented in terms of the Fourier series in the azimuthal angle :
where and are the amplitude of the mode with azimuthal wave number in the horizontal and vertical fields, is the constant pitch angle of the ’th horizontal Fourier mode (i.e. the angle between the field and the local circumference) and and are the azimuths where the non-axisymmetric modes are maximum. The amplitudes of the Fourier modes are obtained in terms of the variables in units of : in order to obtain amplitudes in Gauss independent information is required about the average thermal electron density and disc scale-height. Useful equations describing how and are related to the field components of Eq. (4.1) can be found in Appendix A of Berkhuijsen et al. [6].
Using Eqs. (4) and (4.1), and taking into account the inclination () and major-axis orientation () of M33, we fit the three-dimensional to all of the observed polarization angles in a ring by minimizing the residual
| (6) |
where is the observed angle of polarization, the modelled angle in the sector centred on azimuth and are the observational errors. The Fisher test is used to ensure that the fits at each wavelength are statistically, equally good [see Appendix B in 6]. Errors in the fit parameters are estimated from the region of parameter space where at the level.
4.2 Results of fitting
We applied the method described in Sect. 4 to the polarization maps at 3.6 and 6.2 cm. A preliminary examination of the data at all three wavelengths showed that the 20 cm polarization angles do not have the same Faraday rotation dependence as the angles at 3.6 and 6.2 cm. This is most probably because the 20 cm signal is strongly depolarized by Faraday effects (see Sect. 5) and so only photons from an upper layer of the emitting region are detected in polarization. If the depolarization is constant at a given radius, a ‘depth’ parameter can be used to take account of this effect [6, 20]. However, in the case of M33 depolarization is strongly asymmetric (Fig. 11) and this method does not lead to consistent results: we therefore work only with the polarization angles at 3.6 and 6.2 cm to model the regular magnetic field.
We fixed the foreground Faraday rotation, in Eq. (4), to (see Sect. 3). For each ring we found more than one statistically good fit to the observed polarization angles, three different fits in the ring 1–3 kpc and two fits in the ring 3–5 kpc, the fitted parameters are shown in Table LABEL:tab:fit. All of the fits require the presence of more than one azimuthal Fourier mode and have two common characteristics: the presence of an mode that has a significant amplitude; the pitch angle of the mode is in the range . The reason why several equally good fits are found is the rather weak large-scale intrinsic rotation measure signal, i.e. the amplitude of systematic rotation measure variations is rather low compared to local fluctuations. This is a sign that the regular magnetic field of M33 is not as well-ordered and strong, relative to the small-scale field, as that of, for example, M31 [20].
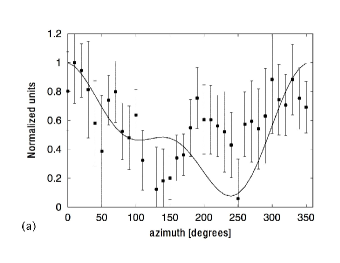
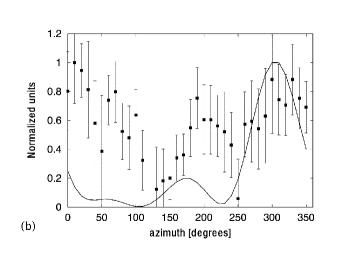
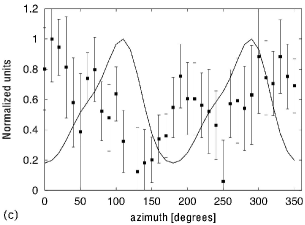
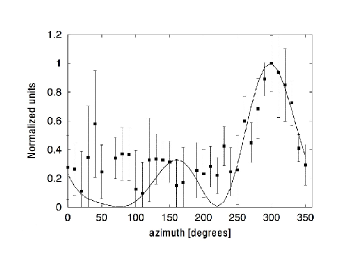
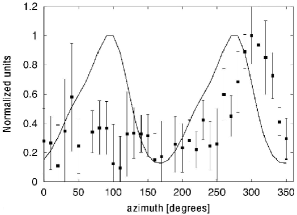
The model regular magnetic field given by Eq. 4.1 is fitted to the observed polarization angles, in order to obtain the results shown in Table LABEL:tab:fit. Since we have not made use of the observed polarized intensity we can try to use this to select the best regular magnetic field model for each of the two rings from the fits given in Table LABEL:tab:fit. We compare the predicted azimuthal pattern of polarized intensity from the model fields with the observed polarized intensity (PI) at 6.2 (Faraday depolarization effects are negligible at 6.2 cm and emissivity is higher than at 3.6 cm due to the spectral index, thus giving a stronger signal). The model described by Eq. 4.1 is not designed to reproduce the observed PI so we cannot make meaningful statistical assessments about the relative merits of the different fits in a given ring. But we can judge whether or not the fits are better or worse than each other in explaining the location of the main maxima and minima in the observed pattern of PI and so try to select a preferred model field for each ring.
Figures 5 and 6 shows the square of the predicted plane-of-sky regular magnetic field for each of the fits given in Table LABEL:tab:fit and the observed 6.2 cm polarized intensity, both normalized to avoid having to use a prescription for the poorly known synchrotron emissivity. In the case of energy equipartition between cosmic rays and magnetic fields the polarized intensity would be proportional to a higher power of than and maxima would be more pronounced.
In the ring 1–3 kpc, the model field with the components of 444 and are the first and secound Fourier modes of the vertical field. (Fig. 5a) reproduces the broad features of the observed polarized emission better than the models using the modes (Fig. 5b) and (Fig. 5c). The match to the observed PI is far from perfect in Fig. 5a but this is the only model field that can account for the strong excess of PI at 6 cm in the northern half of the disc at these radii. In the ring 3–5 kpc the fit using (Fig. 6, top) is better at reproducing the general pattern of polarized emission at 6 cm than the other statistically good fit using (Fig. 6, bottom). Again, the match to observations is not perfect, but the model with would produce a strong maximum in PI at that is not observed.
To summarize: we select the statistically good fit using the modes in the ring 1–3 kpc and that using in the ring 3–5 kpc as being the best descriptions of the regular magnetic field in M33 (the parameters of these two preferred fits are given in columns 3 and 6 of Table LABEL:tab:fit). Our reason is that the produced by these models produces a much closer match to the observed pattern of PI at 6.2 cm than other statistically good models. Fig. 7 shows the regular magnetic field in a face-on view of the galaxy (thus the vertical field components cannot be seen).
| Units | Radial range (kpc) | ||||||
|---|---|---|---|---|---|---|---|
| 1–3 | 3–5 | ||||||
| RMfg | |||||||
| deg | |||||||
| deg | |||||||
| deg | |||||||
| deg | |||||||
| deg | |||||||
| deg | |||||||
4.3 The equipartition magnetic field strengths
The strengths of the total magnetic field and its regular component can be found from the total synchrotron intensity and its degree of linear polarization Pnth. Assuming equipartition between the energy densities of the magnetic field and cosmic rays (),
| (7) |
[5], where with the ratio between the number densities of cosmic ray protons and electrons, is the nonthermal intensity, the pathlength through the synchrotron emitting medium, and the mean synchrotron spectral index. MeV erg is the proton rest energy and
For a region where the field is completely regular and has a constant inclination with respect to the sky plane ( is the face-on view), . If the field is completely turbulent and has an isotropic angle distribution in three dimensions, . If the synchrotron intensity is averaged over a large volume, has to be replaced by its average over all occurring values of .
The strength of the regular magnetic field in the plane of the sky can be estimated from the observed nonthermal degree of polarization [32]:
with , , and the azimuthal angle ( is the turbulent magnetic field). This formula assumes that the regular magnetic field has a single orientation, is parallel to the disk and, taken over the galaxy as a whole, has no further preferential orientation with respect to any fixed direction in space.
The determined average values of , , and Pnth with the assumed values of 100) and ) lead to G and G for the disk of M33 (7.5 kpc). The strongest regular magnetic field is found in between the northern arms IV N and V N (in the magnetic filament) with G where G.
The regular magnetic field strength estimated from the mean rotation measure in sectors and assuming cm-3 (see Sect. 5) is G and G in the ring 1–3 kpc and 3–5 kpc, respectively. In the ring 1–3 kpc, the regular field strength is consistent with that estimated from the equipartition assumption, while it is much smaller in the ring 3–5 kpc. The more frequent RM variations in both amplitude and sign in the second ring (see Fig. 3) indicate a line-of-sight field component with many reversals and a small mean RM within each sector, whereas the field component in the sky plane causes significant polarized emission (which is insensitive to the field reversals).
The equipartition total magnetic field strength of G is slightly higher than the total field obtained by [8], G, assuming the minimum total energy requirement of the disk-like synchrotron source. This is not surprising because a difference of 20% is expected between the minimum and equipartition magnetic field strengths for field strengths of about G [5]. Furthermore, the mean nonthermal fraction from the standard thermal/nonthermal separation method is lower than that from the new method [38], resulting in a weaker equipartition magnetic field.
As the polarized intensity (PI/0.75, corrected for the maximum fractional polarization in a completely regular field) is related to the regular magnetic field strength, and the nonthermal intensity () to the total magnetic field strength in the plane of the sky, (PI/0.75) gives the nonthermal emission due to the turbulent magnetic field . Using this intensity with Eq. (7) and assuming a completely turbulent field yields the distribution of across the galaxy. Figure 8 shows strong (G) in the central region of the galaxy, the arm I S, and parts of the northern arm I N.
Using the mean synchrotron flux density, synchrotron spectral index, and degree of polarization in rings, we also derive the average field strengths in rings. Figure 9 shows some fluctuations but no systematic increase or decrease of these strengths with galactocentric radius. The small bump at kpc is due to the M33’s magnetic filament.

5 Depolarization
The depolarization observed at a certain wavelength is defined as the ratio of the nonthermal degree of linear polarization Pnth and the theoretical maximum value (75% for ). Generally, depolarization may be caused by instrumental effects as the bandwidth and beamwidth of the observations or by the wavelength-dependent Faraday depolarization. Bandwidth depolarization occurs when the polarization angles vary across the frequency band, reducing the observed amount of polarized emission. It is given by , where is the bandwidth of the observations [e.g. 28]. In our study, the wavelengths, bandwidths and RM values lead to a negligible bandwidth depolarization. Beamwidth depolarization occurs when polarization vectors of different orientation are unresolved in the telescope beam. In order to compensate this effect, the ratio of the nonthermal degree of polarization at two wavelengths is used at a same angular resolution,
| (9) |
where, . The observed depolarization , that is only wavelength dependent, is called the Faraday depolarization.
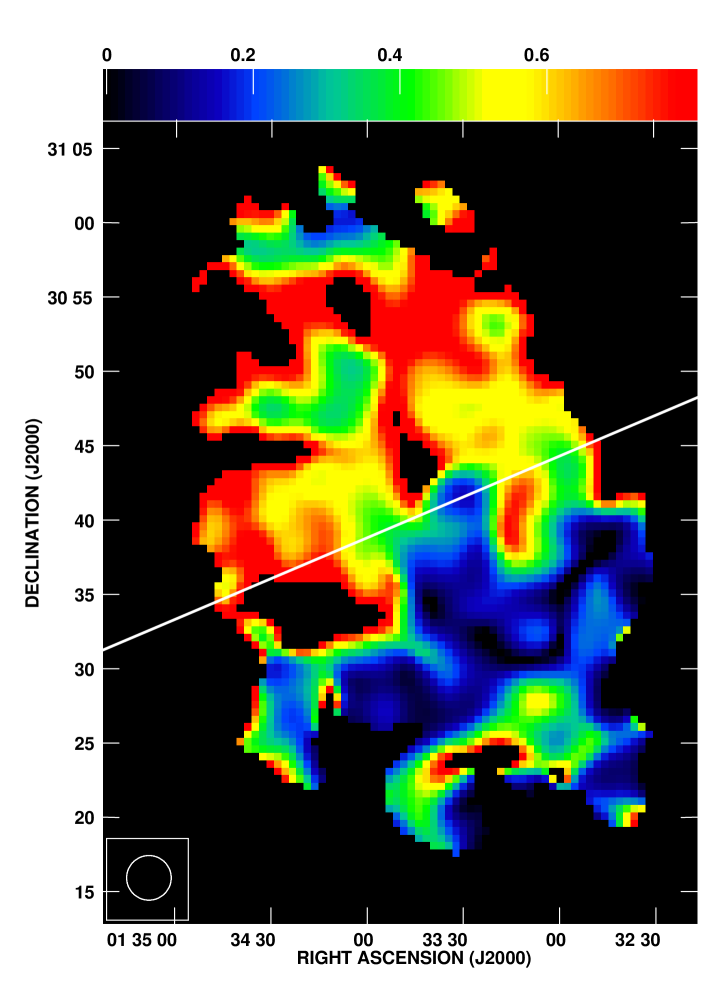
We derived the depolarization DP20/3.6 using the maps of nonthermal and polarized intensity at 20 and 3.6 cm at the same angular resolution of 180 (Fig. 11, top panel). The southern half of the galaxy is highly depolarized compared to the northern half. While DP20/3.6 changes between 0.0 and 0.5 in the south, it varies between 0.3 and 1.0 in the north. Considerable depolarization is found at the positions of the prominent HII regions NGC604 (RA = 1h 34m 32.9s, DEC = 30∘ 47 19.6), NGC595 (RA = 1h 33m 32.4s, DEC = 30∘ 41 50) and IC133 (RA = 1h 33m 15.3s, DEC = 30∘ 53 19.7) as can be expected due to their high densities of thermal electrons. The strongest depolarization in the inner galaxy occurs in the main southern arm I S. No depolarization (DP 1) is seen on the eastern end of the minor axis and some northern regions.
There are several mechanisms that can lead to wavelength-dependent Faraday depolarization [9, 35]. Differential Faraday rotation occurs when synchrotron emission originates in a magneto-ionic medium containing a regular magnetic field. The polarization plane of the radiation produced at different depths within the source is rotated over different angles by the Faraday effect and this results in a decrease in the measured degree of polarization. Faraday dispersion is depolarization due to fluctuations in the rotation measure within a beam, caused by the turbulent magnetic field and distribution of thermal electrons along the line of sight. When this dispersion is intrinsic to the source, it is called internal Faraday dispersion. In case of a dispersion in an external screen it is called external Faraday dispersion. This depolarization effect may be responsible for the north-south asymmetry in the polarized emission from M33, if an asymmetry in distribution of the foreground magneto-ionic medium exists. However, as M33 cannot be resolved in the available foreground surveys, like RM [21] and H (Wisconsin H mapper) surveys, we do not discuss this depolarization further. Finally rotation measure gradients on the scale of the beam or larger due to systematic variation in the regular magnetic field can also lead to depolarization. The regular field in M33 is not strong enough nor is the inclination of the galaxy high enough for this effect to be significant [in contrast the highly regular field of the strongly inclined galaxy M31 does produce strong RM gradients, 20].
The depolarization due to internal Faraday dispersion [given by 35] is
| (10) |
where the dispersion in rotation measure is , with the pathlength through the ionized medium, the filling factor of the Faraday-rotating gas along the line of sight [ 0.5, 3], and the turbulent scale [ 50 pc, 26]. Using the H emission measure () and a clumping factor describing the variations of the electron density, can be determined by . For the local interstellar medium, [24] found . Assuming a thickness of kpc for the thermal electrons in the disk of the galaxy [the Galactic value, 14] and correcting for the inclination of M33, pc. Then the extinction corrected H () map of M33 [38] generates a distribution of across the galaxy with a mean value of 0.05 cm-3 and a most probable value of 0.03 cm-3 (Fig. 10), that is in agreement with the estimated values in our galaxy [14] and other nearby galaxies [23, 18]. Note that a more realistic approach would consider different filling factors and electron densities for the thin and thick disk of the galaxy. However, because the only information we have is a superposition of these components along the line of sight, we are not able to distinguish the role of each component. The resulting and obtained in Sect.4.3 (Fig. 8) enable us to estimate DPr at 3.6 and 20 cm. The left-bottom panel in Fig. 11 shows the ratio of DPr at 20 and 3.6 cm.

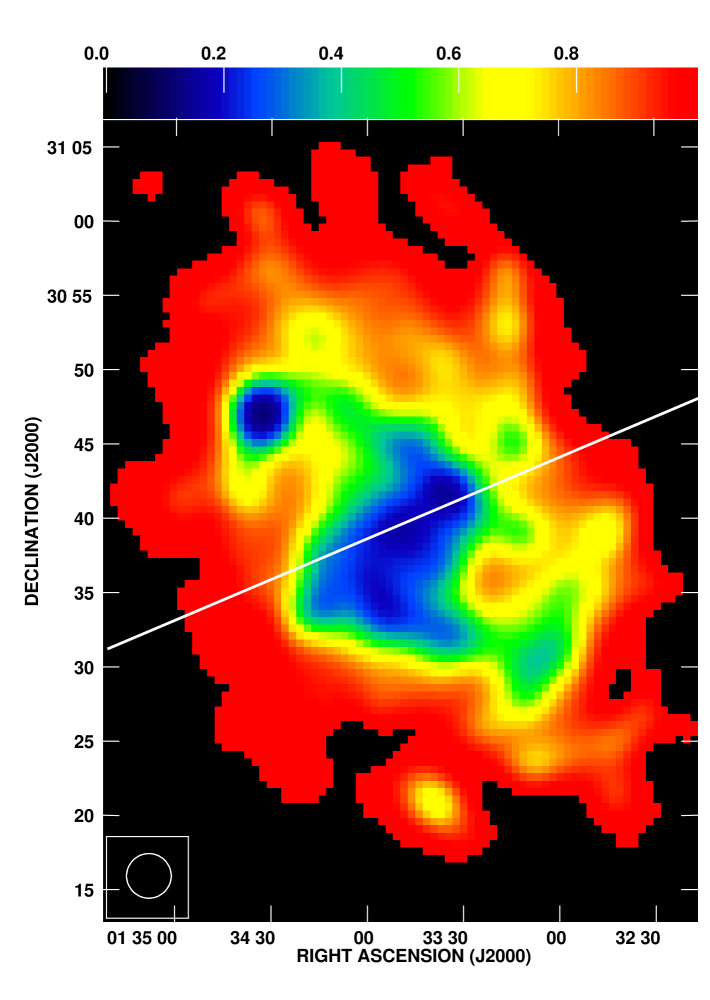
The other Faraday depolarization effect that is strong in M33, differential Faraday rotation, is given by [9] and [35] as,
| (11) |
where for simplicity we assume that the disk of M33 can be represented as a uniform slab. Using the RMi map in Fig. 3, we estimated DPu between 20 and 3.6 cm across the galaxy (Fig. 11, bottom-right). As small variations in RMi produce large changes in the sinc function in Eq. (11), the resulting is not smoothly distributed among neighboring pixels.
Qualitatively, both kinds of Faraday depolarization contribute to the observed depolarization in M33. The global phenomenon, the north-south asymmetry, is visible in both DPu as weaker depolarization (DP) in the north and also in DPr as stronger depolarization (DP) in the south part of the central region. However, locally e.g. at the positions of HII complexes and the southern spiral arms, DPr could explain the observed depolarization. The contributions of DPu and DPr vary region by region. A more quantitative comparison requires a combination of DPu and DPr across the galaxy, but this needs a detailed modelling of depolarization along with distribution of the filling factors and , the pathlength , and the turbulent scale across the galaxy.
In the south of M33, a strong turbulent condition was already indicated from the HI line-widths being larger than in the north [17], which could be connected to the high starformation activities in the southern arms particularly in the main arm I S [39]. Hence, we conclude that the highly turbulent southern M33 along with a magneto-ionic medium containing vertical regular magnetic fields, reduce the degree of polarization of the integral emission from the southern half and cause the wavelength-dependent north-south asymmetry in polarization (or depolarization).
6 Discussion
6.1 Vertical magnetic fields
The model regular magnetic field described in Table LABEL:tab:fit and shown in Fig. 7 has a vertical component in each ring. In the inner ring, the combination of the modes and stronger produces a sinusoidal vertical field that is strongest near the major axis: pointing away from us at and towards us at . In the outer ring the vertical field is also strongest near the major axis, at (directed away) and (directed towards).
The presence of a vertical component to the regular magnetic field was already indicated locally by our rotation measure maps (Sect. 3). However, the large scale vertical field required by our fits requires a global origin. The strong along the major axis together with the large line of sights through the magneto-ionic medium on the eastern and western minor axis (Sect. 3) suggest that warp may play a role. In other words, the ‘vertical’ field that we identify may be due to the severe warp in M33 [29, 27, 31, 13]. The inner HI disk investigated by [29], shows a warp beginning at a radius of 5 kpc with a change in the inclination angle of at 8 kpc. The warp of the optical plane begins as close to the center as the first arm system at 2 kpc (the center of our inner ring), with a change in the arm inclination of at 3 kpc and at 5 kpc [31]. The model in Sect. 4.2 assumes a constant inclination of but in a strongly warped disc varies with radius and azimuth. In this case, even if only has components in the warped disk plane , as for e.g. M51 [6], M31 [20], and NGC6946 [3], there will be an apparent vertical component (as well as an apparent disk parallel component ) with respect to the average disk-plane.
The ratio where is the warp inclination. So for in the inner ring and in the outer ring gives . Our model field in Table LABEL:tab:fit has in the ring –kpc and in the ring –kpc. This indicates that, in the outer ring, the vertical field could be mainly due to the warp. However, a real vertical field of a broadly comparable strength to the disk field can exist in the inner ring.
6.2 Magnetic and spiral-arm pitch angles
The pitch angles of the horizontal component of the regular magnetic field are high: in the ring 1–3 kpc and in the ring 3–5 kpc. These magnetic field pitch angles are however lower than the pitch angles of the optical arm segments identified by Sandage & Humphreys [31], which are typically –. A combination of shear from the differential rotation, producing an azimuthal magnetic field with , and compression in spiral arm segments, amplifying the component of the field parallel to the arms , may be responsible for the observed . However, this type of alternate stretching and squeezing of the field could not produce the azimuthal mode that is found in both rings, unless the pre-galactic field was of this configuration. The presence of a significant azimuthal mode of can be explained if a large-scale galactic dynamo is operating in M33: the axisymmetric mode has the fastest growth rate in disk dynamo models [e.g. 4]. This does not mean that a dynamo is the origin of all of the regular magnetic field structure in M33. In particular it would be a strange coincidence if the large , higher than the typical in other disc galaxies by a factor of , is not connected to the open spiral arms with .
A rough estimate of the magnetic field pitch angles expected due to a simple mean-field dynamo can be obtained by considering the ratio of the alpha-effect — parameterizing cyclonic turbulence generating radial field from azimuthal — to the omega-effect — describing differential rotation shearing radial field into azimuthal. This can be written as [33]
| (12) |
where is a typical velocity of the helical turbulence, is the scale height of the dynamo active layer and gives the shear rate due to the angular velocity . Using the HI rotation curve derived by [12], as a typical value [30], and an HI scale height of 250pc at =2kpc increasing steadily to 650pc at =5kpc [1] we obtain approximate pitch angles of and for the rings 1-3 and 3-5 kpc, respectively. These are only about 1/2 to 1/3 of the fitted pitch angles of the m=0 modes. Models specific to M33, which allow for dynamo action as well as the large scale gas-dynamics of the galaxy, are required to understand the origin of the large as well as the vertical component of the regular magnetic field.
6.3 Energy densities in the ISM

The energy densities of the equipartition magnetic fields in the disk ( and for the total and regular magnetic fields, respectively) are shown in Fig. 12. The thermal energy density of the warm ionized gas, , is estimated from the H map assuming K (see also Sect. 5). Assuming the pressure equilibrium between the warm and hot ionized gas with K and an electron density of [e.g. 19], the energy density of the hot ionized gas is about the same order of magnitude as the warm ionized gas energy density. For the neutral gas, we derive the energy density of using the average surface density of total (molecular + atomic) gas given by [11] and an average temperature of K [40]. The warm neutral gas with a typical temperature of K has roughly the same thermal energy density as the cold neutral gas, due to a times smaller density [e.g. 19]. Assuming a constant scale height of the disk of 100pc [as used for NGC6946 3], we obtain a gas density of 6 cm-3 at R=1 kpc (that is about 8 times smaller than the corresponding value in NGC6946) to 2 cm-3 at R=5 kpc (about 3.5 times smaller than that in NGC6946)555Hence, the radial profile of the energy density of the neutral gas is much flatter in M33 than in NGC6946 [see Fig. 5 in 3]. The total thermal energy density shown in Fig. 12 includes the contribution of the warm, hot ionized and the cold, warm neutral gas. Figure. 12 also shows the kinetic energy density of the turbulent motion of the neutral gas estimated using a turbulent velocity of 10 km s-1 [13, 25].
Generally, the energy densities of all components are about the same order of magnitude as in the Milky Way [15], but one order of magnitude smaller than in NGC6946 [3]. The small thermal energy density compared to the total magnetic field energy density shows that the M33’s ISM is a low plasma [ is defined as the thermal to magnetic energy density ratio, similar results were found in the Milky Way and NGC6946 15, 3]. On the other hand, the small thermal energy density compared to that of the turbulent motions indicates that turbulence in the diffuse ISM is supersonic [as in NGC6946 3]. This is in agreement with 3-D MHD models for the ISM [16].
The energy densities of the total magnetic field and turbulent gas motions are about the same. This hints to the generation of interstellar magnetic fields from turbulent gas motions for R8 kpc in M33. For a comparison at larger radii, detection of the magnetic fields is required using deep surveys of Faraday rotation of polarized background sources. This seems to be promising as the scale length of the total magnetic field [24 kpc, 38] is much larger than the present detection limit of the radio emission.
The energy density of the regular field is about 3–7 times smaller than that of the total field. Furtheremore, it shows more variations with radius than the total field strength, with a maximum increase at kpc.
6.4 Comparison with M31
Comparing magnetic fields in our neighbors, M33 and M31, is instructive specially because a similar method was used to find out the 3-D magnetic field structure in both galaxies. It is interesting to see that the total magnetic field strength is about the same in M33 and M31 (G), but the regular field strength in M33 is about half of that in M31 (G). Furthermore, in contrast to M33, M31 has a disk plane parallel regular field without a vertical component. In other words, the large-scale magnetic field is well-ordered and strong relative to the small-scale field in M31. The regular magnetic field is fitted by a dominant m=0 mode in M31 [20] that is much stronger than that in M33.
The larger pitch angles of the horizontal magnetic field in M33 than in M31 is not due to a smaller shear in M33. From their rotation curves [10, 12], the shear rate at the relevant radii is larger in M33 ( km s-1 kpc-1 at kpc) than in M31 ( 6 km s-1 kpc-1 at kpc).
The fact that M33 has a higher star formation efficiency than its 10-times more massive neighbor, M31, may be a clue to the origin of their differences. Strong starformation activities in the inner part of M33 could cause vertical distribution of magneto-ionic matter and hence the vertical magnetic field. Furthermore, stronger turbulence in the interstellar medium can be generally caused by high starformation rate increasing the dynamo alpha-effect and hence providing large pitch angles of the horizontal magnetic field.
7 Summary
The distributions of linearly polarized intensity and polarization angle at 3.6, 6.2, and 20 cm along with the maps of nonthermal intensity and nonthermal spectral index [obtained from the new separation method, 38] yielded high-resolution distributions of RM, nonthermal degree of polarization, and Faraday depolarization in M33. Furthermore, we derived the 3-D structure of the regular magnetic field by fitting the observed azimuthal distributions of the polarization angle within two rings of 2 kpc width in the radial range 1 to 5 kpc. The main results and conclusions are as follows:
-
1.
The average nonthermal degree of polarization is P 10% (at 3.6 cm) for kpc and in parts of the magnetic filament. Due to Faraday depolarization Pnth decreases to 6% at 20 cm.
-
2.
The intrinsic Faraday rotation shows larger small-scale variations and weaker correlation with PI in the south than in the north of M33. The higher starformation activity in the southern arms could increase the turbulent velocities of interstellar clouds and disturb the regular field configuration. On the other hand, a good correlation between RMi and PI in the magnetic filament in the north-west of M33 shows that here the magnetic field is mainly regular.
-
3.
The average equipartition strengths of the total and regular magnetic fields are G and G for kpc. The regular magnetic field strength is higher within the ring at kpc, which contains the magnetic filament that has a maximum regular field of G. Strong turbulent magnetic fields (G) occur in the extended central region and the arms I S and part of II S.
-
4.
The 3-D structure of the regular magnetic field can be explained by a combination of azimuthal modes of in the ring 1–3 kpc and in the ring 3–5 kpc. The horizontal magnetic field component follows an arm-like pattern with pitch angles smaller than those of the optical arm segments, indicating that large-scale gas-dynamical effects such as compression and shear are not solely responsible for the spiral magnetic lines. The significant axisymmetric mode (m=0) in both rings indicates that galactic dynamo action is present in M33.
-
5.
The presence of vertical magnetic fields, shown by the best-fit model of the 3-D field structure () and indicated by the Faraday rotation distribution across the galaxy, is possibly due to both global (e.g. M33’s warp or interaction with M31) and local (e.g. starformation activities, Parker loops) phenomena. The warp can better explain the origin of the vertical field in the outer ring (3–5 kpc).
-
6.
In the southern half of M33, an excess of differential Faraday rotation together with strong Faraday dispersion seem to be responsible for the north-south asymmetry in the observed depolarization (which is wavelength dependent).
-
7.
The energy densities of the magnetic field and turbulence are about the same, confirming the theory of generation of interstellar magnetic fields from turbulent gas motions. Furthermore, it seems that the ISM in M33 can be characterized by a low plasma and dominated by a supersonic turbulence, as the energy densities of the magnetic field and turbulence are both higher than the thermal energy density.
Acknowledgements.
We are grateful to E. M. Berkhuijsen, U. Klein and E. Krügel for valuable and stimulating comments. FT was supported through a stipend from the Max Planck Institute for Radio Astronomy (MPIfR). AF thanks the Leverhulme Trust for financial support under research grant F/00 125/N.References
- Baldwin [1981] Baldwin, J. E. 1981, in Structure and Evolution of Normal Galaxies, ed. S. M. Fall & D. Lynden-Bell, 137–147
- Beck [1979] Beck, R. 1979, Ph.D. Thesis, Rheinische Friedrich-Wilhelms-Universitaet, Bonn.
- Beck [2007] Beck, R. 2007, A&A, 470, 539
- Beck et al. [1996] Beck, R., Brandenburg, A., Moss, D., Shukurov, A., & Sokoloff, D. 1996, ARA&A, 34, 155
- Beck & Krause [2005] Beck, R. & Krause, M. 2005, Astronomische Nachrichten, 326, 414
- Berkhuijsen et al. [1997] Berkhuijsen, E. M., Horellou, C., Krause, M., et al. 1997, A&A, 318, 700
- Broten et al. [1988] Broten, N. W., MacLeod, J. M., & Vallee, J. P. 1988, Ap&SS, 141, 303
- Buczilowski & Beck [1991] Buczilowski , U. R. & Beck , R. 1991, A&A, 241, 47
- Burn [1966] Burn, B. J. 1966, MNRAS, 133, 67
- Carignan et al. [2006] Carignan, C., Chemin, L., Huchtmeier, W. K., & Lockman, F. J. 2006, ApJ, 641, L109
- Corbelli [2003] Corbelli, E. 2003, MNRAS, 342, 199
- Corbelli & Salucci [2007] Corbelli, E. & Salucci, P. 2007, MNRAS, 374, 1051
- Corbelli & Schneider [1997] Corbelli, E. & Schneider, S. E. 1997, ApJ, 479, 244
- Cordes & Lazio [2002] Cordes, J. M. & Lazio, T. J. W. 2002, ArXiv Astrophysics e-prints
- Cox [2005] Cox, D. P. 2005, ARA&A, 43, 337
- de Avillez & Breitschwerdt [2007] de Avillez, M. A. & Breitschwerdt, D. 2007, ApJ, 665, L35
- Deul & van der Hulst [1987] Deul, E. R. & van der Hulst, J. M. 1987, A&AS, 67, 509
- Dumke et al. [2000] Dumke, M., Krause, M., & Wielebinski, R. 2000, A&A, 355, 512
- Ferrière [2001] Ferrière, K. M. 2001, Reviews of Modern Physics, 73, 1031
- Fletcher et al. [2004] Fletcher, A., Berkhuijsen, E. M., Beck, R., & Shukurov, A. 2004, A&A, 414, 53
- Johnston-Hollitt et al. [2004] Johnston-Hollitt, M., Hollitt, C. P., & Ekers, R. D. 2004, in The Magnetized Interstellar Medium, ed. B. Uyaniker, W. Reich, & R. Wielebinski, 13–18
- Krause [1990] Krause, M. 1990, in IAU Symposium, Vol. 140, Galactic and Intergalactic Magnetic Fields, ed. R. Beck, R. Wielebinski, & P. P. Kronberg, 187–196
- Krause et al. [1989] Krause, M., Hummel, E., & Beck, R. 1989, A&A, 217, 4
- Manchester & Mebold [1977] Manchester, R. N. & Mebold, U. 1977, A&A, 59, 401
- Milosavljević [2004] Milosavljević, M. 2004, ApJ, 605, L13
- Ohno & Shibata [1993] Ohno, H. & Shibata, S. 1993, MNRAS, 262, 953
- Reakes & Newton [1978] Reakes, M. L. & Newton, K. 1978, MNRAS, 185, 277
- Reich [2006] Reich, W. 2006, ArXiv Astrophysics e-prints
- Rogstad et al. [1976] Rogstad, D. H., Wright, M. C. H., & Lockhart, I. A. 1976, ApJ, 204, 703
- Ruzmaikin et al. [1988] Ruzmaikin, A. A., Sokolov, D. D., & Shukurov, A. M., eds. 1988, Astrophysics and Space Science Library, Vol. 133, Magnetic fields of galaxies, Chapter VI.4
- Sandage & Humphreys [1980] Sandage, A. & Humphreys, R. M. 1980, ApJ, 236, L1
- Segalovitz et al. [1976] Segalovitz, A., Shane, W. W., & de Bruyn, A. G. 1976, Nature, 264, 222
- Shukurov [2004] Shukurov, A. 2004, ArXiv Astrophysics e-prints
- Simard-Normandin & Kronberg [1980] Simard-Normandin, M. & Kronberg, P. P. 1980, ApJ, 242, 74
- Sokoloff et al. [1998] Sokoloff, D. D., Bykov, A. A., Shukurov, A., et al. 1998, MNRAS, 299, 189
- Tabara & Inoue [1980] Tabara, H. & Inoue, M. 1980, A&AS, 39, 379
- Tabatabaei et al. [2007a] Tabatabaei, F. S., Beck, R., Krause, M., Krügel, E., & Berkhuijsen, E. M. 2007a, Astronomische Nachrichten, 328, 636
- Tabatabaei et al. [2007b] Tabatabaei, F. S., Beck, R., Krügel, E., et al. 2007b, A&A, 475, 133
- Tabatabaei et al. [2007c] Tabatabaei, F. S., Krause, M., & Beck, R. 2007c, A&A, 472, 785
- Wilson et al. [1997] Wilson, C. D., Walker, C. E., & Thornley, M. D. 1997, ApJ, 483, 210