Temporal self-restoration of compressed optical filaments
Abstract
We numerically investigate the propagation of a self-compressed optical filament through a gas-glass-gas interface. Few-cycle light pulses survive a sudden and short order-of-magnitude increase of nonlinearity and dispersion, even when all conservative estimates predict temporal spreading or spatial breakup. Spatio-temporal distortions are shown to self-heal upon further propagation when the pulse refocuses in the second gas. This self-healing mechanism has important implications for pulse compression techniques handled by filamentation and explains the robustness of such sources.
The physics of ultrashort optical filaments has recently received increased attention as it enables self-compression of intense laser pulses into the few-cycle regime Hauri et al. (2004); Stibenz et al. (2006); Skupin et al. (2006); Champeaux and Bergé (2003); Zaïr et al. (2007); Kosareva et al. (2008); Bergé and Skupin (2008). Femtosecond pulses with input powers close to the self-focusing threshold, , indeed produce a single filament in which the spectrum broadens and the pulse duration decreases upon propagation. Experimental Stibenz et al. (2006); Skupin et al. (2006) as well as theoretical work Kosareva et al. (2008); Bergé and Skupin (2008) indicated that self-compression occurs in a limited parameter range, and small deviations from these ideal conditions may either cause spatial breakup into multiple filaments or temporal splitting of the pulse. For evidencing self-compression, experiments currently employ Brewster-windowed cells filled with noble gas at pressures controlling the ratio of input power over critical. Diagnostics are furthermore placed several tens of cm beyond the sample, making the pulse undergo a last stage of atmospheric propagation. A crucial point is then to preserve the main characteristics of the compressed pulse when it exits the output window. Several points concerning this issue, however, remain unclear. First, the pulse entering the glass sample undergoes a nonlinear index being three decades higher than in the gas. This renders the robustness of the exiting optical structure questionable as a light beam with several thousands of critical powers is expected to immediately break up by modulational instability Bespalov and Talanov (1966); Campillo et al. (1973); Bergé et al. (2003); Fibich et al. (2005). Second, the much stronger dispersion of glass should severely alter the temporal compression. For instance, a 1 mm thick sample with group-velocity dispersion (GVD) coefficient fs2/cm at 800 nm can double the duration of a 8 fs transform-limited Gaussian pulse Agrawal (2001).
In the following we will show that despite these apparent sources of instability, filamentary propagation holds a hidden self-healing mechanism for ultrashort pulses. Comparable phenomena have already been observed in several physical areas, e.g., in solid-state dynamics on atomic scales Gerde and Marder (2001) and in plasma physics under magnetic confinement Narihara et al. (2001), explaining stabilization mechanisms in apparently unstable systems. In optics, spatial self-restoration of Bessel beam profiles Bouchal et al. (1998) and of filament cores Kolesik and Moloney (2004); Dubietis et al. (2004) have also been reported. In contrast to all these previous observations, we report on simultaneous spatio-temporal self-restoration of light bullets having experienced a perturbation that should have immediately caused spatial and temporal decay of the filament. In this Letter we identify the changes in a self-compressed filament when it leaves a cell filled with argon, propagates in a mm long silica window, and finally travels through the atmosphere. We show that glass-dispersion acts jointly with the Kerr response to widely stretch the pulse in time. Unexpectedly, the filament eventually recompresses in air to restore temporal profiles with few-cycle durations. This self-healing mechanism has not an anecdotic character, as it can be responsible for the remarkably short pulse durations seen in many self-compression experiments.
Propagation equations model the forward component of the pulse envelope, , coupled with the free electron density, Bergé et al. (2007)
| (2) |
where , is the propagation variable and the retarded time in a reference frame moving with group velocity at laser mid-frequency ; , , and Brabec and Krausz (1997). is the dispersion operator formally involving the derivatives . Linear dispersion curves are taken from Refs. Dalgarno and Kingston (1960); Agrawal (2001); Peck and Reeder (1972) for argon, silica and air, respectively. At 800 nm, takes the value 1 for gases and 1.45 for glass. The leading GVD term in [] is about three orders of magnitude larger in glass than in the two gases; cm-3 is the critical plasma density. The nonlinear Kerr response contains only an instantaneous contribution, , when the pulse self-focuses in argon. It includes a Raman-delayed contribution, , with ratio in silica Zozulya et al. (1999); Sprangle et al. (2002) and in air Champeaux et al. (2008). Plasma sources are driven by the PPT ionization rate Perelomov et al. (1966) in argon and air, and by the Keldysh rate for crystals in glass Keldysh (1965). In the argon cell we assume a uniform pressure of 0.5 bar, leading to a nonlinear Kerr index cm2/W at 800 nm. The Kerr index for glass is cm2/W and cm2/W in air at atmospheric pressure Champeaux et al. (2008). All other parameter values used in this paper, including ionization potentials , avalanche cross-sections , neutral densities , and electron recombination time for silica , can be found in Ref. Skupin et al. (2006) (argon) and Ref. Bergé et al. (2007) (glass, air). Simulations have been performed in full 3D () and radially-symmetric () geometries, yielding analogous results. The starting pulse, being Gaussian, is focused by a lens of focal length cm into an argon cell with a 1.5 m maximum length. Input waist at 1/e2 and full width at half-maximum (FWHM) duration are m and fs. The input power is equal to one critical power in argon, i.e., GW. The following analysis is divided into three steps devoted to pulse propagation in argon, inside the silica window, and propagation in air.
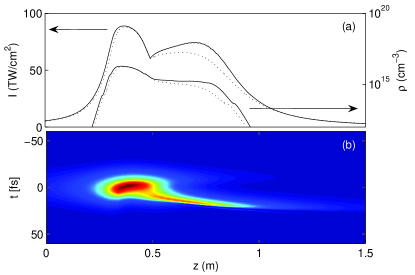
1. Filamentation in argon. With one critical power, the pulse develops a light bullet dynamics Bergé and Skupin (2008), characterized by a primary focusing sequence, followed by a second, limited refocusing [Fig. 1(a)]. Minimum FWHM duration is attained when the plasma relaxes, and the filament is compressed to about 6 fs at m [Fig. 1(b)]. The three subplots of Fig. 1(c) show intensity distributions at distances and m where the on-axis fluence () reaches 1.7 J/cm2, 0.2 J/cm2, and 0.05 J/cm2, respectively. These distances define the effective length of the argon cell and the position of the exit glass window.
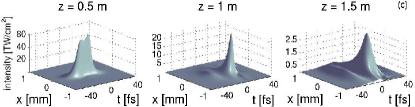
2. Crossing the silica window. At high enough fluences J/cm2, only a fraction of the forward pulse can be transmitted through a silica surface. According to Peñano et al. (2005), only 20 of the forward pulse is expected to transmit the glass surface at m, whereas this fraction increases to 90 and 100 for and 1.5 m, respectively. Conditions beyond m ( W/cm2) therefore avoid damage of silica Rayner et al. (2005). Figure 2(a) summarizes our results. Output profiles of Fig. 1(c) multiplied by the previous transmission rates are used as initial conditions of Eqs. (Temporal self-restoration of compressed optical filaments)-(2) solved for silica. 3D and radially-symmetric simulation results almost superimpose; hence, no severe spatial distortions affect the intensity profiles in the plane. The pulse captured at m (pulse I) begins to diffract over 1 mm, but it refocuses and collapses just afterwards. Although experimentally irrelevant, this extreme configuration already points out the importance of the first few mm of propagation dominated by pulse dispersion. Triggered by beam fluences J/cm2 in argon, the surface plasma created by pulse I should, however, act as a filter transmitting only the leading edge of the pulse Feit et al. (2004), thereby rendering the underlying assumption of a fixed temporal profile invalid. For pulses II and III having much lower fluences, assumption of a fixed profile still holds. In the following, we thus concentrate on these last two configurations only.
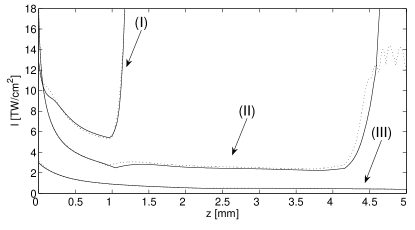
When the window is positioned at m (pulse II), again dispersion first prevails, but does not prevent beam collapse over 5 mm long paths. The input beam has a waist of 240 m and conveys time slices with a maximum power of , where = 2.19 MW denotes the critical power in glass. In contrast, the low-intensity pulse III disperses rather slowly over the same distance and beyond. The maximum input power, however, is still about 8000 , as the beam waist entering the sample has been enlarged to mm. Rows (II) and (III) of Fig. 2 depict the evolution of pulses II and III in the plane. Pulse II enters the dielectric with time extent of fs. After mm in silica, this pulse decays into a broader structure of fs, forming a pedestal that extends deep into the trailing region. After 1 mm, its duration increases to fs. Pulse III first exhibits a duration of 13 fs, which then broadens to 28 fs over 0.5 mm in glass and more afterwards.
It is important to note the complete absence of multifilamentation (MF) in our simulations. Estimates from modulational instability theory Campillo et al. (1973), however, predict an onset for MF and subsequent collapse upon short distances, mm, for peak intensities TW/cm2 impinging on the glass surface. In fact, as GVD rapidly damps the peak intensity, the amplification of periodic spatial modulations leading to MF is practically prevented. Here the plasma density plays a negligible role in the nonlinear index, as . We also numerically checked that high-order dispersion, pulse steepening and Raman scattering are of minor influence.
Besides, it turns out that both GVD and the Kerr response are responsible for the strong increase of the pulse duration that exceeds predictions by the well-known linear formula for Gaussian pulses, Agrawal (2001). Denoting the spatial and temporal radii of Gaussian pulses by and , respectively, a two-scaled variational principle applied to the reduced equation can help us understand these peculiar dynamics through the system Skupin and Bergé (2006)
| (3) |
In Eq. (3), and is the normalized GVD coefficient for the input filament with size and temporal radius . takes very large values when using durations and waists of pulses II and III. Since the growth of is driven by (dispersion) and (Kerr response), the beam collapse characterized by the vanishing at finite can efficiently be delayed in the limits . Indeed, the more increases, the less decreases. Moreover, Eq. (3) illustrates that both GVD and cubic nonlinearity contribute to enlarge the pulse duration. Typically, FWHM durations of fs are attained over 0.5 mm by the initially 8 fs long pulse II, whereas linear dispersion alone allows a temporal broadening limited to fs. For this pulse, broadening is more than doubled by the Kerr response. Hence, GVD disperses the pulse while at high powers the Kerr term stretches it in time. Combining both effects causes significant pulse broadening.
3. Air propagation. Because diagnostics are usually positioned tens of cm away from the cell, the beam finally propagates in atmosphere. Figures 3(a,b) show the temporal evolution of pulses II and III as they exit a 0.5 mm thick window and are fully transmitted in air. These two configurations are characteristic of filaments diagnosed either at moderately high intensities (II) or close to the end of the diffraction stage (III). Because these pulses contain time slices with maximum powers of in air, they eventually refocus and thus recompress, which is the core of the self-healing process. Pulse II attains intensities less than 50 TW/cm2 and triggers a minor plasma response. Pulse III involves much weaker intensities. The key-player of this process is the self-focusing mechanism alone, which amplifies the time slice with the largest power to the detriment of the others Bergé et al. (2007). Collapse is not arrested by plasma generation, but instead by Raman-scattering. The Raman-delayed response indeed doubles the effective power for self-focusing and delocalizes the pulse in time. At powers close to critical, this is sufficient to arrest the beam collapse. Figures 3(c,d) detail temporal profiles with FWHM durations of fs at m and fs at m for pulse II, and of fs and fs at 0.5 m and 1 m for pulse III. These durations are relatively stable since they hold over several tens of cm. They remain in the order of magnitude of those reported in the experiments Stibenz et al. (2006).
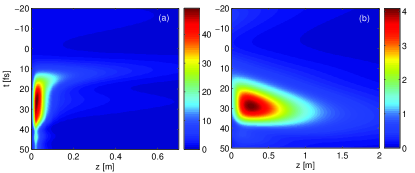
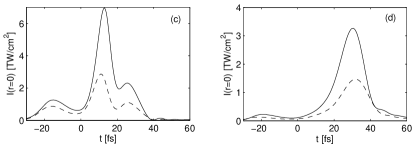
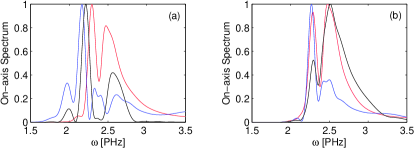
Figure 4 summarizes the history of on-axis spectra around the pump frequency ( PHz) along the propagation steps 1 to 3. Figure 4(a) describes pulse II, passing through the glass window and transmitted to air. The first focusing event in argon creates red- and blue-shifted spectral wings caused by self-phase modulation (red curve). Next, GVD drives the propagation in the dielectric, which lowers the saturation intensities and weakens self-phase modulation, such that the blueshifted wing drops out (blue curve). Figure 4(b) provides the same pieces of information for pulse III. At weaker intensities, the spectral evolution follows that of pulse II, although the properties expected from linear dispersion become more important and plasma turns off. Hence, on-axis spectra remain closer to those exiting argon.
It is worth emphasizing that other compressor schemes based, e.g., on an Ar-glass-Ar interface, were also numerically simulated (not shown). Increasing the pressure to 1 bar in the second argon cell guarantees a power above critical for pulse II, which then refocuses and follows a temporal evolution similar to that of Fig. 3(a). This underlines the generality of the self-healing mechanism.
In conclusion, numerical simulations cleared up the dynamics of self-compressed filaments when they cross a gas-glass-gas interface. After they are produced in a noble gas, they propagate over a few mm inside a silica window and run tens of cm in air before being measured. In the window, the interplay between dispersion and Kerr self-focusing inhibits multifilamentation and significantly increases pulse durations. Despite this large stretching in time, durations in the 10 fs range restore themselves upon further nonlinear propagation in air. This new self-healing mechanism acts both in space and time. Unlike previous scenarios where the perturbation is caused by loss mechanisms, such as raindrops, apertures or wire grids, the self-restoration is here induced by a discontinuity of the nonlinear properties inherent to the materials.
References
- Hauri et al. (2004) C. P. Hauri, W. Kornelis, F. W. Helbing, A. Heinrich, A. Couairon, A. Mysyrowicz, J. Biegert, and U. Keller, Appl. Phys. B: Lasers & Optics 79, 673 (2004).
- Stibenz et al. (2006) G. Stibenz, N. Zhavoronkov, and G. Steinmeyer, Opt. Lett. 31, 274 (2006).
- Skupin et al. (2006) S. Skupin, G. Stibenz, L. Bergé, F. Lederer, T. Sokollik, M. Schnürer, N. Zhavoronkov, and G. Steinmeyer, Phys. Rev. E 74, 056604 (2006).
- Champeaux and Bergé (2003) S. Champeaux and L. Bergé, Phys. Rev. E 68, 066603 (2003).
- Zaïr et al. (2007) A. Zaïr, A. Guandalini, F. Schapper, M. Holler, J. Biegert, L. Gallmann, A. Couairon, M. Franco, A. Mysyrowicz, and U. Keller, Opt. Express 15, 5394 (2007).
- Kosareva et al. (2008) O. G. Kosareva, N. A. Panov, D. S. Uryupina, M. V. Kurilova, A. V. Mazhorova, A. B. Savel’ev, R. V. Volkov, V. P. Kandidov, and S. L. Chin, Appl. Phys. B: Lasers & Optics 91, 35 (2008).
- Bergé and Skupin (2008) L. Bergé and S. Skupin, Phys. Rev. Lett. 100, 113902 (2008).
- Bespalov and Talanov (1966) V. I. Bespalov and V. I. Talanov, JETP Lett. 3, 307 (1966).
- Campillo et al. (1973) A. J. Campillo, S. L. Shapiro, and B. R. Suydam, Appl. Phys. Lett. 23, 628 (1973).
- Bergé et al. (2003) L. Bergé, C. Gouédard, J. Schjødt-Eriksen, and H. Ward, Physica D 176, 181 (2003).
- Fibich et al. (2005) G. Fibich, S. Eisenmann, B. Ilan, Y. Erlich, M. Fraenkel, Z. Henis, A. L. Gaeta, and A. Zigler, Opt. Express 13, 5897 (2005).
- Agrawal (2001) G. P. Agrawal, Nonlinear Fiber Optics (Academic Press, San Diego, 2001), 3rd ed.
- Gerde and Marder (2001) E. Gerde and M. Marder, Nature 413, 285 (2001).
- Narihara et al. (2001) K. Narihara et al., Phys. Rev. Lett. 87, 135002 (2001).
- Bouchal et al. (1998) Z. Bouchal, J. Wagner, and M. Chlup, Opt. Commun. 151, 207 (1998).
- Kolesik and Moloney (2004) M. Kolesik and J. V. Moloney, Opt. Lett. 29, 590 (2004).
- Dubietis et al. (2004) A. Dubietis, E. Kučinska, G. Tamošauskas, E. Gaižauskas, M. A. Porras, and P. Di Trapani, Opt. Lett. 29, 2893 (2004).
- Bergé et al. (2007) L. Bergé, S. Skupin, R. Nuter, J. Kasparian, and J. P. Wolf, Rep. Prog. Phys. 70, 1633 (2007).
- Brabec and Krausz (1997) T. Brabec and F. Krausz, Phys. Rev. Lett. 78, 3282 (1997).
- Dalgarno and Kingston (1960) A. Dalgarno and A. E. Kingston, Proc. Royal Soc. London A 259, 424 (1960).
- Peck and Reeder (1972) E. R. Peck and K. Reeder, J. Opt. Soc. Am. 62, 958 (1972).
- Zozulya et al. (1999) A. A. Zozulya, S. A. Diddams, A. G. Van Engen, and T. S. Clement, Phys. Rev. Lett. 82, 1430 (1999).
- Sprangle et al. (2002) P. Sprangle, J. R. Peñano, and B. Hafizi, Phys. Rev. E 66, 046418 (2002).
- Champeaux et al. (2008) S. Champeaux, L. Bergé, D. Gordon, A. Ting, J. Peñano, and P. Sprangle, Phys. Rev. E 77, 036406 (2008).
- Perelomov et al. (1966) A. M. Perelomov, V. S. Popov, and M. V. Terent’ev, Sov. Phys. JETP 23, 924 (1966).
- Keldysh (1965) L. V. Keldysh, Sov. Phys. JETP 20, 1307 (1965).
- Peñano et al. (2005) J. R. Peñano, P. Sprangle, B. Hafizi, W. Manheimer, and A. Zigler, Phys. Rev. E 72, 036412 (2005).
- Rayner et al. (2005) D. M. Rayner, A. Naumov, and P. B. Corkum, Opt. Express 13, 3208 (2005).
- Feit et al. (2004) M. D. Feit, A. M. Komashko, and A. M. Rubenchik, Appl. Phys. A: Materials Science & Processing 79, 1657 (2004).
- Skupin and Bergé (2006) S. Skupin and L. Bergé, Physica D 220, 14 (2006).