AAOmega radial velocities rule out current membership of the planetary nebula NGC 2438 in the open cluster M46
Abstract
We present new radial velocity measurements of 586 stars in a one-degree field centered on the open cluster M46, and the planetary nebula NGC 2438 located within a nuclear radius of the cluster. The data are based on medium-resolution optical and near-infrared spectra taken with the AAOmega spectrograph on the Anglo-Australian Telescope. We find a velocity difference of about 30 km s-1 between the cluster and the nebula, thus removing all ambiguities about the cluster membership of the planetary nebula caused by contradicting results in the literature. The line-of-sight velocity dispersion of the cluster is 3.90.3 km s-1, likely to be affected by a significant population of binary stars.
keywords:
planetary nebulae: general – open clusters and associations: general1 Introduction
Any physical associations discovered between planetary nebulae (PNe), the short-lived but spectacular late evolutionary stage of small and intermediate mass stars (between 1–8 M⊙), and star clusters would be a valuable discovery that provides a means of establishing accurate astrophysical parameters for the nebulae through fixing distances and progenitor ages from cluster isochrones. Accurate distances are particularly useful, from which one can infer PNe physical properties such as the absolute magnitude of the central stars, accurate physical dimensions and fluxes. Also, they would provide excellent calibrators for the surface brightness–radius relation (Frew & Parker 2006, Frew 2008). Whereas PNe have been found in 4 globular clusters of the Milky Way (M15, M22, Pal 6 and NGC 6441; Jacoby et al. 1997), none has been reported in the literature as an unambiguous member of a much younger open cluster (OC). The interest in the latter case is not only due to being able to determine independent distances to individual nebulae, but also because in a young open cluster the progenitor of a now-visible PN will be a reasonably constrained higher mass star than those in globular clusters. This fact offers the opportunity to calibrate the initial-to-final mass relation of stars on a broad range of masses, usually done by modelling white dwarf populations in open clusters (e.g. Weidemann 2000, Dobbie et al. 2006).
Recently, Majaess, Turner & Lane (2007; MTL07) and Bonatto, Bica & Santos Jr (2008; BBS08) have performed detailed investigations of possible physical associations between PNe and OCs. MTL07 considered the cluster membership for 13 PNe that are located in close proximity to open clusters lying in their lines of sight and listed another 16 PNe/open cluster coincidences, which might contain physically associated pairs. However, they noted that we have yet to establish a single association between a PN and an open cluster based on a correlation between their full set of physical parameters, including the three key parameters of radial velocity, reddening, and distance that need to be in good agreement if an association is to be viable. BBS08 used near-infrared colour-magnitude diagrams and stellar radial density profiles to study PN/open cluster association for four pairs. They concluded that the best, but still only probable, cases are those of NGC 2438/M46 and PK 16701/New Cluster 1. However, Parker et al. (in prep.) have uncovered another compelling case in an old open cluster that may prove the best candidate yet for a true OC-PN association.
NGC 2438 is a well-known annular PN located about 8 arcminutes from the core of the bright open cluster M46 (=NGC 2437; BBS08). Despite its brightness, the cluster was relatively unstudied until recently (e.g. Cuffey 1941; Stetson 1981). Recently published cluster parameters are relatively well-determined, e.g. =0.10-0.15, D =1.5-1.7 kpc and an age of 220-250 Myr (Sharma et al. 2006, MTL07, BBS08). The estimated turnoff mass is about 3.5 M⊙ (BBS08). In addition to the possible association with NGC 2438, M46 is also thought to host the well-studied post-AGB candidate OH 231.8+4.2 (Jura & Morris 1985).
Early studies of the radial velocity of NGC 2438 and M46 (Cuffey 1941; O’Dell 1963) indicated a difference of 30 km s-1 between the PN and cluster stars, which suggested that the pair constitues a spatial coincidence only. Three red giants in the cluster have systemic velocities (Mermilliod et al. 1989, 2007) identical to that of cluster dwarf members obtained by Cuffey (1941). However, Pauls & Kohoutek (1996) rekindled interest in the possibility of the PN/open cluster association when they found similar velocities for both, although based on a small number of stars. Both MTL07 and BBS08 pointed out the importance of measuring sufficient stellar radial velocities for the cluster and the PN to establish if the proximity is real or only chance superposition.
Previous distance estimates to the cluster and PN gave similar results though the distance estimates to the OC are far more accurate than the crude statistical estimates for the PN distance provided by Zhang (1995). A distance can be estimated based on the H surface brightness – radius (SB-) relation observed for PNe (e.g. Frew & Parker 2006; Frew 2008). Using an updated version of the relation first presented in Pierce et al. (2004), a distance of 1.40.4 kpc is estimated. Using instead the relation applicable to bipolar and bipolar core PNe (Frew, Parker & Russeil 2006), D = 1.9 0.5 kpc. These values are in broad agreement with other recent SB-r determinations in the radio domain, e.g. Van de Steene & Zijlstra (1995), D = 1.7 kpc, Zhang (1995), D = 2.1 kpc, Phillips (2004), D = 1.2 kpc, and Stanghellini, Shaw & Villaver (2008), D=1.2 kpc, and are all compatible with the cluster distances (MTL07, BBS08).
Because of the recently revived interest in possible OC-PN associations, we obtained new multi-object spectroscopic observations of M46 and NGC 2438, where a putative association has still not been satisfactorily resolved due to ambiguities and confusion in the literature. Here we present a statistically significant radial velocity sample of 586 stars within 0.5 degrees of the cluster centre. The data leave no doubt that the PN is not a member of the cluster.
2 Observations and data reduction
We used the AAOmega double-beam spectrograph on the Anglo-Australian Telescope in Siding Spring, Australia on February 17, 2008. The seeing on that night was about 1.5-2′′. In the blue arm we used the 2500V grating, providing spectra between 4800 Å and 5150 Å. These were important for measuring the mean and expansion velocities of the PN from the H and [OIII] lines. In the red arm we used the 1700D grating that has been optimized for recording the Ca II infrared triplet region. These spectra range from 8350 Å to 8790 Å, with . This setup has the highest spectral resolution available with AAOmega and hence the red spectra were used to measure stellar radial velocities.
| Field | Exp. time | mid-point | Cluster | PN |
|---|---|---|---|---|
| (min) | HJD | No. star | ||
| 1 | 40 | 2454513.918 | 282 | N/S rim |
| 2 | 65 | 2454513.957 | 304 | central star |
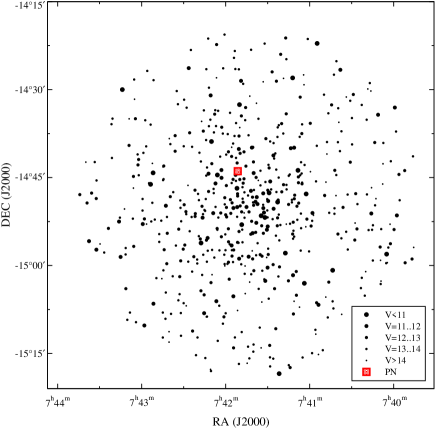
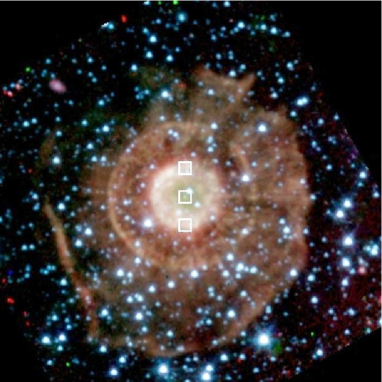
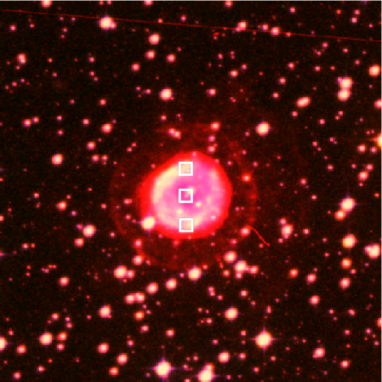
In total, we acquired two field configurations centered on the open cluster. The target stars were selected from the 2MASS point source catalogue (Skrutskie et al. 2006) by matching the main features in the colour-magnitude diagram of stars within the central 5 arc minutes. The total field of view was 1 degree across. We estimated and band magnitudes from the 2MASS magnitudes using the same set of linear transformations as in Kiss et al. (2007). The full magnitude range of the target stars in was from 10 mag to 15 mag, but for a single configuration we limited the brightness range to 3 mag in order to avoid cross-talk between the fibers due to scattered light. The log of observations is presented in Table 1. Fig. 1 shows the sky positions of the observed stars, while Fig. 2 depicts the three fiber positions across the face of the PN (because of the limitations of fibre to fibre proximity, the central star was in the first configuration, the northern and southern rim positions were in the second configuration). The upper panel of this figure is based on Spitzer/IRAC observations of NGC 2438 obtained from the Spitzer archive (Prog. ID: 68, “Studying Stellar Ejecta on the Large Scale using SIRTF-IRAC”, PI: G. Fazio). We downloaded the frames processed with the SSC IRAC Pipeline v14.0, and mosaics were created from the basic calibrated data (BCD) frames using a custom IDL program. For details see Gutermuth et al. (2008). As a comparison, the lower panel in Fig. 2 shows a deep H image (Parker et al. 2005), indicating that the Spitzer-based positions did indeed coincide with strong optical emission.
The spectra were reduced using the standard 2dF data reduction pipeline. We performed continuum normalization separately for the stellar spectra using the IRAF task onedspec.continuum and then cleaned the strongest skylines that had residuals left using linear interpolation of the surrounding continuum. The nebular spectra were extracted in instrumental fluxes only.
3 Analysis
3.1 Stellar spectra and velocities
Atmospheric parameters and radial velocity were determined for each star with an iterative process, which combined finding best-fit synthetic spectrum from the Munari et al. (2005) spectrum library, with fitting, and cross-correlating the best-fit model with the observed spectrum to calculate the radial velocity. This approach is very similar to that adopted by the Radial Velocity Experiment (RAVE) project (Steinmetz et al. 2006; Zwitter et al. 2008), and this analysis is based on the very same synthetic library as RAVE. Our experiences have shown that because of the wide range of temperatures (and hence spectral features), we needed three subsequent iterations to converge to a stable set of temperatures, surface gravities, metallicities and radial velocities. The latter are believed to be accurate within 1-2 km s-1 for the cooler stars and 5 km s-1 for the hotter stars in the sample (the boundary is roughly at 8000-9000 K). These values have been estimated from Gaussian fits of the cross-correlation profile using the IRAF task rv.fxcor and should only be considered as representative numbers.
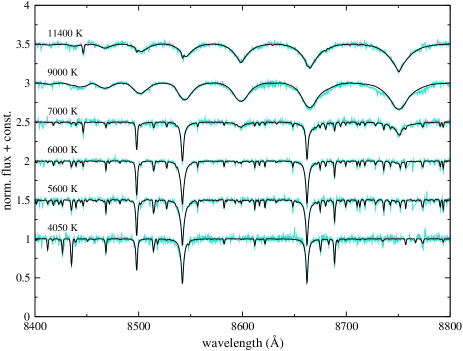
Although a full discussion of the derived stellar parameters will be presented elsewhere (Kiss et al., in prep.), we show sample spectrum fits in Fig. 3 to illustrate the difficulties one faces when analysing cool and hot stars together in the Ca II triplet region. Since the Ca II lines almost exactly coincide with hydrogen lines in the Paschen series, we found that it was absolutely crucial to have the best-match template for cross-correlation. A slightest template mismatch can easily lead to radial velocity shifts of several km s-1 at this intermediate spectral resolution and hence one has to be very careful to optimize template selection. It is a commonly used practice in the optical range that the same template is used across a range of spectral subtypes or even types. However, that does not work in the Ca II IR triplet region, where a full fit of the spectra is essential. It is also inevitable that as soon as the temperature reaches about 9000 K, the broad spectral features will lead to a degraded velocity precision simply because of the broadened cross-correlation profile. M46, as an intermediate-age open cluster, still hosts a large number of hotter main sequence stars and that implies the possibility of degraded velocity precision for a significant fraction of stars. But as we show later, we confirm the km s-1 velocity difference between the cluster and the PN, so that the temperature dependent velocity uncertainty does not play a role in relation to their physical association.
We also measured cross-correlation velocities from the lower resolution blue spectra. These data were less useful because most of the stars have a broad H line and a few weak features in the recorded wavelength range, leading to a broad cross-correlation profile and radial velocities accurate to only about 10 km s-1.
3.2 PN spectra and velocities

The spectra taken in the three positions across the PN depicted in Fig. 2 are typical of a planetary nebula. The blue range shows the three characteristic nebular emission lines, the H and the [O III] doublet at 4959 Å and 5007 Å, which are far the strongest features in the optical spectrum. The central spectrum shows well-defined double-peaked [O III] line profiles (upper panel of Fig. 4), which we used to determine the expansion velocity of the nebula, assuming a spherical shell. The two spectra on the edge have single-peaked emissions, centered exactly halfway between the two peaks of the central spectrum, supporting that assumption.
In the near-IR, the central position yielded a featureless flat continuum, while the two spectra from the shell contain an identical set of narrow emission lines (lower panel in Fig. 4). Using line identifications from the literature (Aller 1977; Rudy et al. 2001) and the NIST atomic database (Ralchenko et al. 2008), we identified the detected lines as the Paschen series of hydrogen (from P12 to P18), the [Cl II] nebular line at 8579 Å, and the N I line at 8729 Å.
Individual radial velocities have been measured by fitting Gaussian functions to the line profiles. In case of the double-peaked [O III] doublet, we fitted a sum of two Gaussians. In each case we repeated the centroid measurement by choosing slightly different fit boundaries to estimate the uncertainty: the strong emission lines in the blue yielded the same velocities within 1-2 km s-1 in several repeats, while the weak Paschen lines in the low S/N near-IR spectra were more sensitive to the actual choice of fitting limits, resulting in up to 3-5 km s-1 uncertainty per line.
4 Discussion
4.1 Cluster membership of the planetary nebula
The Spitzer image of NGC 2438 extracted from the archive is very reminiscent of that of M57 with the multiple outer shells of molecular hydrogen seen to extend well ouside the bounds of the well known optical image. Interestingly here, a deep optical H image from the SuperCOSMOS H-alpha Survey (Parker et al. 2005), Fig. 2 clearly show faint optical emission too that matches the inner shell and part of the faint outer shell to the west seen in the mid-infrared (see also fig. 7 in Corradi et al. 2003). The Spitzer data also reveal evidence of an interesting possible interaction of the molecular material with the ISM at the south-eastern edge of the PN, pointing more or less away from the center of the open cluster.
We present the measured PN emission line velocities in Table 2. The numbers show a very good agreement between the northern and the southern edges, suggesting a mean velocity of 782 km s-1. The only outlier is the P16 8502 line, however, that feature was significantly affected by the residual skylines at Å and their removal during the data reduction. The mean velocity value is also in perfect agreement with the average mid-point of the double-peaked [O III] lines in the centre (77.51 km s-1). We therefore adopt =782 km s-1 as the radial velocity of NGC 2438, which is in excellent agreement with other published velocities in the literature (77 km s-1, Campbell & Moore 1918; 744 km s-1, Meatheringham, Wood & Faulkner 1988; 745 km s-1, Corradi et al. 2000), as well as an unpublished determination of 736 km s-1 from a SAAO 1.9-m long-slit spectrum (Frew 2008). On the other hand, from the relative velocity difference between the two peaks in the [O III] profiles we measured an expansion velocity of 21.00.2 km s-1, virtually identical, for instance, to what Corradi et al. (2000) reported from high-resolution H and [O III] spectra (21 km s-1). In summary, our PN measurements draw a picture that agrees exceptionally well with other results in the literature, confirming the reliability of the determined velocities and the quoted uncertainties.
| Line | PN central | PN north | PN south |
|---|---|---|---|
| (km s-1) | (km s-1) | (km s-1) | |
| H 4861 | 76.1 | 80.1 | |
| O III 4959 | 58.7, 100.2 | 78.6 | 79.8 |
| O III 5007 | 55.6, 98.2 | 77.6 | 77.6 |
| P16 8502 | 68.1 | 58 | |
| P15 8545 | 75.5 | 76.5 | |
| P14 8598 | 72.1 | 84.4 | |
| P13 8665 | 74.3 | 79.5 | |
| P12 8750 | 73.1 | 76.5 |

Fig. 5 compares the mean PN velocity to the histogram of the newly derived cluster star velocities that represent the most extensive and accurate such data for M46 obtained to date. We confirm the early results that NGC 2438 has a relative velocity of about 30 km s-1 with respect to the cluster (O’Dell 1963), hence the nebula is not a bound member of the cluster despite being located approximately at the same 1.5-1.7 kpc distance (MTL07, BBS08). In Fig. 5 we also put an arrow at the mean center-of-mass velocity (48.5 km s-1) of three red giant binaries measured by Mermilliod et al. (1989, 2007). The excellent agreement between the maximum of the histogram (49 km s-1 for the highest value, 48 km s-1 for the centroid of the fitted Gaussian) and the very accurate CORAVEL data confirms both the cluster membership of those systems and the quoted accuracy of our single-epoch velocity measurements. We also note that while this paper was under review, a new cluster radial velocity was published by Frinchaboy & Majewski (2008), who measured +46.91.0 km s-1 from 19 member stars. The nice agreement gives further support to our results.
We examined the possibility that the progenitor of NGC 2438 was a runaway star that has been ejected from M46, since it is the only option for maintaining possible physical association of the cluster and the PN. Runaway stars escape from star clusters with velocities of typically 30 km s-1 (Blaauw 1961; Hoogerwerf, de Bruijne & de Zeeuw 2001) and one cannot ad hoc exclude the possibility that something similar has happened in M46. However, we feel this to be quite unlikely. If we assume a binary-supernova scenario as a possible explanation, then the SN must have happened 170-200 Myr ago (i.e. the cluster age minus the evolutionary age of a progenitor star of 8 M⊙, the lower limit for a core-collapse SN). A star travelling at 30 km s-1 for this time traverses 5-6 kpc in the absence of other forces, so that it should have left the apparent vicinity of the cluster a long time ago, unless its radial velocity is almost perfectly aligned along the line-of-sight. The other possibility could be a very recent ejection, most likely within the last couple of million years, as part of a binary-binary dynamical ejection event. However, the dynamical ejection scenario (DES) requires a high-density environment in which close encounters of binaries can happen more frequently: young open clusters or OB associations forming massive stars (Hoogerwerf, de Bruijne & de Zeeuw 2001). M46 is neither young nor has an exceptional high density compared to other intermediate-age open clusters. Ultimately, future proper motion measurements could be used to distinguish between the option of chance projection and the option of runaway star.
In summary, while past membership of the progenitor cannot be completely ruled out, we can safely conclude against present membership of the PN in the cluster.
4.2 Evidence of a significant binary population of the cluster
We also noted the surprisingly large velocity dispersion of the cluster, indicated by the broad cluster peak of the histogram. While some of it might be explained by the degraded velocimetric accuracy for the hotter stars (cf. Sect. 3.1), the full range between 35 km s-1 and 60 km s-1 seems to be too large as purely due to measurement errors. We quantified the velocity dispersion by fitting two Gaussians to the histogram, one broad and one narrow to represent the galactic background and the cluster members, respectively. The resulting line-of-sight velocity dispersion of the cluster is 3.90.3 km s-1 (removing 78 stars with 10000 K changes the result to 3.80.2 km s-1). This is a very high value for a relatively old open cluster and suggests the presence of many binaries. The velocity dispersion of the broad Gaussian is 18.4 km s-1, which is consistent with field stars predominantly in the thin disk (Veltz et al. 2008).
As a simple exercise, we estimated the dynamical mass of the cluster using the equation where is the half-light radius, is the gravitational constant, and is a dimensionless constant (Spitzer 1987). With this we also make the assumption that the cluster is in virial equilibrium, which is most likely the case, given that clusters older than 50 Myr are expected to be in virial equilibrium (e.g. Goodwin & Bastian 2006). A rough estimate for the half-light radius of M46 can be taken as the core radius of 3.3 pc (Sharma et al. 2006). Similarly, about half of the likely members in our spectroscopic sample lie within 3.4 pc to the cluster centre. Assuming =3.3 pc and the canonical , the result is 1.1105 M⊙.
On the other hand, adopting =6.1 mag from SIMBAD and 11.2 mag, the resulting absolute brightness mag corresponds to 8800, leading to 0.1, which is way too low for any stellar cluster (see, e.g., fig. 5 in Goodwin & Bastian 2006). Therefore, the dynamical mass must be grossly overestimated, which is a well-known effect when a significant binary population exists in a cluster (for a recent study see, for instance, Kouwenhoven & de Grijs 2008). Other evidence that points in this direction was mentioned by Sharma et al. (2006), who noted that the broad main-sequence in the colour-magnitude diagram could be due to the presence of binary stars. In that case orbital motion can introduce extra velocity scatter, which can lead to significantly overestimated dynamical masses.
One caveat is the neglected effect of the radial velocity errors on the velocity dispersion. If the real errors are much larger than the quoted formal errors from the cross-correlation (cf. Sect. 3.1), then the velocity dispersion could be dominated by measurement errors, hence getting only an upper limit to and and a lower limit on . Our experiences with the same instrument and data on other, mostly globular, star clusters (Kiss et al. 2007; Székely et al. 2007) showed that high S/N AAOmega spectra can reproduce published radial velocities with the quoted 1–2 km s-1 accuracy for stars cooler than 6000 K. For M46, we have neither repeated observations nor independent measurements with other instruments to check the precision and the accuracy of the velocities, but with the good S/N for most of the data, we are confident that the dispersion is not dominated by the measurement errors.
5 Summary and future work
The results of this paper can be summarized as follows:
-
1.
We have obtained medium-resolution optical and near-infrared spectroscopy for the open cluster M46 and the putative associated planetary nebula NGC 2438. A careful analysis of the data firmly established a mean radial velocity difference of about 30 km s-1 between the two objects. While the available data do not rule out past physical association if the star has been ejected, their mutual distance is currently increasing at least by 30 pc/Myr, hence rejecting present membership of the nebula.
-
2.
The histogram of the radial velocities has been fitted with a sum of two Gaussians, representing the smooth galactic field and the cluster. Roughly half of the 586 stars belong to the cluster, while the rest has a velocity dispersion of about 18.4 km s-1, that is characteristic for the thin disk. The line-of-sight dispersion of the cluster is 3.9 km s-1, which implies an unrealistically large dynamical mass. This could be due to the presence of a significant population of binary stars or larger-than-assumed velocity errors or the combination of both. The large intrinsic width of the main-sequence in the colour-magnitude diagram supports the binary explanation.
Future work should address proper motions of individual stars to investigate if the PN progenitor was a runaway star ejected from the cluster. While GAIA will measure very accurate proper motions from space, there might also be historical photographic plates that are suitable for determining proper motions. We make all the radial velocity data available through an electronic appendix to this paper. Combined with multicolour photometric data from the literature (e.g. through the WEBDA111http://www.univie.ac.at/webda/ database), these will be used to create an accurate colour-magnitude diagram of the cluster largely cleaned of the Galactic background and foreground.
Acknowledgments
This work is based on observations collected at the Anglo-Australian Observatory, Siding Spring, Australia. It has been supported by the Australian Research Council, a Group of Eight European Fellowship and the “Bolyai János” Research Fellowship of the Hungarian Academy of Sciences (Gy.M.Sz.), and by NASA through contract 1255094, issued by JPL/Caltech (Z.B.). Z.B. also received support from Hungarian OTKA Grants TS0498872, T024509, and T049082.
References
- [] Aller, L.H., 1977, JRASC, 71, 67
- [] Blaauw, A., 1961, Bulletin Astron. Inst. Neth., 15, 265
- [] Bonatto, C., Bica, E., Santos Jr, J.F.C., 2008, MNRAS, 386, 324
- [] Campbell, W.W., Moore, J.H., 1918, Publ. Lick Obs., 13 (4), 75
- [] Corradi, R.L.M., Schönberner, D., Steffen, M., Perinotto, M., 2000, A&A, 354, 1071
- [] Corradi, R.L.M., Schönberner, D., Steffen, M., Perinotto, M., 2003, MNRAS, 340, 417
- [] Cuffey, J., 1941, ApJ, 94, 55
- [] Dobbie, P.D., et al., 2006, MNRAS, 369, 383
- [] Frew, D.J., 2008, PhD thesis, Macquarie University, Sydney
- [] Frew, D.J., Parker, Q.A., 2006, in: Planetary Nebulae in our Galaxy and Beyond, IAU Symp. 234, Eds. M.J. Barlow and R.H. Mendez, Cambridge University Press, 49
- [] Frew, D.J., Parker, Q.A., Russeil D., 2006, MNRAS, 372, 1081
- [] Frinchaboy, P.M., Majewski, S.R., 2008, AJ, 136, 118
- [] Goodwin, S.P., Bastian, N., 2006, MNRAS, 373, 752
- [] Gutermuth, R.A., et al., 2008, ApJ, 674, 336
- [] Hoogerwerf, R., de Bruijne J.H.J., de Zeeuw, P.T., 2001, A&A, 365, 49
- [] Jacoby, G.H., Morse, J.A., Fullton, L.K., Kwitter, K.B., Henry, R.B.C., 1997, AJ, 114, 2611
- [] Jura, M., Morris, M., 1985, ApJ, 292, 487
- [] Kiss, L.L., Székely, P., Bedding, T.R., Bakos, G.Á., Lewis, G.F., 2007, ApJ, 659, L129
- [] Kouwenhoven, M.B.N., & de Grijs, R., 2008, A&A, 480, 103
- [] Majaess, D.J., Turner, D.G., Lane, D.J., 2007, PASP, 119, 1349
- [] Meatheringham, S.J., Wood, P.R., Faulkner, D.J., 1988, ApJ, 334, 862
- [] Mermilliod, J.-C., Mayor, M., Andersen, J., Nordstrom, B., Lindgren, H., Duquennoy, A., 1989, A&AS, 79, 11
- [] Mermilliod, J.-C., Andersen, J., Latham, D.W., Mayor, M., 2007, A&A, 473, 829
- [] Munari, U., Sordo, R., Castelli, F., Zwitter, T., 2005, A&A, 442, 1127
- [] O’Dell, C.R., 1963, PASP, 75, 370
- [] Parker, Q.A., et al., 2005, MNRAS, 362, 689
- [] Pauls, R., Kohoutek, L., 1996, AN, 317, 413
- [] Phillips, J.P., 2004, MNRAS, 353, 589
- [] Pierce, M.J., Frew, D.J., Parker, Q.A., Köppen, J., 2004, PASA, 21, 334
- [] Ralchenko, Yu., Kramida, A.E., Reader, J., and NIST ASD Team, 2008, NIST Atomic Spectra Database (version 3.1.5), available at http://physics.nist.gov/asd3, National Institute of Standards and Technology, Gaithersburg, MD
- [] Rudy, R.J., Lynch, D.K., Mazuk, S., Puetter, R.C., Dearborn, D.S.P., 2001, AJ, 121, 362
- [] Sharma, S., Pandey, A.K., Ogura, K., Mito, H., Tarusawa, K., Sagar, R., 2006, AJ, 132, 1669
- [] Skrutskie, M.F., et al., 2006, AJ, 131, 1163
- [] Spitzer, L., 1987, Dynamical evolution of globular clusters, Princeton University Press, Princeton, USA
- [] Stanghellini, L., Shaw, R.A., Villaver, E., 2008, ApJ, in press (arXiv:0807.1129)
- [] Steinmetz, M., et al., 2006, AJ, 132, 1645
- [] Stetson, P.B., 1981, AJ, 86, 1500
- [] Székely, P., Kiss, L.L., Szatmáry, K., Csák, B., Bakos, G.Á., Bedding, T.R., 2007, AN, 328, 879
- [] Van de Steene, G.C., Zijlstra, A.A., 1995, A&A, 293, 541
- [] Veltz, L., et al., 2008, A&A, 480, 753
- [] Weidemann, V., 2000, A&A, 363, 647
- [] Zhang, C.Y., 1995, ApJS, 98, 659
- [] Zwitter, T., et al., 2008, AJ, 136, 421
Appendix A The data
| RA(J2000) | DEC(J2000) | vr |
|---|---|---|
| (deg) | (deg) | (km s-1) |
| 115.63433332 | 14.83611944 | 58.4 |
| 115.57545832 | 14.92448333 | 50.1 |
| 115.67374998 | 14.90831666 | 44.8 |
| 115.74733332 | 14.84368055 | 56.1 |
| 115.88504165 | 14.80956111 | 39.8 |
| 115.63974998 | 14.89661111 | 49.1 |
| 115.91237498 | 14.82234166 | 52.8 |
| 115.84887498 | 14.89449166 | 45.4 |
| 115.93391665 | 14.79845000 | 38.2 |
| 115.74662498 | 14.88211944 | 40.4 |
| 115.52187498 | 14.86364722 | 20.1 |
| 115.90645832 | 14.93075278 | 47.9 |
| 115.56870832 | 14.86408889 | 54.4 |