What are scientific leaders? The introduction of a normalized impact factor
Abstract
We define a normalized impact factor suitable to assess in a simple way both the strength of scientific communities and the research influence of individuals. We define those ones with as being scientific leaders since they would influence their peers at least as much as they are influenced by them. The NIF is distinguished because (a) this has a clear and universal meaning and (b) this is robust against self-citation expedient. We show how a single lognormal function obtained from a simplified version of the NIF leads to a clear “radiography” of the corresponding scientific community. As an illustration, this is eventually applied to analyze a community derived from the list of outstanding referees recognized by the American Physical Society in 2008.
pacs:
02.50.-r,01.75.+m,89.65.-sOne of the most challenging aspects to define comprehensive scientometric indexes concerns the fact that this is not obvious in general how to take into account the field idiosyncrasies Narinetal76 . On the other hand, some agreement on what scientometric guiding criteria are useful is crucial to allow the proper agencies to formulate general policies and optimize the use of financial resources. As a consequence a continuous effort to improve the actual parameters can be witnessed. In order to take into account the publishing and citation traditions of different areas to rank scientific journals some authors have suggested, for instance, alternatives to the journal impact factor (JIF) Cameron05 . One such example was proposed by Bergstrom who reports the development of an algorithm which captures the percentage of the time that library users spend with a given journal Bergstrom07 : “Eigenfactor Scores and Article Influence Scores rank journals much as Google ranks websites”. (See also Refs. PalacioHuertaetal04 for previous related work.) More recently Nicolaisen and Frandsen have defined the reference return ratio (3R). The 3R exhibits a strong correlation with the JIF yet the “3R appears to correct for citation habits, citation dynamics, and composition of document types” Nicolaisenetal08 . In the same year Zitt and Small proposed the audience factor (AU) Zittetal08 as a way to normalize the standard JIF by the journal field.
As part of the broad program of defining scientometric parameters whose interpretation is as independent as possible from the research field, we define here the normalized impact factor (NIF) to assess the strength of scientific communities and the influence of individual research. The NIF is distinguished because (a) this has a clear and universal meaning being applicable with equal efficiency to individuals belonging to quite distinct communities and (b) this is robust against self-citation expedient. For the sake of illustration, we use the NIF to analyze a community derived from the list of outstanding referees recognized by the American Physical Society (APS) in 2008 OR . We compare the NIF with the -index and show that no clear correlation between them is seen indicating that both indexes carry different pieces of information. Eventually we discuss the NIF limitations.
The NIF puts in context (i) the influence exerted by the research of an individual with respect to (ii) how much this individual has been influenced by his/her scientific community. Our assumption is that while citations received by an individual reflects (i) Merton ; PToday the bibliographic references listed by him/her must reflect (ii). Hence, we define the NIF of an individual as
| (1) |
where and are the number of citations received and references included in his/her th paper which is signed by authors, respectively. Thus, if the first paper of the publication list of some researcher is signed, say, by 3 authors (the researcher himself/herself and two other collaborators), has 30 references and has received 20 citations, then , and , and so on for the other papers. The inclusion of avoids double counting of references and citations in multi-authored papers leading to the following important feature: in a closed community of identical individuals (i.e. who publish, reference and are cited by each other at the same rate) all members have . This is so because each reference corresponds to a citation. The NIF interpretation is, thus, straightforward. We denominate leaders individuals with because they influence their peers at least as much as they are influenced by them. The existence of an universal reference value () is one of the most satisfying aspects of this factor. Other ones are much field dependent and, thus, more difficult to interpret. Moreover, this is not easy to artificially boost one’s NIF through self citation because the inclusion of extra references increases the denominator of Eq. (1). However, we note that the NIF is obviously silent about the intrinsic relevance of the research work itself. We might have leaders (in the sense that they possess ) influencing people to work on issues which eventually do not pay off their research effort and vice versa. The NIF is clearly unable to evaluate the “leadership quality”.
As an illustration, we analyze a community derived from the 2008 list of APS outstanding referees OR . The methodology used is as follows. We have randomly selected 283 individuals (among the 531 ones) and looked for their publication lists in the ISI Web of Science ISI . To avoid including homonyms, we have entered with the researcher name and affiliation exactly as appears in Ref. OR , and recorded the ones with 20 or more papers. The derived community suffices for our purposes. Eventually 223 individuals (authoring 22,611 papers) passed the criterion above, comprising 592,429 references and 597,390 citations. Incidentally the total number of references is almost the same as the total number of citations, which is a necessary (although not sufficient) requirement for (approximately) closed communities. Obviously, our 223 individuals do not form a closed community. Because of resource limitations we have actually carried our analysis using the simplified normalized impact factor (SNIF) defined as
| (2) |
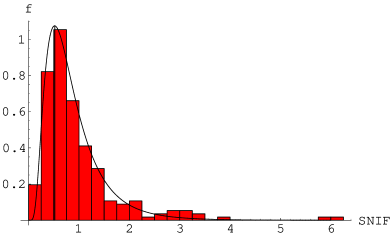
The typical difference between the SNIF and the NIF for 10 randomly chosen individuals was less than 10%. This simplified procedure has restricted our data collection to 3 months and final update to 4 days [from June, 21st to 24th (2008)]. In Fig. 1 the vertical bars show the population probability density generated from our data. The area below the graph gives the rate of individuals with SNIF in the corresponding interval. Interestingly enough, Fig. 1 is well fit by a lognormal distribution lognormal :
where , and , for the community under analysis. As a matter of fact, and will depend on the community but is always unit normalized:
We can see and as being the “community fingerprint”. The fact that our sample comprises from high-energy experimentalists to condensed-matter theoreticians and our data are fit by a single lognormal distribution supports our hope that the (S)NIF can be successfully applied to quite distinct populations keeping its simple and universal interpretation. We see that 68% of the population will be found between and . We obtain, thus, from Fig. 1 that 68% of our population has
The median which separates the population in two halves with respect to the SNIF value is given by
Thus, half of the population has . The SNIF expected value (or mean value) is given by
Note that . It can be numerically calculated from Fig. 1 that leaders comprise only of the population. (We shall comment that the present author does not belong to the leader set.)
Up to this point we have used the (S)NIF to put in context the scientific work of individuals with respect to their peers. Now, we go further and propose a way to assess the strength and homogeneity of the scientific community itself. This is possible because of the nice fit provided by the lognormal function for the SNIF distribution. Let us notice that the larger the median, , is the more “stretched” towards large NIFs Fig. 1 will be. This suggests the following definition for the community strength:
Similarly, the smaller the is, the stiffer the graph will be, in which case most people would have the same corresponding NIF and the community would be considerably homogeneous. A prototype of a homogeneous community would be the one described in the beginning, namely, a closed community of identical individuals having all members . This suggests the following relation as a measure of the community homogeneity:
By the same token, the larger the is the flatter the distribution will be, which would characterize a nonhomogeneous community consisting of members with quite distinct NIF values.
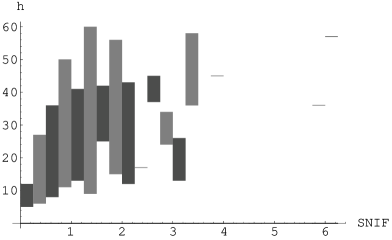
Now, for the sake of comparison we show in Fig. 2 the -index Hirsch range (see also Ref. Ball ; Schreiber ) assumed by individuals in a fixed SNIF interval. No obvious relationship between “large” -index and scientific leadership in the sense defined above is seen: we find leaders with relatively small -index and nonleaders with relatively large -index. Notice that in general a correlation between the -index and the number of papers is expected to exist. Let us consider for a moment the extreme case where every papers of some individual cite all his/her previous ones. In this case, the corresponding -index would be and for even and odd, respectively, only due to self citation, where is the total number of papers. This can lead to quite large values. Although this is an unrealistic case, it illustrates the possible influence of the paper number on the -index. This is not so with the NIF which is basically insensitive to the paper number. The NIF is not expected to exhibit more than a moderate correlation with the -index. As a result, the pieces of information carried by the NIF and -index are fairly distinct.
In summary, assuming that our hypotheses (i) and (ii) above are meaningful, it seems fair to support that the NIF provides useful and novel information about the scientific work of individuals and of their corresponding communities. However, we would like to make some caution remarks concerning the use of this index. (The same remarks apply to the SNIF.) The first one, is that the NIF should be used to assess senior rather than junior scientists. How to define seniority is an open question on which some agreement has to be reach. The NIF of junior researchers will exhibit in general a strong transient profile as a function of time and will be mostly influenced by the supervisor expertize in which case the “leader” label would not apply. Moreover, the NIF does not distinguish between protagonist and coadjuvant authors cosigning the same papers. The reliability of the NIF as a way to assess leadership will depend on how much one’s publication list does reflect the researcher own expertize rather than the one of his/her collaborators. In addition, researchers who solve a controversy may be less cited than the ones who have raised it. Depending on the case, this may induce the NIF of the former ones to be smaller than the NIF of the latter ones. In order to deal with these cases, other aspects (mostly subjective ones) should be taken into account Zanotto . Next, the NIF is robust against self-citation expedient but not completely immune to it. Self citations tend to increase and decrease the NIF value for individuals with and , respectively. If we assume the usual case where the number of self citations () is small in comparison with the total number of citations () received by a researcher, , it is easy to get from Eq. (1) that nonleaders will have the NIF value increased due to self citation by a factor of order having, thus, (some but) not a dramatic net influence on the final NIF value. The NIF can be also influenced depending on the individual care and generosity when acknowledging the influence of others by including more or less references. However, we do not expect it to have a huge influence either. Any unusual practice or artificial tentative to boost one’s NIF by omitting crucial references should face prompt opposition from the peer-review system: whenever this is possible and necessary referees help authors to improve their papers by calling attention to related references. On the other hand, the NIF adoption would probably drive authors not to include irrelevant references with the aim of receiving extra citations as a counterpart, which we see as being a “purifying” feature. Some concern can be also raised about how the presence of reviews in the publication list could affect the NIF. Although reviews tend to include long reference lists reflecting the contribution of various individuals to the corresponding topic, they also tend to be heavily cited because of its comprehensiveness. Eventually both tendencies should compensate each other having no major effect in the NIF of senior scientists.
Despite the NIF robustness, obviously no single parameter is able to clear-cut leaders from nonleaders. In spite of the possible difficulties which the NIF may face when applied to assess individuals, we would like to emphasize that our main motivation to introduce this index was to provide a tool to produce more accurate “radiographies” of research communities as a whole (in which case individual idiosyncrasies are “averaged” and should not have any relevant net influence in the final diagnosis) leading thus to more efficient scientific policies. This is particularly important to communities in emergent countries which are still fixing their standards and aim to have eventually a protagonist role in the global scenario.
Acknowledgements.
I am indebted to D. Gil de Oliveira and F. Montero for help with data collection. I thank P. Ball, R. Meneghini, J. Montero, V. Pleitez, D. Vanzella and E. Zanotto for discussions. Partial financial support was provided by Conselho Nacional de Desenvolvimento Científico e Tecnológico and Fundação de Amparo à Pesquisa do Estado de São Paulo.References
- (1) G. Pinski and F. Narin, Citation influence for journal aggregates of scientific publications: Theory, with application to the literature of physics, Information Processing & Management, 12 (1976) 297.
- (2) B. D. Cameron, Trends in the usage of ISI bibliometric data: Uses, abuses and implications, Libraries and the Academy, 5 (2005) 105.
- (3) C. Bergstrom, Eigenfactor: Measuring the value and prestige of scholarly journals, College & Research Libraries News, 68 (2007). Retrieved from www.ala.org/ ala/mgrps/divs/acrl/ publications/crlnews/2007/may/ eigenfactor.cfm
- (4) I. Palacios-Huerta and O. Volij, The measurement of intellectual influence, Econometrica, 72 (2004) 963.
- (5) J. Nicolaisen and T. F. Frandsen, The reference Return Ration, Journal of Informetrics, 2 (2008) 128.
- (6) M. Zitt and H. Small, Modifying the Journal Impact Factor by Fractional Citation Weighting: The Audience Factor, Journal of the American Society for Information Science and Technology, 59 (2008) 1856.
- (7) Outstanding Referees Program, American Physical Society (publish.aps.org/ OutstandingReferees).
- (8) R. K. Merton, The Sociology of Science. Chicago, University of Chicago Press (1973).
- (9) S. Redner, Citation statistics from 110 years of Physical Review, Phys. Today, 58 (2005) 49.
- (10) ISI Web of Knowledge, Thomson Reuters (www.isiwebof knowledge.com).
- (11) J. Aitchinson and J. A. C. Brown, The Lognormal Distribution. Cambridge, Cambridge University Press (1957).
- (12) J. E. Hirsch, An index to quantify an individual’s scientific research output, Proc. Natl Acad. Sci. USA, 102 (2005) 16569.
- (13) P. Ball, Index aims for fair ranking of scientist, Nature, 436 (2005) 900.
- (14) M. Schreiber, To share the fame in a fair way, modifies for multi-authored manuscripts, New J. Phys., 10 (2008) 040201.
- (15) E. D. Zanotto, The scientists pyramid, Scientometrics, 69 (2006) 175.