Rearrangement of Sodium ordering and its effect on physical properties in system
Abstract
We systematically study Raman spectroscopy of cleaved NaxCoO2 single crystals with 0.37 x 0.80. The Raman shift of A1g mode is found to be linearly dependent on Na content, while the Raman shift of E1g mode has an abnormal shift to high frequency around x = 0.5. The abnormal shift is ascribed to the occurrence of Na rearrangement in O1 structure. Temperature dependent Raman spectrum for x = 0.56 sample shows that Na rearrangement transition from O1 structure to H1 structure occurs around 240 K. Electronic transport and susceptibility for the sample with show a response to the Na rearrangement transition from O1 to H1 structure, and that different Na ordering pattern causes distinct physical properties. These results give a direct evidence to proved Na ordering effect on physical properties of Co-O plane.
pacs:
31.30.Gs,71.38.-k,75.30.-mI Introduction
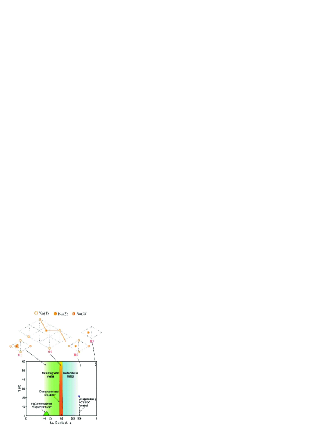
The layered cobaltate NaxCoO2 has attracted much interesting in strong correlation research area due to its rich physics.Takada ; Ong ; Foo As we know, the electronic ground state is strongly dependent on the Na content in NaxCoO2Foo in which the valence of Co ion can be tuned by Na content. Moreover, the change of Na content can also affect the structure of Na+ ion layer. Early electron diffraction and neutron diffraction measurements reveal a kaleidoscope of Na+ ion patterns as a function of concentration.Zandbergen ; Huang ; Huang2 ; Huang3 A detailed phase diagram of Na+ ion layer structure was given by Huang et al..Huang2 As shown in Fig.1, there are four different types of structure for Na+ ion layer with different Na content — H1, H2, H3 and O1. In the four types of structure, there are three types of Na+ ion site— Na(1)(2b (0, 0, 1/4)), Na(2)(2c (2/3, 1/3, 1/4)) and Na(2)’(6h (2x, x, 1/4)). The occupation probability of the above sites depends on both Na content and temperature.Huang2 It is expected that different Na+ ion pattern corresponds to distinct physical properties. The relationship between structure of Na+ ion layer and physical properties of Co-O plane is believed to be an important key of understanding this systemFoo ; Huang2 and becomes a hot issue in recent researchesRoger ; Schulze ; Morris ; Chou ; Balicas ; Pai ; Zhou ; Marianetti ; Choy .
Recently, single crystal neutron scattering study reveals the formation of ordered sodium vacancies for x0.5. Inside each vacancy, there exists a Na monomer or a Na trimer occupying Na(1) sites that sit atop Co atoms.Roger This multi-vacancy model and Na trimer geometry are also proved by single crystal synchrotron X-ray diffraction and can be used to explain the observed superstructures of x=0.84 and x=0.71 crystals very well.Chou A recent STM study also found that an unexpected Na trimer ordering is found for x0.5 samples.Pai These interesting findings make us renew our understanding of Na ordering pattern. More and more theoretical and experimental progress of Na orderingRoger ; Chou ; Zhou ; Marianetti ; Choy show that Na ordering plays an important role in understanding of the rich physical properties of Co-O plane. However, direct experimental evidence of relationship between Na ordering and physical properties of Co-O plane is still limitedSchulze . Here, we report a systematically Raman study in NaxCoO2. It is found that an abnormal sodium dependence of E1g mode occurs around x=0.5. Temperature dependent Raman study indicates that a possible Na rearrangement transition from H1 to O1 phase defined by Huang et al.Huang2 occurs at x=0.56. Electronic transport and susceptibility for the sample with x=0.56 show that this kind of Na rearrangement transition makes different physical properties in this system. These results give a direct evidence for Na ordering effect on the physical properties of Co-O plane.
II Experiment
High quality single crystals of NaxCoO2 were grown using the flux method (x = 0.7) and floating zone technique (x = 0.75 and 0.80). The NaxCoO2 sample with x0.7 is prepared by sodium deintercalation of the Na0.7CoO2 singe crystals in solutions obtained by dissolving I2 (0.2 M, 0.02 M, 0.004M) or Br2 (6.0 M) in acetonitrile (M is ”molar”) for 4 days at room temperature. The x values of the samples were estimated by the same method as previous paper.Wu Raman spectra were obtained on a LABRAM-HR Confocal Laser MicroRaman Spectrometer using the 514.5 nm line from an argon-ion laser with in-plane light polarization. The single crystals were cleaved to obtain fresh surface before Raman measurements. The resistance was measured by an AC resistance bridge (LR-700, Linear Research). Magnetic susceptibility measurements were performed with a superconducting quantum interference device magnetometer in a magnetic field of 7 T. It should be addressed that all results discussed as follow are well reproducible.
III Result and Discussion
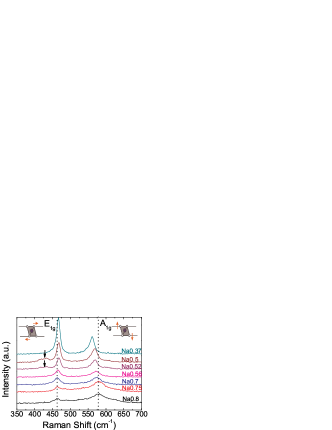
Fig.2 shows the Raman spectra for x=0.37, 0.50, 0.52, 0.56, 0.7, 0.75 and 0.80 at ambient temperature with the range from 350 to 700 cm-1. Raman spectra of all samples are measured from ab-plane with in-plane light polarization. In Fig.2, all samples show two distinct Raman modes around 467 cm-1 and 561 cm-1, which can be attributed to Raman-active in-plane E1g and out-of-plane A1g vibrations of oxygen in CoO6 octahedra, respectively.Shi ; Iliev ; Lemmens ; Qu ; Zhang ; Lemmens2 The samples with x= 0.5 and 0.52 show additional modes around 425 cm-1, which is attributed to Na+ ion ordering.Qu In addition, both of two samples show a charge ordering behavior at low temperature which is consistent with the results by Foo et al.Foo and Wu et al..Wu These results indicate the sensitivity of this phonon to structural and electronic ordering processes. Two distinct systematic shifts are observed for A1g and E1g modes. With decreasing Na content, the A1g mode shifts to low frequency and E1g mode shifts to high frequency. The widths of A1g and E1g modes increase with sodium doping, and there exists a distinct broadening of A1g and E1g modes above x0.52. This broadening of the two modes maybe come from instability of ordering structure of Na+ ions. The systematic changes of related Raman shift of A1g and E1g with decreasing Na content are shown in Fig.3. The Raman shift of A1g mode is linearly suppressed with Na content. This result is consistent with previous data.Lemmens2 ; Donkov But it is surprising that the Raman shift of E1g mode presents an abnormal shift around x = 0.5, and this phenomenon is not observed in previous data.Donkov Huang et al. have proposed a structural phase diagram based on different structure of Na+ ion layer.Huang2 Present data indicate that the O1 structure may be corresponding to the abnormal shift of E1g mode. Meanwhile, above results also indicate that the E1g mode is more sensitive to O1 structure than A1g mode, which can be used as the fingerprint of O1 structure. It should be emphasized that the temperature dependence of Raman shift for E1g mode also shows a T-linear behavior except for that observed in the samples of with Na ordering in O1 structure. Since the in-plane Na+ ion ordering happens between two neighboring CoO6 layers, it is also easy to understand why the out-of-plane A1g mode has no distinct change. Recently, multi-vacancy model was proposed to understand the Na ordering phenomenonRoger and Na rearrangement phenomena were also found for x0.5.Huang3 ; Morris The above results suggest that a possible Na rearrangement transition occurs around x=0.5 and E1g mode is a good indicator.
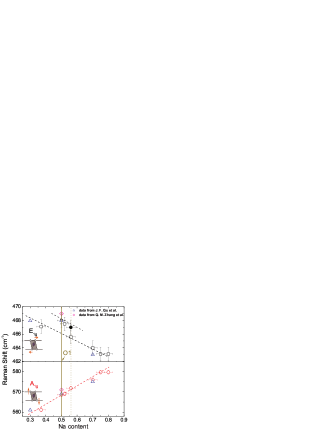
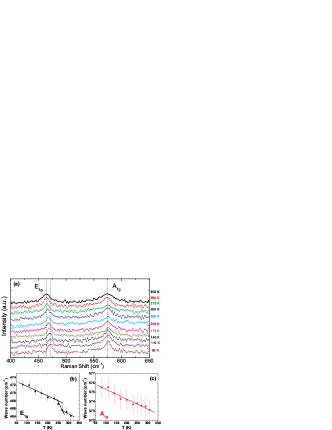
In order to further study the possible Na rearrangement transition, we chose x=0.56 sample and measured temperature dependent Raman shift (80 K 310 K). In Fig.4, temperature dependent Raman spectrum for x = 0.56 shows different temperature dependence for A1g and E1g mode. The temperature dependent Raman shift of A1g and E1g mode is shown in Fig.4(a). As shown in Fig.4(b) and (c), A1g mode linearly changes with decreasing temperature. Although a step-like change happens around K for the E1g mode, Raman shift of the E1g mode follows a T-linear dependence below and above . According to the temperature dependence of Raman shift below , a Raman shift could be obtained by extrapolating to room temperature. As shown in Fig.3, the Raman shift of E1g mode obtained by extrapolating to room temperature falls to the abnormal shift region around x=0.5 in Na ordering O1 structure. Since the sample is placed in a airtight box for low temperature measurements, the signal-to-noise ratios of spectra are much lower than those in Fig. 2. We can not see the weak Raman peak around 425 cm-1 below 240 K, which exist in x=0.5 and 0.52 sample. Some previous data are also included in Fig.3, it further indicates a Na ordering transition from O1 to H1 structure at K with increasing temperature for the sample with x=0.56. Detailed information about this kind of Na ordering transition needs to confirm by further neutron or electron scattering experiment.
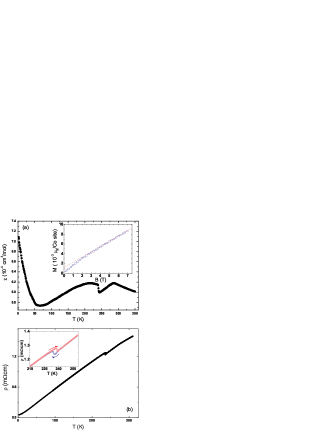
Temperature dependent resistivity and susceptibility for x = 0.56 are shown in Fig.5 in whole temperature region (2 K T 300 K). In Fig.5(a), the susceptibility under H = 7 T parallel to Co-O plane shows an anomaly around 240 K, being consistent with Na reordering transition observed in Raman study. Above 280 K, the temperature dependent susceptibility shows a Curie-Weiss behavior. The data were fitted with the Curie-Weiss law: =0+. The fitting parameter is 124 K and number of S=1/2 local spin is 0.14/Co site. This result is in agreement with the report for x=0.7 sample.Foo Below 240 K, the susceptibility shows a Pauli paramagnetism-like behavior. No antiferromagnetic ordering is observed down to 4 K, unlike x=0.5 sampleFoo . A Curie tail exists below 50 K. The Curie tail is fitted with Curie-Weiss law, and the value of is 46 K and the number of S=1/2 local spin is 0.03/Co site. It indicates that the efficient number of S=1/2 local spin and antiferromagnetic correlation are reduced due to the Na reordering transition. A crossover from Curie-Weiss to Pauli paramagnetism is accompanied with Na reordering transition from H1 to O1 structure. A linear behavior is observed in field dependent susceptibility at 4 K and only a tiny nonlinear behavior is observed below 2 T, as shown in inset of Fig.5(a). This also indicates that no ferromagnetic ordering happens, the ferromagnetic ordering shows up in x=0.55 and 0.52 sample.Wang ; Wu In Fig.5(b), the temperature dependent resistivity shows a loop behavior around 240 K and the metal behavior is observed in the entire temperature-region. Below 30 K, the temperature dependent resistivity obeys T1.5 law. Between 30 K and 200 K, a well defined T-linear behavior is found. These characteristics are similar to that in Pauli paramagnetic metal for x0.5, being consistent with above magnetic properties. Isothermal magnetoresistance and temperature dependent magnetoresistance under 7 T are shown in Fig.6. A positive and monotonic magnetoresistance is observed as shown in Fig.6(a) and (b). Below 30 K, a prominent positive magnetoresistance is observed under 7 T with magnetic field both parallel and perpendicular to Co-O plane, which is matched with the T1.5 behavior in resistivity. The maximum of magnetoresistance reaches 24 and 11 with H perpendicular and parallel to Co-O plane, respectively. These results indicate that strong magnetic fluctuation occurs below 30 K and a novel paramagnetic state maybe exist at low temperature.

Recently, more and more experiments indicated that Na ordering is the key to understanding novel properties in NaxCoO2 system.Roger ; Chou ; Zhou ; Marianetti ; Choy A plenty of Na ordering pattern and rearrangement transition between these different ordering patterns are found.Morris ; Chou But direct evidence to proved the relationship between Na ordering pattern and physical properties of Co-O plane is still limited.Schulze The above results give strong evidence that Na reordering transition from H1 to O1 structure can induce a crossover from Curie-Weiss to Pauli paramagnetic metal. Above Na reordering transition, a Curie-Weiss behavior similar to that observed in x=0.7 sample is confirmed by the temperature dependent susceptibility. Below Na reordering transition, temperature dependent resistivity and susceptibility are perfectly consistent with Pauli paramagnetic metal for x0.5 sample. These results indicate a direct link between Na reordering transition and crossover from Curie-Weiss to Pauli paramagnetic metal. There exists contradiction about the abnormal ”Curie-Weiss” metal for a long time. Recently, Shubnikov de Haas effect has been studied in x=0.84 and 0.71 samples.Balicas They found that the Na ordering can reconstruct the Fermi surface (FS) pockets and leads to the formation of local spin. In this picture, the crossover observed here can be attributed to another kind of reconstruction of FS pockets induced by Na reordering transition. Local spins are reduced and Pauli paramagnetism is enhanced by this kind of reconstruction of FS pockets. These results also shed light to the mechanism of charge ordering insulator for x=0.5 sample. The charge ordering insulator evolves from Pauli paramagnetic metal. Spin density wave (SDW) or charge density wave(CDW) mechanism is favor for this situation and early NMR result supports this picture.Bobroff But many recent experiments show that density wave mechanism can not respond to insulator state for x=0.5 sample, and Na ordering effect is proposed to understand it.Argyriou ; Ning ; Garbarino The present data can be understood by density wave mechanism, but if there exists any other Na ordering pattern different from x=0.56 at low temperature same as that in x=0.5, the density wave picture will be challenged.
IV Conclusion
Raman spectroscopy of cleaved NaxCoO2 single crystals with 0.37 x 0.80 was systematically studied. The Raman shift of A1g mode is found to be linearly dependent on Na content. While the Raman shift of E1g mode has an abnormal shift to high frequency around x = 0.5. The abnormal shift is ascribed to Na+ ordering in O1 structure. Na reordering transition from O1 to H1 structure around 240 K is proved by temperature dependent Raman spectrum for x = 0.56 sample. Electronic transport and susceptibility measurement for x=0.56 indicate that the Na ordering in different structures leads to distinct physical properties. Present results give a direct evidence for the relationship between Na ordering and physical properties of Co-O plane. Effect of Na ordering on physical properties is clearly presented
This work is supported by the grant from the Nature Science Foundation of China and by the Ministry of Science and Technology of China (973 project No: 2006CB601001 and 2006CB922005), the Knowledge Innovation Project of Chinese Academy of Sciences, and the Innovation Foundation of USTC for the Postgraduate (KD2007077).
References
- (1) K. Takada et al., Nature (London) 422, 53(2003).
- (2) N. P. Ong and R. J. Cava, Science 305, 52(2004).
- (3) M. L. Foo et al., Phys. Rev. Lett. 92, 247001(2004).
- (4) H. W. Zandbergen, M. L. Foo, Q. Xu, V. Kumar and R. J. Cava, Phys. Rev. B 70, 024101(2004).
- (5) Q. Huang, M. L. Foo, J. W. Lynn, H. W. Zandbergen, G. Lawes, Yayu Wang, B. H. Toby, A. P. Ramirez, N. P. Ong, and R. J. Cava (2004), cond-mat/0402255.
- (6) Q. Huang, M. L. Foo, R. A. Pascal Jr., J. W. Lynn, B. H. Toby, Tao He, H. W. Zandbergen, and R. J. Cava (2004), cond-mat/0406570.
- (7) Q. Huang, B. Khaykovich, F.C. Chou, J.H. Cho, J. W. Lynn, Y. S. Lee, Phys. Rev. B 70, 134115(2004).
- (8) M. Roger, D. J. P. Morris, D. A. Tennant, M. J. Gutmann, J. P. Goff, J.-U. Hoffmann, R. Feyerherm, E. Dudzik, D. Prabhakaran, A. T. Boothroyd, N. Shannon, B. Lake and P. P. Deen, Nature (London) 445 631-634(2007).
- (9) T. F. Schulze, P. S. Häfliger, Ch. Niedermayer, K. Mattenberger, S. Bubenhofer, and B. Batlogg, Phys. Rev. Lett. 100 026407(2008).
- (10) D. J. P. Morris et al., arXiv:0803.1312v2
- (11) F. C. Chou et al., arXiv:0709.0085v1
- (12) L. Balicas, Y. J. Jo, G. J. Shu, F. C. Chou, P. A. Lee, Phys. Rev. Lett. 100, 126405(2008).
- (13) Woei Wu Pai, S. H. Huang, Ying S. Meng, Y. C. Chao, C. H. Lin, H. L. Liu, F. C. Chou, arXiv:0805.0475v1
- (14) Sen Zhou and Ziqiang Wang, Phys. Rev. Lett. 98, 226402(2007).
- (15) C. A. Marianetti and G. Kotliar, Phys. Rev. Lett. 98, 176405(2007).
- (16) Ting-Pong Choy, Dimitrios Galanakis, and Philip Phillips, Phys. Rev. B 75, 073103(2007).
- (17) T. Wu, D. F. Fang, G. Y. Wang, L. Zhao, G. Wu, X. G. Luo, C. H. Wang and X. H. Chen, Phys. Rev. B 76, 024403(2007).
- (18) Y. G. Shi, Y. L. Liu, H. X. Yang, C. J. Nie, R. Jin, and J. Q. Li, Phys. Rev. B 70, 052502(2004).
- (19) M. N. Iliev, A. P. Litvinchuk, R. L. Meng, Y. Y. Sun, J. Cmaidalka, and C. W. Chu, Physica C 402, 239(2004).
- (20) P. Lemmens, V. Gnezdilov, N. N. Kovaleva, K. Y. Choi, H. Sakurai, E. Takayama-Muromachi, K. Takada, T. Sasaki, F. C. Chou, D. P. Chen, C. T. Lin, and B. Keimer, J. Phys.: Condens. Matter 16, S857(2004).
- (21) J. F. Qu, W. Wang, Y. Chen, G. Li, and X. G. Li, Phys. Rev. B 73, 092518(2006).
- (22) Qingming Zhang, Ming An, Shikui Yuan, Yong Wu, Dong Wu, Jianlin Luo, Nanlin Wang, Wei Bao, and Yening Wang, Phys. Rev. B 77, 045110(2008).
- (23) P. Lemmens, K. Y. Choi, V. Gnezdilov, E. Ya. Sherman, D. P. Chen, C. T. Lin, F. C. Chou, and B. Keimer, Phys. Rev. Lett. 96, 167204(2006).
- (24) A. Donkov, M. M. Korshunov, I. Eremin, P. Lemmens, V. Gnezdilov, F. C. Chou, and C. T. Lin, Phys. Rev. B 77, 100504(R)(2008).
- (25) C. H. Wang, X. H. Chen, T. Wu, X. G. Luo, G. Y. Wang, and J. L. Luo, Phys. Rev. Lett. 96, 216401(2006).
- (26) J. Bobroff, G. Lang, H. Alloul, N. Blanchard, and G. Collin, Phys. Rev. Lett. 96, 107201(2006).
- (27) D. N. Argyriou, O. Prokhnenko, K. Kiefer, and C. J. Milne, arXiv:0709.1038(2007).
- (28) F. L. Ning, S. M. Golin, K. Ahilan, T. Imai, G.J. Shu and F. C. Chou, arXiv:0711.4023(2007).
- (29) G. Garbarino, M. Monteverde, M. Nunez Regueiro, C. Acha, M. L. Foo, R. J. Cava, arXiv:0710.4341v1