The Masses of Transition Circumstellar Disks: Observational Support for Photoevaporation Models
Abstract
We report deep Sub-Millimeter Array observations of 26 pre-main-sequence (PMS) stars with evolved inner disks. These observations measure the mass of the outer disk (r 20-100 AU) across every stage of the dissipation of the inner disk (r 10 AU) as determined by the IR spectral energy distributions (SEDs). We find that only targets with high mid-IR excesses are detected and have disk masses in the 1-5 MJup range, while most of our objects remain undetected to sensitivity levels of MDISK 0.2-1.5 MJup. To put these results in a more general context, we collected publicly available data to construct the optical to millimeter wavelength SEDs of over 120 additional PMS stars. We find that the near-IR and mid-IR emission remain optically thick in objects whose disk masses span 2 orders of magnitude (0.5-50 . Taken together, these results imply that, in general, inner disks start to dissipate only after the outer disk has been significantly depleted of mass. This provides strong support for photoevaporation being one of the dominant processes driving disk evolution.
1 Introduction
The vast majority of PMS stars in any given population are either accreting Classical T Tauri Stars (CTTSs) with excess emission extending from the near-IR to the millimeter or weak-line T Tauri Stars (WTTSs) with bare stellar photospheres. The fact that very few objects lacking near-IR excess show mid-IR or (sub)millimeter excess emission implies that, once the inner disk dissipates, the entire disk goes away very rapidly (Skrutskie et al. 1990; Wolk Walter 1996; Cieza et al. 2007).
To first order, the evolution of primordial disks is driven by viscous accretion. Viscous evolution models (Hartmann et al. 1998; Hueso Guillot 2005) are broadly consistent with the observational constraints for disk masses, disk sizes, and accretion rates as a function of time; however, they also predict smooth, power-law evolution of the disk properties. This smooth evolution is inconsistent with the very rapid disk dissipation that usually occurs after a much longer disk lifetime. Pure viscous evolution models also fail to explain the variety of SEDs of the so called “transition objects” (the few objects that are caught in the short transition between typical CTTSs and bare stellar photospheres).
Recent disk evolution models, known as “UV-switch” models, combine viscous evolution with photoevaporation by the central star (Clarke et al. 2001; Alexander et al. 2006) and are able to account for both the disk lifetimes of several million years and the short disk dissipation timescales ( 0.5 Myr). According to these models, extreme ultraviolet (EUV) photons originating in the stellar chromosphere, ionize and heat the circumstellar hydrogen. Beyond some critical radius, the thermal velocity of the ionized hydrogen exceeds its escape velocity and the material is lost in the form of a wind. At early stages, the accretion rate dominates over the evaporation rate and the disk undergoes standard viscous evolution. Later on, as the accretion rate drops, the outer disk is no longer able to resupply the inner disk with material. At this point, the inner disk drains on a viscous timescale and an inner hole is formed. Once this inner hole has formed, EUV radiation very efficiently photoevaporates the inner edge of the disk and the disk rapidly dissipates from the inside out. Thus, the UV-switch model naturally accounts for disk lifetimes and dissipation timescales as well as for the SEDs of some disks suggesting the presence of large inner holes.
Photoevaporation, however, is not the only mechanism that has been proposed to explain the opacity holes of transition disks, some of which have now been confirmed by direct submillimeter imaging (e.g., Brown et al. 2008). Theoretical models of the dynamical interaction between forming planets and the disk (Lin Papaloizous 1979, Artymowicz Lubow 1994) also predict the formation of inner holes and gaps, and thus planet formation quickly became one of the most exciting explanations proposed for the inner holes of transition disks (Calvet et al. 2002; D’Alessio et al. 2005). However, the planet formation process is not required to be far along in order to affect the SED of a circumstellar disk. Once primordial sub-micron dust grains grow into somewhat larger bodies (r ), most of the solid mass ceases to interact with the radiation, and the opacity function decreases dramatically. Dullemond Dominik (2005) find that grain growth is a strong function of radius it is more efficient in the inner regions where the surface density is higher and the dynamical timescales are shorter, and hence can also produce opacity holes.
Understanding the processes operating in transition disks is crucial for understanding disk evolution and planet formation. However, since multiple processes can result in similar IR SEDs, additional observational constraints are necessary to establish their relative importance. Here, we report deep SMA observations of a sample of 26 PMS stars whose IR SEDs trace the dissipation of the inner disk (r 10 AU). These observations provide information on the mass of their cold outer disks (r 20-100 AU) and help us to distinguish between different evolutionary scenarios.
2 Sample Selection and Observations
The stars in our sample were selected from the literature and meet the following criteria i) are low-mass (A-type or later, but mostly K-M type stars) PMS stars with ages 10 Myrs, ii) have 24 m excesses, iii) show evidence for inner disk evolution. This evidence is in the form of decreased levels of near- and mid-IR excess (i.e. are in the lower quartile of the SEDs of CTTSs presented by Furlan et al. 2006) and/or weak accretion (i.e. are WTTSs), and iv) are located within 140 pc of the sun. Following these criteria, we selected 11 objects located in the Ophiuchus molecular cloud from Cieza et al. (2007), 10 objects from the Upper Scorpius association from Carpenter et al. (2006), and 5 objects from the TW Hydra association from Low et al (2005). Based on criteria ii) and iii), our targets can be broadly classified as transition objects. However, we note that the precise definitions of what constitutes a transition object found in the literature are far from homogeneous.
(Sub)millimeter interferometric observations of our 25 stars were conducted with the Submillimeter Array (SMA; Ho et al. 2004) during the summer of 2007 (July 5-31, compact configuration) and the spring of 2008 (April 24-May 17, compact-north configuration). Fifteen of our targets were observed with the 230 GHz/1300 m receivers, 9 of them with the 345 GHz/ 850 m receivers, and 2 additional targets were observed at both frequencies. The upper and lower sideband data were used in both wavebands, resulting in a total bandwidth of 4 GHz. Typical zenith opacities for our data were –0.14. For each target source, the observations cycled between the target and two gain calibrators (1037-295/1130-148 for TW Hydra objects, 1517-243/1733-130 for the Upper Sco Objects, and 1626-298/1733-130 for Ophiuchus objects), with 20-30 minutes on target and 4-7.5 minutes on each calibrator.
The visibility data were calibrated with the MIR reduction package111http://cfa-www.harvard.edu/cqi/mircook.html. The passband was flattened using 1 h scans of Uranus or 3c454.3 and the complex gain solutions were obtained using the primary calibrators 1037-295, 1517-243, and 1626-298. These gains, applied to our secondary calibrators, served as a consistency check for these solutions. Since none of the detected targets were resolved, their flux densities were measured by fitting a point source model to the visibility data. The upper limits were derived from the rms of the visibility amplitudes. The absolute flux scale was determined through observations of either Uranus, Callisto, or Neptune and is estimated to be accurate to 15.
3 Results: The Disk Masses of Transition Objects
The 850 and 1300 m SMA continuum measurements for our sample, along with 2.2 and 24 m photometry from 2MASS and Spitzer are presented in Table 1. We detect only 6 out of the 26 PMS stars in our sample: ROXs 10B, ROXR1 29, USco J160822.4-193004, USco J160900.7-190852, TWA 3, and TWA 4. Andrews Williams (2007) show that disk masses obtained from modeling their IR and (sub)-mm SEDs are well described by a simple relation of the form MDISK = Cν Fν, where Cν is a constant at a given frequency and Fν is a (sub)millimeter flux at that same frequency. In order to allow a direct comparison of our disk masses to relevant previous results (see Sec. 4.1), we compute Cν at 230 and 345 GHz from the ratios of derived disk masses to observed fluxes presented by Andrews Williams (2005). We adopt the mean values of these ratios for the 33 Taurus stars with both 230 and 345 GHz data for which they obtain disk masses from SED fitting. From the constants so derived, we obtain to the following relations:
1) MDISK=8.010-5 [()(] M⊙ or
2) MDISK=1.710-4 [()(] M⊙
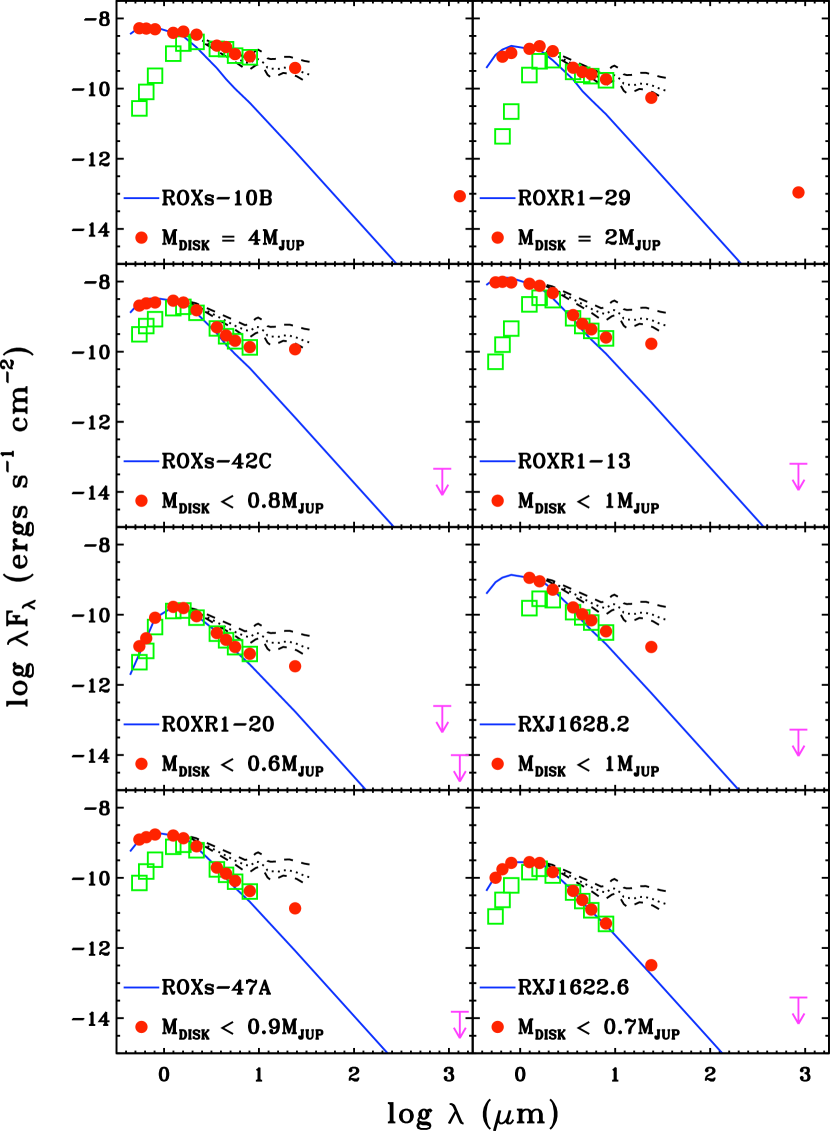
Using these equations, we find that the 6 targets detected have disks masses in the 1-5 MJup range, while most of the undetected objects have 3- upper limits in the 0.2-1.5 MJup range (See Tab. 1). Since Andrews Williams (2007) find a median disk mass of 5 MJup for CTTSs in Taurus and Ophiuchus, we conclude that the stars in our sample, selected based on their inner disk properties, have disks significantly less massive than those of typical CTTS stars. We also find that the SMA targets with highest disk masses (2 MJup), ROXs 10B, ROXR1 29, and USco USco-J160823.2-193001 are also among those with the highest levels of IR excesses at IRAC wavelengths (See Fig. 1).
4 Discussion and Conclusions
4.1 The SED evolution of PMS Stars
In order to put the results of our SMA survey in a more general context of disk evolution, we combined publicly available data to construct the optical, near-, mid-IR, and (sub)millimeter wavelength SEDs of over 120 additional PMS stars. We started from the (sub)millimeter targets in Taurus and Ophichus studied by Andrews Williams (2005, 2007) and then searched for their Spitzer fluxes in the catalogs produced by the “Cores to Disks” (Evans et al. 2003) and Taurus (Padget et al. 2006) Legacy Projects 222http://ssc.spitzer.caltech.edu/legacy/all.html. For objects with both Spitzer and (sub)millimeter data, we collected the near-IR photometry from the 2MASS database and, when available, the optical data from the literature. The complete SEDs of all these targets will be presented in a followup paper (Cieza et al., in prep). In this Letter, we focus on the analysis of the [KS]-[24] colors of the extended sample (our SMA sample plus the objects discussed above) as a function of disk mass. For consistency, we calculate all disk masses from Eq. 1 (or Eq. 2 if 850 m data are not available), assuming the following distances: 50 pc for the TW Hydra association, 125 pc for Ophuichus, and 140 pc for the Taurus and Upper Sco regions.
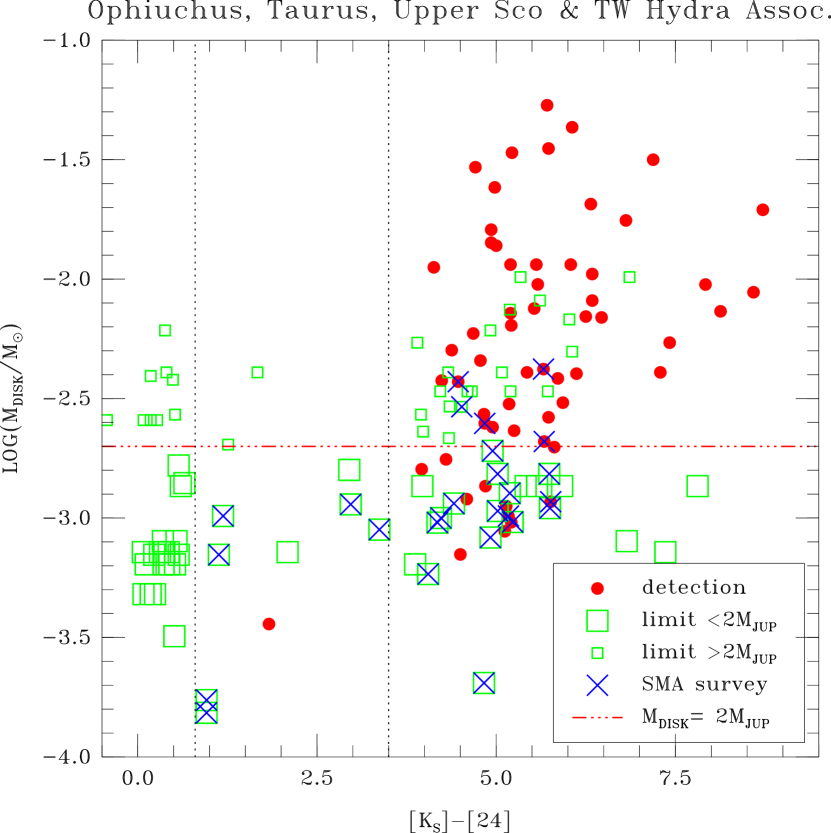
In Fig. 2 we plot disk mass as a function of [KS]-[24] color for the extended sample. This figure shows that our SMA study is significantly more sensitive than previous surveys. One striking result from Figure 2 is that all the objects with disk masses larger than 2 MJup have [KS]-[24] colors 3.5, consistent with optically thick 24 m emission (i.e. no object in the sample has a massive disk and optically thin 24 m emission). This result excludes any scenario in which most disks evolve exclusively from the inside out (e.g., an evolution dominated by grain growth). If that were the case, we would expect to see some massive disks with optically thin 24 m emission. Since the 24 m data probes the inner 10 AU of the disk, while the vast majority of the disk mass is outside this radius, any disk evolving strictly from the inside out would still retain most of its mass at the point where its 24 m emission is transitioning from optically thick to optically thin.
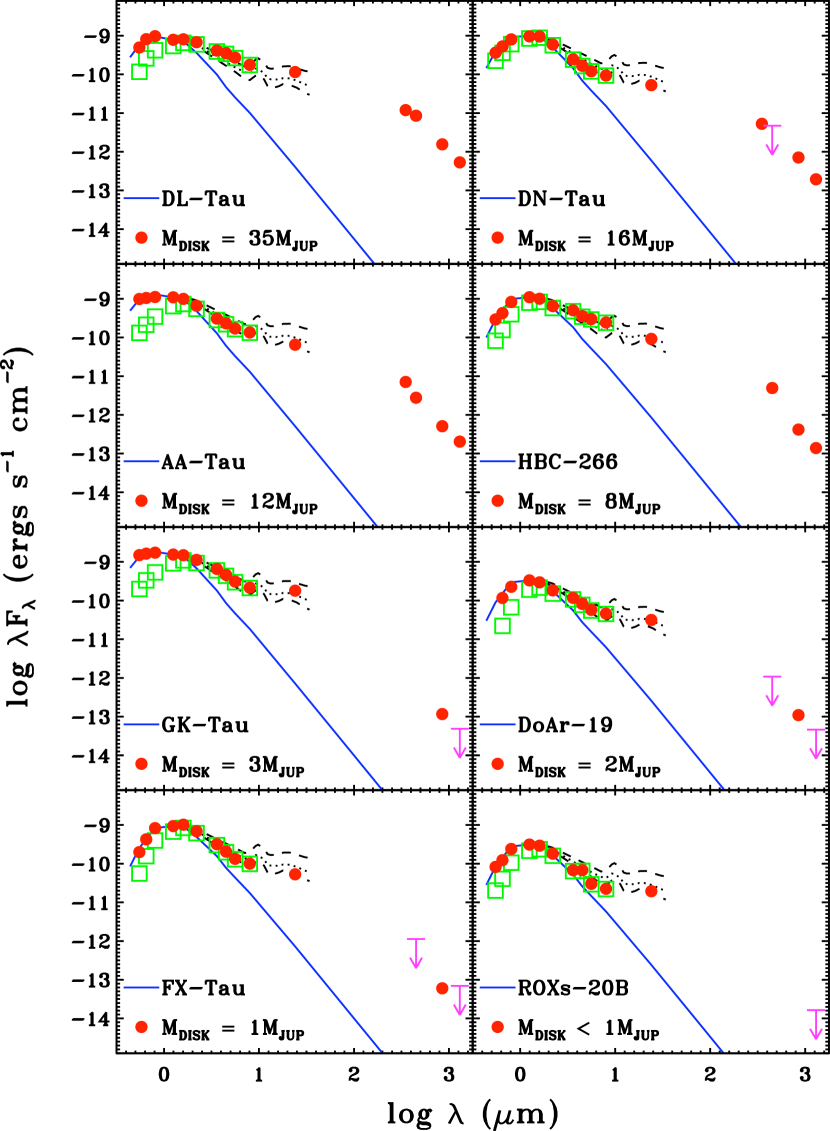
Fig. 2 suggests a scenario in which the levels of mid-IR excess emission remain constant while the mass of the disk is being depleted by 2 orders of magnitude through accretion onto the star. Such a scenario is illustrated by the SEDs in Fig 3. We note that the properties of the SEDs on the bottom of Fig. 3 and the top of Fig. 1 overlap. Together, they form a sequence in which a disk loses mass, maintaining a constant near- and mid-IR SED (Fig 3) until the mass of the disk reaches a critical level around 1 MJup, at which point the inner disk starts to dissipate from the inside out through photoevaporation (Fig 1). The SEDs in Figs. 1 and 3 are ordered, left to right and top to bottom, to illustrate this evolutionary sequence. However, their order should not be taken literately. Other factors, in addition to the evolutionary status of the disk, play a role in the morphology of an SED (e.g., disk inclination and stellar luminosity).
4.2 Implications for Disk Evolution
As discussed above, the data in Fig. 2 are inconsistent with disk evolution occurring strictly from the inside out as expected from disk evolution models dominated by grain growth (Dullemond Dominik, 2005). Planet formation is a considerably more complex process than grain growth. As such, its effect on the observable properties of disks are more uncertain. However, planet-formation models still make some testable predictions. In particular, forming planets with masses larger than 0.5-1 MJup should be able to open a gap in the disk independently of the disk mass (Edgar et al. 2007). The low masses of all the disks in our SMA sample suggests that their inner holes are not driven mainly by the formation of Jovian planets. However, the fact that the vast majority of our targets are non-accreting objects could introduce a strong bias against disks with planet-induced inner holes because, unless the planet is very massive (10 MJup), some disk material is expected to flow across the planet’s orbit and reach the star (Lubow et al. 1999). The SEDs of our sample are most consistent with those of photoevaporating disks. Photoevaporation models, such as those presented by Alexander et al. (2006), can simultaneously explain not only the properties of our SMA sample, but also many of the observational results discussed in this Letter, most notably:
a) The duration of the CTTS stage, the fact that most of their IR SEDs look alike, and their wide range of disk masses. According to photoevaporation models, during the first few Mys of evolution viscous accretions dominate over photoevaporation. The mass of the disk is depleted by accretion onto the star, but the accretion rate through the disk is large enough to replenish the inner disk. Thus, the IR SED remains unaffected, as seen in Fig 3.
b) The fraction of WTTS with disks, their SEDs, and their low disk masses. Photoevaporation predicts that all disks pass through a short ( 0.5 Mys) inside-out clearing phase once the accretion rate matches the photoevaporation rate (10-10 M⊙yr-1). During this clearing stage, the mass of the disk is predicted to be 0.05-0.5 MJup, depending on the exact ionizing flux and the viscosity law. This phase is in excellent agreement with the properties and incidence of WTTS disks (See Fig. 1). Also, we note that FW Tau, the transition object highlighted in Fig. 2, has a disk with a mass of 0.4 MJup, within the predicted range.
c) The low incidence of holes in disks that are massive or strongly accreting. Photoevaporation predicts that the inner disk will drain only after the outer disk has been significantly depleted of mass and the accretion rate becomes very small. Counter examples to this prediction exist, such as GM Aur and DM Tau (MDISK 25 MJup, MACC= 10-8 M⊙ yr-1, Najita et al. 2007), but their incidence seems to be of the order of a few percent. Other processes, such as grain growth or planet formation, must be responsible for their inner holes.
In practice, all the processes discussed in this Letter (grain growth, planet formation, and photoevaporation) are expected to operate simultaneously and affect one another. Other processes such as dynamical interactions in binary stellar systems are also likely to play a role (Ireland Kraus, 2008). However, the remarkable success of the photoevaporation models accounting for the many observational results listed above strongly suggests that, together with viscous accretion, photoevaporation is one of the dominant processes driving disk evolution. This conclusion seems to contradict the recent results by Najita et al. (2007), who find that only 2 out of the 12 transition objects they consider are consistent with photoevaporating disks. However, the different sample selection biases likely account for the discrepancy (Alexander 2008). Quantifying the relative importance of disk evolution mechanisms requires establishing specific observational metrics to distinguish among them and taking into consideration the details of the sample selection. Such a task is beyond the scope of this Letter, but will be attempted in a followup paper.
References
- Alexander et al. (2006) Alexander, R. D., Clarke, C. J., & Pringle, J. E. 2006, MNRAS, 369, 229
- Alexander (2008) Alexander, R. 2008, New Astronomy Review, 52, 60
- Andrews & Williams (2007) Andrews, S. M., & Williams, J. P. 2007, ApJ, 671, 1800
- Andrews & Williams (2005) Andrews, S. M., & Williams, J. P. 2005, ApJ, 631, 1134
- Artymowicz & Lubow (1994) Artymowicz, P., & Lubow, S. H. 1994, ApJ, 421, 651
- Brown et al. (2008) Brown, J. M., Blake, G. A., Qi, C., Dullemond, C. P., & Wilner, D. J. 2008, ApJ, 675, L109
- Calvet et al. (2002) Calvet, N., D’Alessio, P., Hartmann, L., Wilner, D., Walsh, A., & Sitko, M. 2002, ApJ, 568, 1008
- Carpenter et al. (2006) Carpenter, J. M., Mamajek, E. E., Hillenbrand, L. A., & Meyer, M. R. 2006, ApJ, 651, L49
- Cieza et al. (2007) Cieza, L., et al. 2007, ApJ, 667, 308
- Clarke et al. (2001) Clarke, C. J., Gendrin, A., & Sotomayor, M. 2001, MNRAS, 328, 485
- D’Alessio et al. (2005) D’Alessio, P., et al. 2005, ApJ, 621, 461
- Dullemond & Dominik (2005) Dullemond, C. P., & Dominik, C. 2005, A&A, 434, 971
- Edgar et al. (2007) Edgar, R. G., Quillen, A. C., & Park, J. 2007, MNRAS, 381, 1280
- Evans et al. (2003) Evans, N. J., II, et al. 2003, PASP, 115, 965
- (15) Evans II, N.J., Harvey, P., & Dunham, M.M., 2007, Final Delivery of Data from the c2d Legacy Project: IRAC and MIPS (Pasadena, SSC)
- Furlan et al. (2006) Furlan, E., et al. 2006, ApJS, 165, 568
- Hartmann et al. (1998) Hartmann, L., Calvet, N., Gullbring, E., & D’Alessio, P. 1998, ApJ, 495, 385
- Ho et al. (2004) Ho, P. T. P., Moran, J. M., & Lo, K. Y. 2004, ApJ, 616, L1
- Hueso & Guillot (2005) Hueso, R., & Guillot, T. 2005, A&A, 442, 703
- Ireland & Kraus (2008) Ireland, M. J., & Kraus, A. L. 2008, ApJ, 678, L59
- Lin & Papaloizou (1979) Lin, D. N. C., & Papaloizou, J. 1979, MNRAS, 188, 191
- Low et al. (2005) Low, F. J., Smith, P. S., Werner, M., Chen, C., Krause, V., Jura, M., & Hines, D. C. 2005, ApJ, 631, 1170
- Lubow et al. (1999) Lubow, S. H., Seibert, M., & Artymowicz, P. 1999, ApJ, 526, 1001
- Najita et al. (2007) Najita, J. R., Strom, S. E., & Muzerolle, J. 2007, MNRAS, 378, 369
- Skrutskie et al. (1990) Skrutskie, M. F., Dutkevitch, D., Strom, S. E., Edwards, S., Strom, K. M., & Shure, M. A. 1990, AJ, 99, 1187
- Wolk & Walter (1996) Wolk, S. J., & Walter, F. M. 1996, AJ, 111, 2066
| Name | KS | 24 m11 TWA and Oph data from Cieza et al. (2007) and Low et al. (2005), respectively. Upper Sco photometry obtained from archival data using the c2d pipeline (Evans et al. 2007). | 850 m22 Errors are 1- statistical uncertainties. Limits are 3-. | 1300 m22 Errors are 1- statistical uncertainties. Limits are 3-. | Mdisk |
|---|---|---|---|---|---|
| (mag) | (mJy) | (mJy) | (mJy) | (MJup) | |
| TWA 7 | 6.90 | 30 | 16 | 0.2 | |
| TWA 3 | 6.77 | 1650 | 473 | 1.0 | |
| TWA 13 | 7.50 | 18 | 16 | 0.2 | |
| TWA 4 | 5.58 | 8500 | 1155 | 644 | 1.2 |
| TWA 11 | 5.77 | 3030 | 9.4 | 0.2 |
Note. — This table is only a sample of the content. The complete version is in the electronic edition of the Journal.