Early Abnormal Temperature Structure of X-ray Looptop Source of Solar Flares
Abstract
This Letter is to investigate the physics of a newly discovered phenomenon — contracting flare loops in the early phase of solar flares. In classical flare models, which were constructed based on the phenomenon of expansion of flare loops, an energy releasing site is put above flare loops. These models can predict that there is a vertical temperature gradient in the top of flare loops due to heat conduction and cooling effects. Therefore, the centroid of an X-ray looptop source at higher energy bands will be higher in altitude, for which we can define as normal temperature distribution. With observations made by RHESSI, we analyzed 10 M- or X-class flares (9 limb flares). For all these flares, the movement of looptop sources shows an obvious U-shaped trajectory, which we take as the signature of contraction-to-expansion of flare loops. We find that, for all these flares, normal temperature distribution does exist, but only along the path of expansion. The temperature distribution along the path of contraction is abnormal, showing no spatial order at all. The result suggests that magnetic reconnection processes in the contraction and expansion phases of these solar flares are different.
1 Introduction
It is widely accepted that solar flare energy comes from sudden release of free magnetic energy via magnetic reconnection. In commonly adopted flare models, the ever-ascending Y-type reconnection point in the solar corona results in expanding flare loops and separation motion of flare foot points (FPs) (Kopp & Pneuman 1976). The expansion of flare ribbons and flare loops is an important signature of progressive magnetic reconnection in the corona. However, the contraction of flare loops in the early phase of flares may suggest a different reconnection scenario.
The signature for the contraction of flare loops has been reported by several authors (Sui et al. 2003, 2004; Li & Gan 2005; Liu et al. 2004; Veronig et al. 2006; Ji et al. 2004b, 2006, 2007, 2008). Contraction motion includes two aspects: the converging motion of FPs and the correlated downward motion of a LT source, such as the M1.1 flare of 2004 November 1 (Ji et al. 2006). The contraction picture is different from the shrinkage of flare loops with rooted FPs being fixed or still in expansion. From our experience, the similar event like the M1.1 flare is rare, since HXR FPs are usually missing during the initial phase of a flare, such as the X3.9 flare of 2003 November 3 (Veronig et al. 2006). To investigate the converging motion of FPs, the most preferable wavelength is Hα blue wing, at which Hα emission is believed to be caused by nonthermal electrons (Canfield et al. 1984).
The classical flare model puts the energy releasing site above flare loops, from which we can expect that a higher temperature source will be located above a lower temperature source due to heat conduction and cooling effects. In this Letter, we will name this distribution as normal temperature distribution (NTD). For the X10 flare of 2003 October 29, Ji et al. (2008) reported that a HXR sigmoid structure contracts during the impulsive phase of the flare. The contraction is the result of reconnection between two highly-sheared flux ropes. For magnetic reconnection between flux ropes, the existence of NTD is not required, since the energy releases inside flux ropes. Thus, temperature distribution along the altitude is an important factor for testing the reconnection scenarios.
Based on above thinking, we re-analyzed the M2.1 flare of 2002 September 9. The flare is a well-observed sample showing the early converging and subsequent separation motion of the flare kernels. We found that the motion of the HXR LT source is well correlated with that of the flare kernels. Notably, the NTD occurs only during the expansion period of flare loops. During the contraction period, higher and lower temperature structures are mixed together. To find supporting evidences for this abnormal temperature distribution during the contraction period, we surveyed nearly all M-class and X-class limb flares from 2002 to 2005, which were well-observed by RHESSI (Lin et al. 2002), we found at least 9 events showing the phenomenon.
In §2 we present the result of the flare of 2002 September 9, in §3 we give the other 9 supporting events. Discussions and conclusions are briefly given in §4.
2 The flare of 2002 September 9
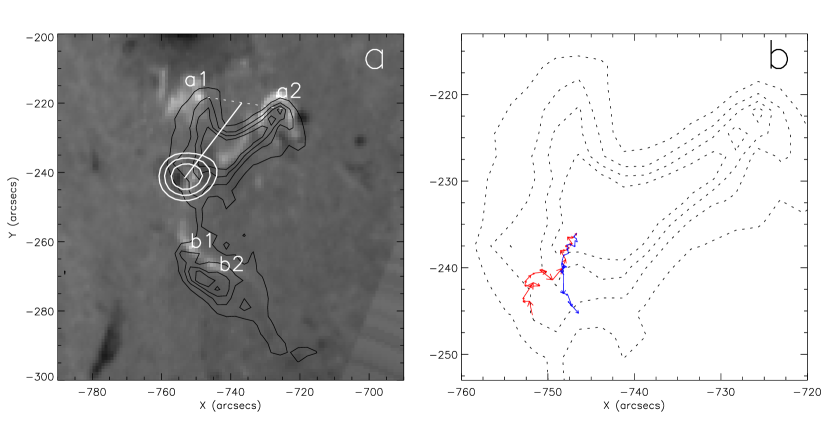
The M2.1 flare occurred on 2002 September 9, starting at 17:40. The flare was well observed at Big Bear Solar Observatory at Hα-1.3Å with very high time resolution (40 ms). By analyzing the flare with detailed spatial, spectral and temporal information, Ji et al. (2004a) identified nonthermal and thermal (multiple temperature) HXR spikes. They further reported that the distance between the two Hα conjugate kernels decreases during the impulsive phase of the flare. Only after the impulsive phase, the distance has a steady increase showing the usual separation motion (Ji et al. 2004b). They also mentioned that the height of the HXR looptop source decreases during the impulsive phase. The flare has two pair of conjugate kernels in Hα blue wing (a1-a2, and b1-b2 in Figure 1). From Figure 1a, we can clearly see two EUV loop systems connecting a1 to a2 and b1 to b2 respectively. Judged from temporal and spatial relationship between HXR emission and Hα emission, HXR emissions of this event come dominantly from the flare loops connecting a1 to a2. Furthermore, there is an over 1 minute delay for kernels b1 and b2 and the magnetic reconnection producing b1 and b2 was induced by the magnetic reconnection producing a1 and a2 via loop interactions (Huang & Ji 2005).
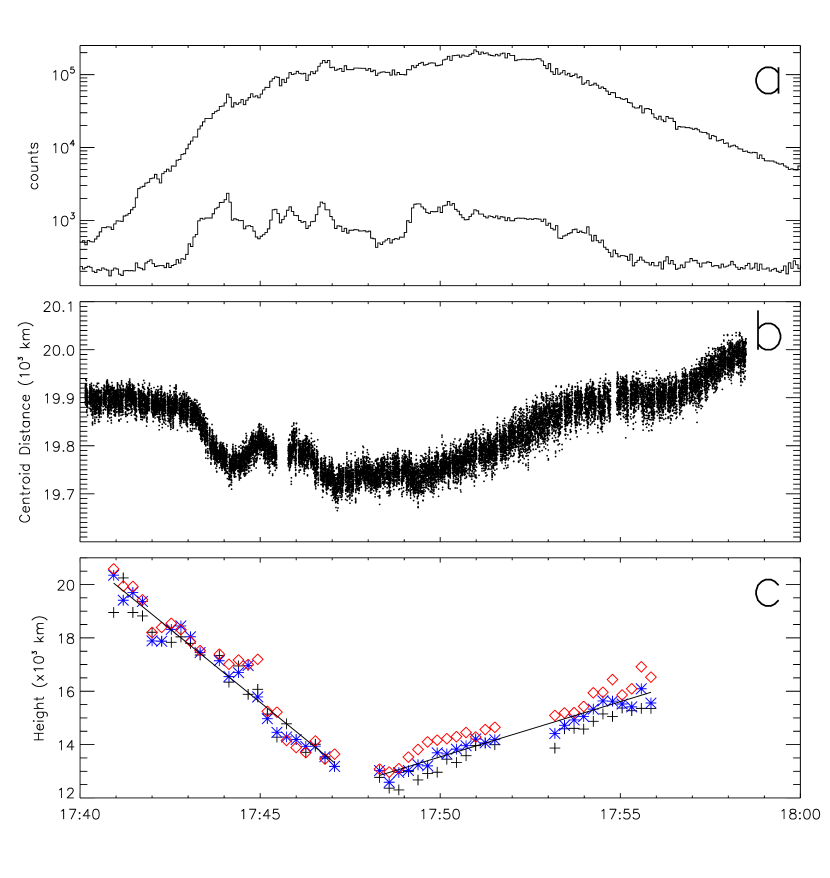
To study the moving behavior of the HXR LT source, we constructed RHESSI CLEAN HXR maps in the energy ranges of 8-10, 10-13, and 13-16 keV using 16-s time bin. HXR emissions in these energy ranges originate from the top of the EIT 195 Å flare loops connecting a1 and a2 (Figure 1). The CLEAN maps were made with natural weighting using grids 3-8, in which the maps have an FWHM spatial resolution of 10 arcsec. Note that the emission centroids can be determined with an accuracy of 1 arcsec, depending on the count statistics (Hurford et al. 2002). We measured the LT source’s centroid positions within the contour level of 50% using a tool provided by RHESSI software. The temporal series of centroid positions of the LT source in the energy range of 10-13 keV is shown in Figure 1b, in which red arrows show downward moving direction and blue ones show upward motion. We measured the distance from the centroid of the LT source to the base of the flare loops. Since the flare loops are clearly seen, the distance can be reasonably regarded as the projected height. The time profiles for the ‘height’ measured at three different energy ranges are plotted in Figure 2c. For comparison, the time profile of HXR emission in the energy range 25-50 keV and the distance between the two Hα kernels are given in Figure 2a-b. We can find that the motion of the HXR LT source is well correlated with the relative motion between the two Hα kernels. This confirms the picture of early contraction and subsequent expansion of flare loops, as summarized by Ji et al. (2007).
During the expansion period, the temperature structure shows an NTD (Fig. 2c). This is in agreement with what the standard flare model predicts with an energy releasing site above flare loops. However, during the contraction period, the temperature structure of the LT source is rather complex or abnormal. The LT sources in the three energy bands are almost mixed with one another. The abnormal temperature distribution in the contraction period obviously suggests a complex magnetic reconnection process.
3 Supporting observations
To find supporting evidences, we surveyed 70 limb flares well observed by RHESSI from 2002 to 2005, most of them are M-class or X-class. For each event, we constructed RHESSI Clean maps in the energy ranges of 8-10, 10-13, and 13-16 keV with a time bin of 12 seconds. HXR emissions at these energy ranges usually come from flares’ LT. We selected those events with a single LT source and the LT source exhibits an obvious U-shaped trajectory (only one turning point), which is assumed to be the signature of early downward motion and subsequent upward motion. An additional requirement is that the downward motion should last more than 1 minutes. According to this criteria, 12 events could be selected for the study including the three homologous flares investigated by Sui et al. (2004). In this paper, we will not include the three homologous flares (see Table 1 for the nine flares).
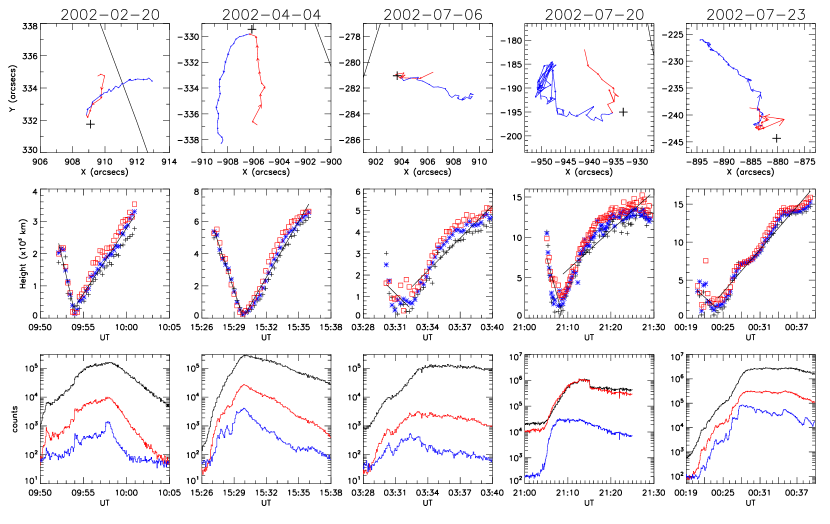
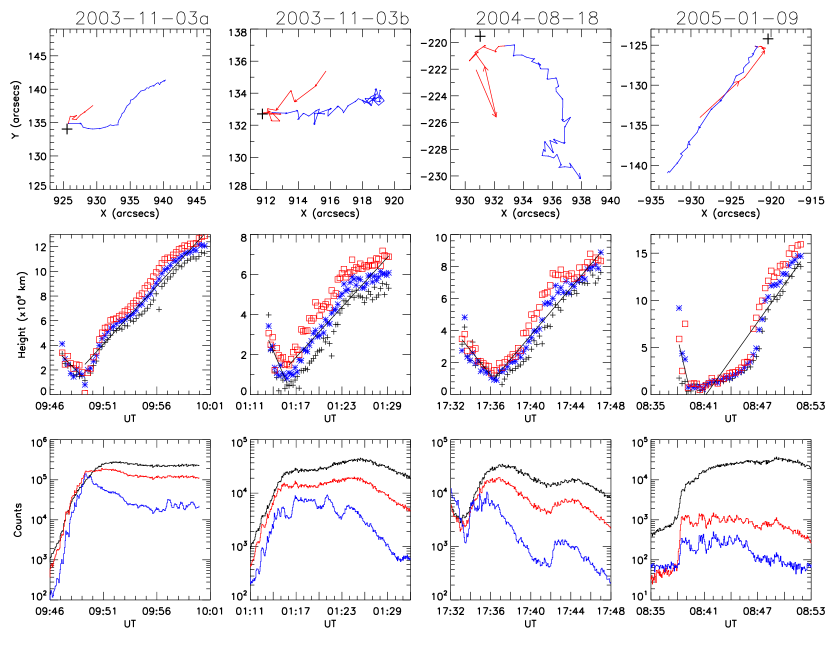
Even for limb events, it is hard to measure the actual height of a HXR LT source with respect to solar photospheric surface. Actually, as Sui et al. (2003, 2004) noted, the motion of LT sources of a limb event is usually not in radial direction. A reference point is needed to estimate the height of a HXR LT source. For the flare of 2002 September 9, the reference point is chosen as the center of the line connecting the two FPs of the flare loop. For each of the 9 events, a turning point around the base of the U-shaped path is taken as the reference point, from which the ‘height’ of a LT source is estimated. The trajectories of LT sources of the nine events are plotted in the top panels of Figures 3-4, in which nine “+” signs show the positions of reference points for the events. We can see that before and after the turning point the trajectories of the LT sources can be roughly fitted by two straight lines.
The time profiles for the ‘height’ of the LT sources at different energy ranges are plotted in the middle panels of Figures 3-4. For comparison, the light curves of corresponding event in different energy ranges are plotted in the lower panels. For all nine events, we can find that well-established NTD does occur but only in the expansion phases. During the contraction periods, high energy and low energy sources are spatially mixed. It is worth mentioning that the height curve in the first column of Figure 4 for the flare of 2003 November 3 has been reported by Veronig et al. (2006). Figures 3-4 conform the results that we obtained for the 2002 September 9 event. Turning points occur during the rising phases of the flares. To some events turning points coincide with peak times of the light curves.
4 Discussion and Conclusions
In this Letter, we report the finding of the early abnormal temperature distribution of flares’ X-ray LT sources during contraction phase of ten solar flares. In a 2D framework for flare models, an energy releasing site is assumed to be above flare loops. Following the scenario, we can expect that a LT source at higher energies will be higher in altitude due to heat conduction and cooling effects. The results from the ten flares show that this expectation can be met, but only during the expansion phase of solar flares. During the contraction period, however, high energy and low energy LT sources are mixed, showing a kind of abnormal temperature distribution.
The physics for the contraction of flare loops is still not well-understood. From above ten events, we have seen that the turning points in the trajectories of the LT sources occur near flare peak times. Therefore, the contraction is related to magnetic reconnection in the impulsive phase of solar flares. Ji et al. (2008) reported that, during the contraction period of the X10 flare of 2003 October 29, HXR emissions at all energies share the similar sigmoidal configuration. The contraction corresponds to the shrinkage of the HXR sigmoid, which is the result of magnetic reconnection between highly-sheared flux ropes. We may propose that the abnormal temperature distribution is associated with magnetic reconnection between highly-sheared flux ropes. On the other hand, the downward and upward phases of the LT motion may reflect two regimes of reconnection: bursting and no-bursting (Karlický 2008: private communication). The abnormal temperature structure can be explained by a presence of small plasmoids in the current sheet just above contracting arcade. The plasmoids are formed in the bursting regime of the reconnection and move also downwards where they interact with the arcade. This interaction represents additional reconnection that changes the normal temperature structure (Bárta et al. 2008; Kolomański & Karlický 2007). In the phase of the upward LT motion the reconnection take place without these plasmoids (no-bursting regime of the reconnection). Therefore the temperature is in agreement with the prediction made by standard flare models.
References
- Bárta et al. (2008) Bárta, M., Vršnak, & Karlický, M. 2008, A&A 477, 649
- Canfield et al. (1984) Canfield, R. C., Gunkler, T. A., & Ricchiazzi, P. J. 1984, ApJ, 282, 296
- Huang et al. (2005) Huang, G. & Ji, H. 2005, Solar Phys, 227, 236
- Hurford et al. (2002) Hurford et al. 2002, Solar Phys., 210, 61
- Ji et al. (2004) Ji, H., Wang, H., et al. 2004a, ApJ, 605, 938
- Ji et al. (2004) Ji, H., Wang, H., Goode, P. R., Jiang, Y., & Yurchyshyn, V. 2004b, ApJ, 607, L55
- Ji et al. (2006) Ji, H., Huang, G., Wang, H. et al. 2006, ApJ, 636, L173
- Ji et al. (2007) Ji, H., Huang, G., & Wang, H. 2007, ApJ, 660, 893
- Ji et al. (2008) Ji, H., Wang, H., Liu, C., & Dennis, B.R. 2008, ApJ, 680, 734
- Kolomański & Karlický (2007) Kolomański, S. & Karlický, M., 2007, A&A, 475, 685
- Kopp et al. (1976) Kopp, R. A. & Pneuman, G. W. 1976, Solar Phys, 108, 251
- Li et al. (2005) Li, Y. & Gan, W. 2005, ApJ, 629, L37
- Lin et al. (2002) Lin, R. P. et al. 2002, Solar Phys., 210, 3
- Liu et al. (2004) Liu, W., Jiang, Y. W., Liu, S., & Petrosian, V. 2004, ApJ, 611, L53
- Sui et al. (2003) Sui, L. & Holman, G. D. 2003, ApJ, 596, L25
- Sui et al. (2004) Sui, L., Holman., G. D., & Dennis, B. R. 2004, ApJ, 546, 556
- Veronig et al. (2006) Veronig, A. M. et al. 2006, A&A, 446, 657
| Date | Class | Starting | Peak Time | Turning | Descending | Expanding | |
|---|---|---|---|---|---|---|---|
| Time | Time∗ | Time | Speed (km) | Speed (km) | |||
| 2002-09-09 | M2.3 | 17:40 | 17:49 | 17:48 | 18.3 | 6.8 | |
| 2002-02-20 | M4.3 | 09:46 | 09:58 | 09:54 | 19.2 | 6.8 | |
| 2002-04-04 | M6.1 | 15:24 | 15:30 | 15:30 | 33.5 | 19.2 | |
| 2002-07-06 | M1.8 | 03:24 | 03:33 | 03:32 | 8.2 | 8.3 | |
| 2002-07-20 | X3.5 | 20:52 | 21:08 | 21:08 | 32.3 | 8.1 | |
| 2002-07-23 | X4.8 | 00:17 | 00:28 | 00:23 | 12.3 | 15.6 | |
| 2003-11-03a | X3.9 | 09:43 | 09:49 | 09:49 | 14.7 | 15.7 | |
| 2003-11-03b | X2.9 | 01:01 | 01:17 | 01:16 | 14.8 | 6.9 | |
| 2004-08-18 | X2.5 | 17:31 | 17:36 | 17:36 | 12.9 | 12.3 | |
| 2005-01-09 | M2.4 | 08:25 | 08:39 | 08:39 | 67.0 | 22.1 |
* The peak time is according to RHESSI light curve in the energy band of 30-50 keV.