FERMILAB-PUB-08/334-E
Search for pair production of second generation scalar leptoquarks
Abstract
We report on a search for the pair production of second generation scalar leptoquarks () in collisions at the center of mass energy TeV using a data set corresponding to an integrated luminosity of collected with the D0 experiment at the Fermilab Tevatron Collider. Topologies arising from the and decay modes are investigated. No excess of data over the standard model prediction is observed and upper limits on the leptoquark pair production cross section are derived at the C.L. as a function of the leptoquark mass and the branching fraction for the decay . These are interpreted as lower limits on the leptoquark mass as a function of . For , scalar second generation leptoquarks with masses up to 316 GeV (270 GeV) are excluded.
pacs:
14.80.-j, 13.85.RmThe observed symmetry between lepton and quark generations could be explained by new gauge bosons introducing couplings between the lepton and quark sectors. Such particles, commonly referred to as leptoquarks lqth , would carry both lepton and baryon quantum numbers as well as fractional electric charge. Extensions of the standard model (SM) based on a larger gauge symmetry group usually predict the existence of massive leptoquarks. Experimental bounds on lepton number violation, proton decay, and flavor changing neutral currents constrain hypothetical leptoquarks with masses of several hundred GeV to a few TeV to couple only to one quark and one lepton family, via processes conserving both lepton and baryon quantum numbers. Three generations of leptoquarks can thus be distinguished by considering the lepton observed in the leptoquark decay.
At the Fermilab Tevatron Collider, leptoquarks would predominantly be produced in pairs via annihilation into a gluon in the -channel independently of the unknown coupling between the leptoquark and its associated lepton and quark. Thus, for scalar leptoquarks the production cross section depends only on the strong coupling constant and the assumed leptoquark mass. The additional contribution to leptoquark pair production from -channel lepton exchange with a cross section proportional to can be neglected. When adopting the assumption that the leptoquarks couple to leptons and quarks of the same generation, the -channel process is further suppressed for second and third generation leptoquarks due to the vanishing parton distribution functions (PDFs) at high proton momentum fractions for partons other than and quarks. Leptoquarks can decay either into a charged lepton and a quark with a branching fraction or into a neutrino and quark with a branching fraction , assuming that the leptoquark mass is much larger than the masses of its decay products, which is generally the case for first and second generation leptoquarks. Consequently leptoquark pair production could lead to three characteristic final states: , , and , with branching fractions , , and , respectively.
This Letter describes a search for second generation scalar leptoquark pair production in the decay modes and using collisions at the center of mass energy TeV recorded with the D0 detector. These channels lead to topologies with one muon, missing transverse energy (from which the transverse momentum of the neutrino is inferred), and two jets ( signature), or with two muons and two jets ( signature), respectively. At Run II of the Tevatron, the dimuon signal was previously studied by the D0 collaboration d0lq2 while the CDF collaboration studied both dimuon and single muon signals cdflq2 with smaller data sets. Since one of the muons of the decay mode might not be reconstructed, this signal contributes to the single muon signature as well, which is taken into account in our analysis. The contribution of in the dimuon selection can be neglected due to the small probability for a jet to mimic an isolated muon.
The signal sensitivity for both signatures depends on . The branching fractions for the decay modes and are maximal at and , respectively. The branching fraction of both decay modes vanishes for , where the leptoquark would decay exclusively into a neutrino and quark. The resulting acoplanar jet topology has not been investigated in this analysis, but was studied recently using a larger data set d0lqaco2 .
The D0 detector run2det is designed to maximize the detection and identification of particles arising from interactions and is constructed of dedicated subsystems arranged around the interaction point. The central tracking system, located at the innermost part of the detector, consists of a silicon microstrip tracker (SMT) and a central fiber tracker (CFT) which cover the pseudorapidity regions and , respectively. The pseudorapidity is defined as where is the polar angle with the proton beam. A 2 T superconducting solenoidal magnet is positioned between the tracking system and the surrounding central and forward preshower detectors. The calorimeter is composed of a central section (CC) which covers and two end calorimeters (EC) that extend coverage to . The three calorimeter sections are housed in their own cryostats and consist of successive layers of mostly uranium absorbers and active liquid argon run1det . The muon system run2muon is located outside the calorimeter and covers the region . It consists of a layer of drift tubes and scintillation counters before 1.8 T iron toroids and two similar layers outside the magnets.
This search for leptoquark pair production is based on an integrated luminosity of fb-1. The data samples for the single muon and dimuon analyses are selected with combinations of single muon triggers pcthesis .
Muons are identified in the region using track segments found in the muon detector which are required to have hits in both the drift tubes and the scintillation counters. The segments are matched to tracks reconstructed in the central tracking system which determine the muon momenta. Muons with a transverse momentum are kept. A veto on cosmic ray muons is applied which is based on timing information in the muon system and the removal of events with an apparent muon pair back-to-back in pseudorapidity. For the selection, a tight muon identification is applied in order to suppress events without prompt muons. Tight quality is defined by requiring additional hits in the muon detector and that the muon track be isolated from other tracks with the sum of the transverse momenta of all other tracks in a cone defined in terms of and azimuth with radius around the muon less than 2.5 GeV pcthesis . The muon isolation is further improved by selecting events in which the energy measured in the calorimeter in a hollow cone of radius around the muon is less than 2.5 GeV. In the case of the selection, where the existence of two reconstructed muons allows for a better separation of signal and background, the hit requirement is loosened and only a track isolation criterion with a threshold of 4 GeV on the transverse momentum sum is required (loose quality).
Jets are reconstructed with an iterative, midpoint cone algorithm with a cone radius of d0jets . Only jets found within and with are kept. The jet energies are calibrated as a function of the jet transverse energy and d0incljet .
The transverse momentum of a final state neutrino can be inferred from the , calculated as the vector sum of the transverse energies in the calorimeter cells which is corrected with the transverse momenta of the selected muons and the jet energy calibration.
The main SM background to the pair production of leptoquarks followed by their decay into the and final states is the associated production of jets with and bosons, respectively. Vector boson production is simulated using the alpgen event generator alpgen which is interfaced to pythia pythia for the simulation of parton showering and hadronization. Samples with up to five or three partons in addition to the or boson, respectively, are generated and combined using the MLM matching prescription mlm . For these samples as well as for the ones described below, the CTEQ6L1 PDF sets cteq are used. Additional samples for and boson production are generated with the pythia event generator and utilized to determine uncertainties in the transverse momentum shape of the associated jets. Top quark pair production also contributes to the analyzed final states and is simulated with pythia assuming a top quark mass of 175 GeV. The multijet background, in which a jet is misidentified as an isolated muon, is estimated from data for the selection by inverting the muon isolation requirement and normalizing the obtained rate to data with standard isolation in a region with , which is dominated by multijet events. In the selection, the requirement of two reconstructed muons with large invariant mass suppresses background from multijet production. The background contribution from diboson or single top quark production, which could potentially contribute in both single muon and dimuon analyses, are found to be negligible as well. Leptoquark pair production is simulated using pythia for leptoquark masses ranging from 140 GeV to 320 GeV, corresponding to production cross sections between 2.4 pb and 0.0074 pb. The generated events are processed through a full simulation of the D0 detector based on geant geant .
Leptoquark candidate events are selected by requiring at least two jets with and muons with . For the signature at least two muons of loose quality are required, while for the selection, events with exactly one muon of tight quality are kept and a veto on events with additional loose muons is applied to ensure that the samples have no overlap.
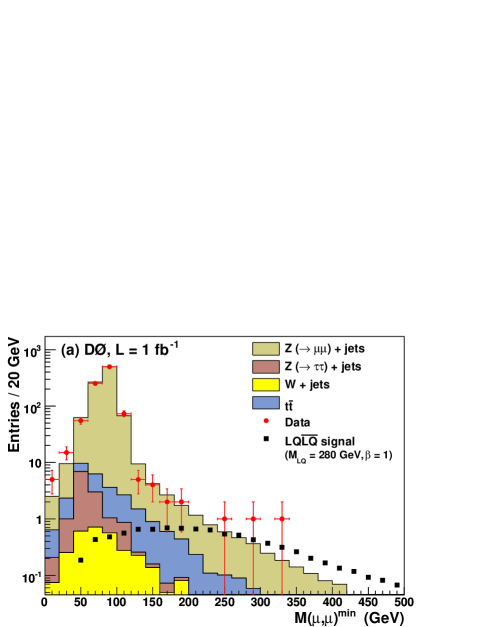
For the sample, the dimuon invariant mass reconstructed from the two leading muons (i.e. muons with highest ) is required to be larger than 50 GeV. The numbers of and boson events are simultaneously normalized to data with a common scale factor in the region of the boson resonance (defined as ) after all the preceding cuts. At this stage, 913 data events and expected background events remain, with a signal efficiency of 39.7% for an assumed leptoquark mass .
To account for the muon resolution which can result in an overestimation of and a mismeasurement of , and in order to enhance the separation between signal and background, the reconstructed dimuon invariant mass is corrected by substracting the projection of onto the leading muon direction from the leading muon . In this way is minimized, which is consistent with the expectation that there is no genuine in both signal and background. The minimum of the initial and corrected dimuon invariant mass is utilized as a selection variable to improve the rejection of bosons (Fig. 1). To achieve signal enhancement and background reduction, the sum of the transverse momenta of the two muons and the two leading jets, , is also considered since the decay products of the SM backgrounds are likely to be less energetic than those of the leptoquark pair. All combinations of the two muons with the two leading jets are taken to calculate four muon-jet invariant masses which are related to the leptoquark mass for the signal processes. Together with and , these four muon-jet invariant masses define the set of discriminating variables that will be used for limit determinations.
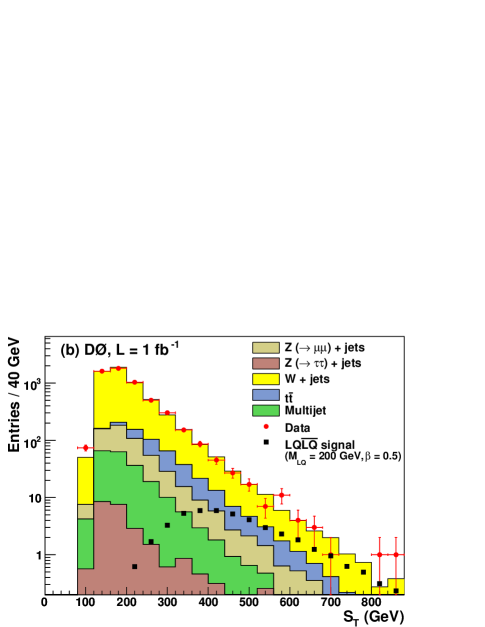
In the case of the selection, the rate of multijet events is reduced by requiring the transverse mass reconstructed from the muon and the missing transverse energy to be larger than 50 GeV and also by imposing . In order to remove events with mismeasured muon , which could lead to large , the azimuthal angle between the missing transverse energy and the muon is constrained to be smaller than 3.0 radians. After applying the preceding cuts, the contribution from and boson production is simultaneously normalized to data with a common scale factor in the region , which is dominated by boson production. At this stage, 5693 data events and expected background events remain. When assuming , the corresponding signal efficiencies for and events are 22.6% and 10.2%, respectively.
Similar to the dimuon sample, six discriminating variables are chosen for the single muon selection. provides a good separation between signal and boson events. The large mass of the hypothetical leptoquark motivates the choice of the following kinematic variables: the sum of and the transverse momenta of the final state muon and the two jets, (Fig. 1), the two transverse masses constructed from the missing transverse energy and each of the two highest jets, and the two invariant masses derived from the muon and the two leading jets.
For each of the two selections, the six discriminating kinematic variables are combined into a multivariate classifier. A good separation between the leptoquark signal and the SM background is obtained with the k-Nearest-Neighbors algorithm (kNN), as implemented in the tmva tmva library. The classification relies on the comparison of a test event to reference events taken from training data sets. The implemented algorithm can be interpreted as a generalization of the maximum likelihood classifier to n dimensions, where n is the number of variables used for the discrimination of signal against background. During the training phase, the classification of an event as being either signal or background is achieved by estimating the local signal-like probability density. This is defined as the ratio of the signal events over the background plus signal events in the vicinity of the tested event, such that the denominator, i.e. the number of neighbor events, is equal to the input parameter . For our analysis, the optimal value for is found to be 50, which results in nearly maximal signal over background ratios for reasonable computing times. The output of the discriminant takes values between 0 and 1, 0 referring to the most background-like events and 1 to the most signal-like.
The training phase is performed for each assumed leptoquark mass in the range between 140 and 320 GeV separately (in steps of 20 GeV), and is based on simulated signal and background samples for which additional selections are imposed to remove regions with negligible signal contribution. For both channels, the corresponding variable is required to be greater than 200 GeV, while and are required to exceed 100 GeV and 110 GeV for the dimuon and the single muon analyses, respectively. In the case of the selection, the shape of the signal event distributions does not vary as a function of , as the topologies arising from the (with one muon not being reconstructed) and decay modes are similar. Only one value of is therefore needed to complete the training for this channel. In the case of the dimuon analysis, only the signal events contribute and are considered. The performance of the training phase for the different assumed leptoquark masses is thus also independent of .
In order to avoid overtraining on statistical fluctuations, the training phase is performed on half of each signal and background samples. When using the signal and background samples to train the kNN classifier, alternatively one event is kept for the training and the next one is included in a test sample. Good agreement in the kNN distributions between the training and the test samples is observed, which demonstrates the absence of overtraining.
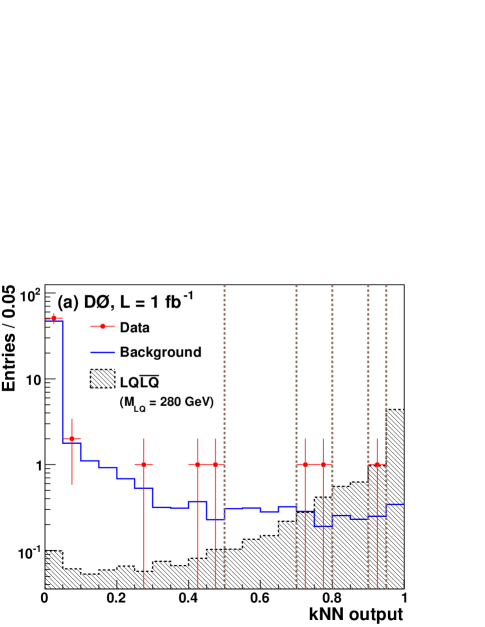
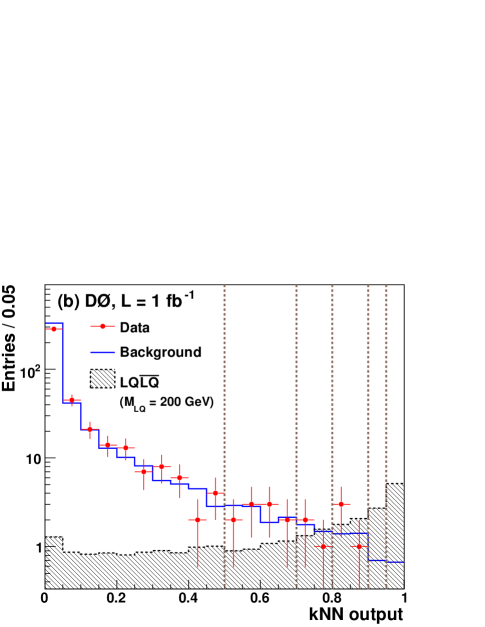
Instead of cutting on the kNN variable, we choose a strategy to optimize the sensitivity that uses the shape of the full kNN distribution. The kNN distributions are divided into six bins of variable size which decrease with increasing signal efficiency: 0–0.5, 0.5–0.7, 0.7–0.8, 0.8–0.9, 0.9–0.95, and 0.95–1. The same binning is used for each assumed leptoquark mass and value. The distributions of the kNN output variable are shown for both selections in Fig. 2. The content of each bin is given in Tables 1 and 2 for the and selections, respectively.
| Samples | |||
|---|---|---|---|
| 0.57 0.12 0.07 | 0.0045 0.0045 0.0008 | ||
| 48 1 6 | 1.00 0.09 0.18 | 0.42 0.04 0.03 | |
| 4.4 0.1 0.8 | 0.22 0.03 0.08 | 0.058 0.018 0.02 | |
| Total background | 53 1 6 | 1.2 0.1 0.2 | 0.48 0.05 0.04 |
| Data | 56 | 0 | 2 |
| (%) | 2.94 | 2.47 | 2.83 |
| 0.69 0.02 0.05 | 0.59 0.02 0.02 | 0.67 0.02 0.03 | |
| Samples | |||
| 0.0024 0.0024 0.0005 | |||
| 0.43 0.03 0.15 | 0.22 0.03 0.02 | 0.31 0.03 0.04 | |
| 0.058 0.016 0.014 | 0.031 0.010 0.009 | 0.035 0.011 0.007 | |
| Total background | 0.49 0.04 0.16 | 0.25 0.03 0.03 | 0.34 0.03 0.05 |
| Data | 0 | 1 | 0 |
| (%) | 4.81 | 3.97 | 18.0 |
| 1.13 0.02 0.04 | 0.94 0.02 0.03 | 4.23 0.05 0.22 |
| Samples | |||
|---|---|---|---|
| 348 5 44 | 6.1 0.5 1.3 | 1.8 0.3 0.4 | |
| 53 1 6 | 1.13 0.22 0.15 | 0.40 0.07 0.08 | |
| 34.9 0.4 6.5 | 2.5 0.1 0.5 | 1.0 0.1 0.2 | |
| Multijet | 8.3 0.3 1.7 | 0.030 0.017 0.006 | 0.020 0.014 0.004 |
| Total background | 444 5 53 | 9.8 0.6 1.7 | 3.3 0.3 0.6 |
| Data | 405 | 10 | 3 |
| (%) | 5.19 | 2.35 | 1.73 |
| (%) | 3.57 | 1.08 | 0.517 |
| 8.9 0.1 0.4 | 3.9 0.1 0.1 | 2.8 0.1 0.2 | |
| Samples | |||
| 1.7 0.3 0.5 | 0.31 0.09 0.24 | 0.39 0.13 0.18 | |
| 0.23 0.04 0.01 | 0.11 0.02 0.01 | 0.064 0.006 0.022 | |
| 0.84 0.05 0.19 | 0.26 0.03 0.05 | 0.21 0.03 0.06 | |
| Multijet | 0.030 0.017 0.006 | 0.020 0.014 0.004 | 0.0099 0.0099 0.0020 |
| Total background | 2.8 0.3 0.5 | 0.70 0.10 0.25 | 0.67 0.14 0.22 |
| Data | 4 | 0 | 0 |
| (%) | 2.28 | 1.64 | 3.15 |
| (%) | 0.718 | 0.444 | 0.600 |
| 3.7 0.1 0.1 | 2.6 0.1 0.1 | 5.0 0.1 0.3 |
The systematic uncertainties on the predicted number of background events and on the signal efficiencies are studied by varying the efficiencies and resolutions for the reconstructed objects and the modeling of both background and signal within their uncertainty range pcthesis . For each uncertainty source and for each assumed value for and , the kNN output variable is recalculated and the deviation observed in each of the kNN bins used for the classification is taken as the systematic uncertainty. Below we quote the uncertainties obtained when assuming and for the analysis and and for the selection. For other assumptions on and , the uncertainties are similar.
The dominant systematic uncertainties are listed in Table 3. For the background they include uncertainties on the muon resolution, the jet energy scale, the cross section, and the modeling of jet radiation in jets events. The latter is studied by comparing the distribution of the second highest jet observed in data with the predictions of the alpgen and pythia event generators when selecting boson or boson events. While alpgen correctly reproduces the shape observed in data, pythia is found to underestimate the rate at large . A mixture of alpgen and pythia events, with a 30% (43%) contribution of the latter, gives an acceptable description for jets (+jets) events with a Kolmogorov-Smirnov probability corresponding to a variation.
Additional uncertainties arise from the efficiencies of the muon trigger and the muon identification (2%), of the jet reconstruction (0.5%), and from the normalization of the jets background (2%). The relative uncertainty on the integrated luminosity is equal to 6.1% d0lumi . The uncertainty on the multijet background in the analysis due to the extrapolation into the signal region and due to its normalization is estimated to be 20%.
For the signal efficiency and acceptance, the following systematic uncertainties are studied in addition to the uncertainties arising from the muon and jet measurements. The uncertainty due to the PDF choice is determined to be 1.6%, using the twenty-eigenvector basis of the CTEQ6.1M PDF set cteq . The effects of initial and final state radiation (ISR and FSR), which might lead to the generation of additional jets, are studied by varying the pythia parameters controlling the QCD scales and the maximal allowed virtualities used in the simulation of the space-like and time-like parton showers. The corresponding uncertainty on the signal efficiencies is determined to be 1.5%.
| channel | channel | |||||
|---|---|---|---|---|---|---|
| Uncertainty | ||||||
| Muon resolution | ||||||
| Jet energy scale | ||||||
| jets model | ||||||
| cross section | ||||||
| ISR/FSR | ||||||
| channel | channel | Combination | |||||
|---|---|---|---|---|---|---|---|
| mass | |||||||
| (GeV) | (pb) | (pb) | (pb) | (pb) | (pb) | (pb) | (pb) |
| 140 | 2.38 | 0.291 | 0.395 | 0.0446 | 0.0503 | 0.127 | 0.0426 |
| 160 | 1.08 | 0.219 | 0.204 | 0.0392 | 0.0357 | 0.129 | 0.0338 |
| 180 | 0.525 | 0.144 | 0.144 | 0.0278 | 0.0257 | 0.0832 | 0.0223 |
| 200 | 0.268 | 0.0770 | 0.106 | 0.0262 | 0.0206 | 0.0551 | 0.0220 |
| 220 | 0.141 | 0.0619 | 0.0841 | 0.0215 | 0.0177 | 0.0484 | 0.0186 |
| 240 | 0.0762 | 0.0540 | 0.0623 | 0.0202 | 0.0152 | 0.0374 | 0.0157 |
| 260 | 0.0419 | 0.0516 | 0.0572 | 0.0171 | 0.0135 | 0.0348 | 0.0142 |
| 280 | 0.0233 | 0.0440 | 0.0514 | 0.0135 | 0.0120 | 0.0281 | 0.00946 |
| 300 | 0.0131 | 0.0423 | 0.0470 | 0.0114 | 0.0107 | 0.0255 | 0.00931 |
| 320 | 0.00739 | 0.0398 | 0.0390 | 0.0100 | 0.0101 | 0.0227 | 0.00822 |
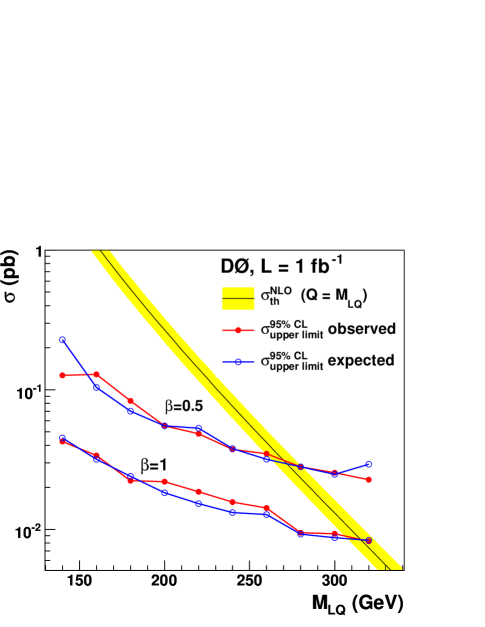
For both selections no excess of data over the predicted background is observed. Upper limits at the C.L. on the leptoquark production cross section are calculated for both selections separately and their combination using the method proposed in Ref. cls . Since both decay modes and contribute in the single muon selection, limits on the product of and the branching fraction cannot be derived and thus the cross section limits need to be evaluated for each value of separately. The six bins (or twelve bins in case of the combination) in the kNN discriminant are treated as individual channels and their likelihoods are combined with correlations of systematic uncertainties taken into account. The limits are calculated using the confidence level , where and are the confidence levels for the signal plus background and background only hypotheses, respectively cls .
The observed cross section limits and the expected limits are shown in Fig. 3 and Table 4 together with the theoretical prediction for scalar leptoquark pair production calculated at next-to-leading order (NLO) in the strong coupling constant lqnlo using the CTEQ6.1M PDF set cteq and the renormalization and factorization scale . Limits for both selections and their combination are given assuming and . The uncertainty band for the cross section prediction shown in Fig. 3 reflects the PDF uncertainty cteq and the variation of the factorization and renormalization scale between and , added in quadrature.
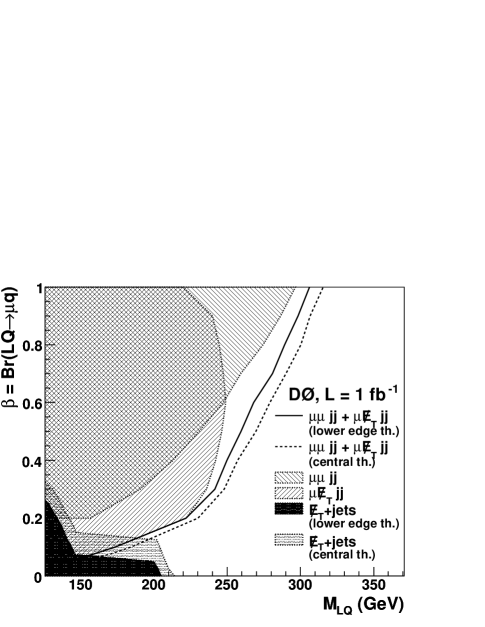
Limits on the leptoquark mass are extracted from the intersection of the observed upper bound on the cross section with the NLO prediction and also the lower edge of its uncertainty band. Combining the and selections and using the central theoretical prediction, lower bounds on the mass of second generation leptoquarks are determined at the C.L. to be , , and for , , and , respectively. Mass limits based on the lower edge of the cross section prediction as well as the expected bounds are listed in Table 5. Figure 4 shows the excluded region in the versus parameter space together with the exclusion limits obtained for the and selections separately. The bound at , where this analysis has no sensitivity, is given by the D0 search in the acoplanar jet topology d0lqaco2 . It is interesting to notice the improvement due to the inclusion of the decay mode in the single muon analysis. Therefore, this selection has its maximum sensitivity around instead of and a sizable contribution at , where the branching fraction for the decay mode vanishes.
| Central theory | Lower edge theory | |||
| (GeV) | (GeV) | (GeV) | (GeV) | |
| 185 | 181 | 174 | 175 | |
| 270 | 272 | 259 | 263 | |
| 316 | 316 | 306 | 308 | |
In summary, a search for second generation scalar leptoquarks produced in collisions at has been performed using an integrated luminosity of . Two selections based on the and final states have been carried out. The leptoquark signal was discriminated from background using a multivariate technique based on the kNN algorithm. Both analyses were combined to obtain lower limits on the scalar leptoquark mass as a function of which exceed at large . These results improve on previous leptoquark searches at the Tevatron d0lq2 ; cdflq2 . They exceed the corresponding previous bounds by at both and , and give the most constraining direct limits on second generation leptoquarks to date.
We thank the staffs at Fermilab and collaborating institutions, and acknowledge support from the DOE and NSF (USA); CEA and CNRS/IN2P3 (France); FASI, Rosatom and RFBR (Russia); CNPq, FAPERJ, FAPESP and FUNDUNESP (Brazil); DAE and DST (India); Colciencias (Colombia); CONACyT (Mexico); KRF and KOSEF (Korea); CONICET and UBACyT (Argentina); FOM (The Netherlands); STFC (United Kingdom); MSMT and GACR (Czech Republic); CRC Program, CFI, NSERC and WestGrid Project (Canada); BMBF and DFG (Germany); SFI (Ireland); The Swedish Research Council (Sweden); CAS and CNSF (China); and the Alexander von Humboldt Foundation (Germany).
References
- (1) Visitor from Augustana College, Sioux Falls, SD, USA.
- (2) Visitor from The University of Liverpool, Liverpool, UK.
- (3) Visitor from ECFM, Universidad Autonoma de Sinaloa, Culiacán, Mexico.
- (4) Visitor from II. Physikalisches Institut, Georg-August-University, Göttingen, Germany.
- (5) Visitor from Helsinki Institute of Physics, Helsinki, Finland.
- (6) Visitor from Universität Bern, Bern, Switzerland.
- (7) Visitor from Universität Zürich, Zürich, Switzerland.
- (8) Deceased.
- (9) J. C. Pati, A. Salam, Phys. Rev. D 10, 275 (1974); H. Georgi, S. L. Glashow, Phys. Rev. Lett. 32, 438 (1974); W. Buchmüller, D. Wyler, Phys. Lett. B 177, 377 (1986).
- (10) V. M. Abazov, et al., D0 Collaboration, Phys. Lett. B 636, 183 (2006).
- (11) A. Abulencia, et al., CDF Collaboration, Phys. Rev. D 73, 051102 (2006).
- (12) V. M. Abazov, et al., D0 Collaboration, arXiv:0808.0446 [hep-ex] (2008), submitted to Phys. Lett. B.
- (13) V. M. Abazov, et al., D0 Collaboration, Nucl. Instrum. Methods Phys. Res. A 565, 463 (2006).
- (14) S. Abachi, et al., D0 Collaboration, Nucl. Instrum. Methods Phys. Res. A 338, 185 (1994).
- (15) V. M. Abazov, et al., Nucl. Instrum. Methods Phys. Res. A 552, 372 (2005).
- (16) P. Calfayan, Ph.D. thesis, University of Munich, Fermilab-Thesis-2008-28 (2008).
- (17) G. C. Blazey, et al., in Proceedings of the Workshop: QCD and Weak Boson Physics in Run II, edited by U. Baur, R. K. Ellis, D. Zeppenfeld, Fermilab-Pub-00/297 (2000).
- (18) V. M. Abazov, et al., D0 Collaboration, Phys. Rev. Lett. 101, 062001 (2008).
- (19) M. L. Mangano, et al., JHEP 0307, 001 (2003); versions 2.05 and 2.06 were used.
- (20) T. Sjöstrand, et al., Comput. Phys. Commun. 135, 238 (2001); version 6.323 was used.
- (21) J. Alwall, et al., Eur. Phys. J. C 53, 473 (2008).
- (22) J. Pumplin, et al., JHEP 0207 012 (2002) and D. Stump, et al., JHEP 0310 046 (2003).
- (23) R. Brun, F. Carminati, CERN Program Library Long Writeup W5013, 1993 (unpublished).
- (24) A. Höcker, et al., TMVA: Toolkit for multivariate data analysis, arXiv:physics/0703039 (2007); version 3.8.14 was used.
- (25) T. Andeen, et al., FERMILAB-TM-2365 (2007).
- (26) T. Junk, Nucl. Instrum. Methods Phys. Res. A 434, 435 (1999).
- (27) M. Krämer, T. Plehn, M. Spira, P. M. Zerwas, Phys. Rev. Lett. 79, 341 (1997).