Trace Element Analysis of Potassium by
Resonance Ionization Mass Spectrometry
Abstract
A simple resonance ionization mass spectrometer is built with a Quadrupole Mass Spectrometer (QMS) and two laser diodes aiming at trace analysis of potassium. The overall detection efficiency is estimated comparing the yields of resonance ionization and electron-impact ionization in the same QMS. A clear discrimination of , and is demonstrated with a help of isotope shifts of the atomic levels.
1 Introduction
Recently, the evaluation technology of the trace substances has become important in many areas such as environmental science, biochemistry and semiconductor industry. As one of the effective methods for the trace element analysis, Resonance Ionization Mass Spectrometry (RIMS) is currently studied mainly with calcium (Ca) or strontium (Sr) atoms for isotope analysis.[1, 2] RIMS consists of two parts which are photoionization of a particular element by a tuned laser, and isotope discrimination by a conventional mass spectrometer like a Quadrupole Mass Spectrometer (QMS) or a Time-Of-Flight Mass Spectrometer (TOF-MS). The first part is resonance excitation of specific atoms with a monochromatic laser followed by ionization with the same or another laser. It is free from isobaric interference often seen in other methods such as Inductively-Coupled Plasma Mass Spectrometry (ICP-MS). Additional isotopic selectivity can also be achieved with a CW laser diode because of its narrower linewidth than the slight isotope shifts of the resonance excitation wavelength.
In this paper, we report on a demonstration of the trace element analysis of potassium gas atoms performed by a simple resonance ionization mass spectrometer built with two laser diodes and a Quadrupole Mass Spectrometer (QMS). The laser diode is used for the resonance excitation because the wavelength is tunable, although the variable range is narrow, and less expensive than other kinds of wavelength-variable lasers like a dye laser. The potassium atom beam was prepared by decomposition of in an electrothermally-heated graphite crucible.
Difference of the resonance excitation wavelength between and was observed together with the mass peak of the naturally-occurring radioactive isotope by fine-tuning the laser wavelength for resonance excitation.
The advantage of RIMS over the conventional contamination assessment on the surface of semiconductor wafers by ICP-MS is described in terms of insensitivity to isobaric interferences and lower noise level of the channeltron detector.
2 Experimental Setup
2.1 RIMS scheme
As mentioned above, RIMS method is the combination of the resonance ionization by lasers and the mass analysis. Fig. 1 shows the resonance ionization scheme of potassium employed in the present study. Two laser diodes were used for the single-resonance ionization of potassium gas atoms.
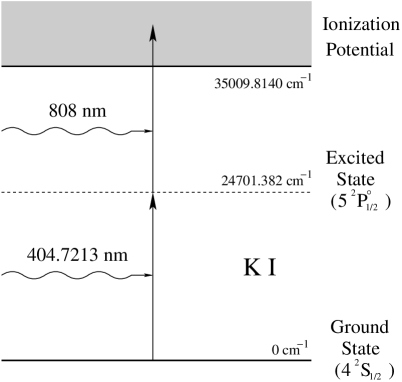
The first laser is a wavelength-tunable External Cavity Diode Laser (ECDL, Sacher Lasertechnik model SYS-100-405-20) operating in the wavelength range of =402.7405.2 nm. A single-mode m core diameter fiber is coupled to this laser system with an FC/APC connector. The wavelength was fine-tuned to nm for the resonance excitation in air,[3] via the piezo actuator attached on the diffraction grating in the laser head. The piezo voltage can be controlled manually from the control panel knob in the range of V, with a frequency sensitivity of GHz/V (0.0011 nm/V). Higher piezo voltage means lower laser wavelength, or higher laser frequency. The maximum laser output was more than mW, corresponding to the single-mode fiber output of more than mW. This laser has not been frequency-locked yet in this work, so the wavelength drift occurred in the time span of a few minutes or longer.
The second laser is an Amonics model ALD-808-3000-B-FC laser diode for photoionization with a fixed wavelength of nm. A multi-mode m core diameter fiber is coupled to this laser system with an FC/PC connector. The maximum output was more than W, corresponding to the multi-mode fiber output of more than W.
We used a Pfeiffer Vacuum model QMS200 quadrupole mass spectrometer for the mass analysis of potassium ions produced by the resonance ionization. It is equipped with a channeltron to detect ions as an amplified ion current.
2.2 Sample preparation
In this work, potassium gas atoms were obtained from the decomposition of in the electrothermally-heated graphite crucible. In each trial, of 50% water solution of was loaded into the crucible. After drying the sample, the crucible containing the net weight of mg , corresponding to potassium atoms, was set in the heating device (Epiquest model THKC-200-SB).
As the crucible temperature increases electrothermally, the decomposition is assumed to occur as follows:[4]
| (1) |
The potassium atoms are obtained from the decomposition of under the higher crucible temperature:
| (2) |
The number of the obtained potassium gas atoms per unit time is
| (3) |
where and represent the crucible conductance, the partial pressure of K(g), Boltzmann constant, and the temperature inside the crucible, respectively. Assuming a molecular flow regime,
| (4) |
where and are the crucible radius and length, and is the average velocity of the potassium gas atoms. In the present experiments, [/s] at . Combined with [atm] at this temperature, [4] [1/s] is expected. The potassium atoms were introduced into the QMS as an atom beam through an orifice of mm.
2.3 Schematic view of the experimental setup
A schematic view of the experimental apparatus is shown in Fig. 2. The potassium gas atoms from the crucible are resonantly-ionized mainly in the overlap region of two laser beams irradiated perpendicularly to the direction of the potassium atom beam.
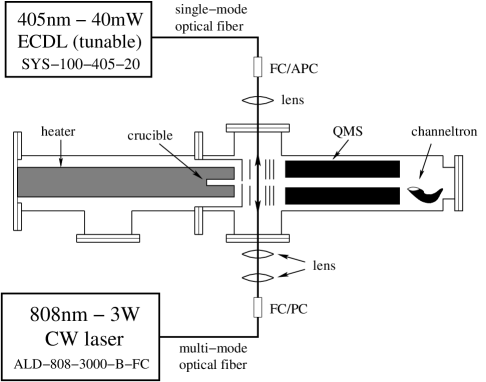
The fiber output of each laser diode is focused to the ionization region in vacuum with Melles Griot model optical lenses. The lens for the 405nm laser is a 01LUD009 Symmetric-Convex Precision Fused-Silica Singlet Lens with a focal length of 30.0mm. Two lenses for the 808nm laser are a 06GLC006 Collimating lens with a focal length of 50.1mm and a 06LAI011 Diode Laser Glass Doublets with a focal length of 100.0mm. These two lenses are corrected for spherical aberration in advance, so the focal spot of the 808nm laser is mainly determined geometrically to be a diameter of about m by the position of the lenses and the core diameter of the multi-mode fiber. The 405nm laser spot is set to a diameter of about m so that the overlap region of two laser beams can be easily found. To avoid any damage caused by the opposite laser beam coming through the fiber, two laser beams are irradiated at an angle of 166.7∘ to each other.
The laser power at the ionization region is reduced to about mW for 405nm laser and W for 808nm laser, because of the transmission loss of the lenses and the viewport windows. Each optical fiber output is fixed to the viewport of the QMS to avoid misalignment of the laser spot due to vibration of the vacuum system. Ions are extracted, mass analyzed by the QMS, and finally detected by the off-axis channeltron detector as shown in Fig. 2.
In the ionization region is placed a filament made of yttrium oxide coated iridium, which was switched on for Electron-Impact (EI) ionization of the potassium atoms. EI runs were performed as a reference for the estimatation of RIMS overall detection efficiency (see Section 3.2 for details). It should be noted that any atoms or molecules can be ionized by EI, leading to the increase of the background noise of the channeltron current. The emission current of the thermal electron was set to 0.1mA in this work.
The crucible temperature was measured with a thermocouple on the outer bottom of the crucible. Based on the test data, the thermocouple temperature indication was K higher than the real temperature inside the crucible in K region.
3 Results and Discussion
3.1 Resonance ionization signal
Resonance ionization signal is observed by fine-tuning the piezo voltage to the resonance excitation wavelength. Fig. 3 shows an example of the observed resonance ionization signal of by scanning the piezo voltage manually from 93.5 V to 96.0 V. It should be noted that the laser wavelength changes with as well as with the laser current or temperature, so only the difference of the piezo voltage has meaning, but the value itself has no meaning.
The observed two peaks are consistent with the hyperfine splitting (HFS) of ground state. See Section 3.3.2 for the detailed explanation.

3.2 Overall detection efficiency
The overall detection efficiency is defined as the ratio of the number of potassium atoms detected by the QMS to that initially loaded in the crucible. could be experimentally determined by the time integration of the channeltron current until the sample in the crucible is evaporated away. Since we have not yet used the frequency-locking system for the laser of the resonance excitation, it is difficult to keep for a long time the laser frequency on-resonance with the transition to the excited state shown previously in Fig. 1. On the other hand, it is rather easy to estimate the overall detection efficiency of EI ionization experimentally by integrating the channeltron current of EI ionized potassium. Therefore, RIMS overall detection efficiency in this work can be determined by the short time measurement of the ratio of the detection efficiency by RIMS to EI: .
To estimate the detection efficiency , the sum of the channeltron current of and has been measured from the beginning of the crucible heating ( s) until the sample was lost ( s). It took about an hour to increase the crucible heating current from 0 A ( s) to 7.50 A, corresponding to the crucible inner temperature of K to K. After reaching the target termperature, the heating current was maintained at 7.50 A until the end of the measurement. Background channeltron current has been estimated as the average of the channeltron current without crucible heating ( 0 – 92 s). Integration of the net channeltron current over the time span of 92 – 25900 s yielded [C], correponding to potassium atoms, which was of the initially loaded ones.
Fig. 4-(b) shows an experimental result of the channeltron current of atomic ions by RIMS and EI. The channeltron voltage in this figure was lower than that used in the measurement of Fig. 4-(a). Therefore, the ion currents of Fig. 4-(a) and Fig. 4-(b) cannot be directly compared.
The crucible heating current was set to 7.50A in advance. Throughout the measurement, the emission current of the thermal electron for EI ionization has been kept to 0.1mA, in other words, the channeltron current contributed by EI ionization remained constant. In addition, two lasers were irradiated in 4 ways: (I) both were ON; (II) both were OFF; (III) 405nm laser was ON and 808 OFF; (IV) 405 OFF and 808nm laser was ON. Little difference was observed between the current of (II) and (IV), meaning that resonance ionization occurs only under the existence of the wavelength fine-tuned laser for resonance excitation. The ratio of the detection efficiency by RIMS to EI can be obtained as the ratio of the measured channeltron current of (I) subtracted by (II) to (II), which was . Combined with obtained above, RIMS overall detection efficiency has been estimated to be .
The improvement ratio of RIMS detection efficiency with the 808nm laser over without it is estimated to be about a factor of by comparing the net ion current of (I) to (III) with the effect of EI ionization (II) subtracted. This means that the resonance ionization occurs only with the 405nm laser, but the ionization is highly effective with the 808nm laser.
The resonance ionization probability of potassium atoms can be estimated by solving the rate equations.[5] We calculated it for the mm atom beam, estimated from the crucible and the orifice geometry, passing through the spherical laser spots on the assumption of each laser power and diameter described in Section 2.3 and the doppler width of the K potassium atoms. The result was with both lasers ON and with only the 405nm laser ON. The expected improvement ratio of about 60 is a little underestimated probably because of the transport efficiency through the QMS tube. The transport efficiency is supposed to decrease with distance from the axis of the QMS tube, so the actual improvement ratio is thought to be higher due to the larger spot size of the 405nm laser than that of the 808nm laser. With these ambiguities, the estimation well reproduces the measured ratio.


3.3 Isotope discrimination
Isotope discrimination study of potassium has been performed by both EI ionization (Section 3.3.1) and RIMS (Section 3.3.2 – 3.3.4). Here, the channeltron voltage was same as in Fig. 4-(a), but the crucible heating current was kept a little lower to 6.00 A, corresponding to the crucible inner temperature of K. The mass resolution of the QMS was set higher at the expense of less sensitivity to reduce the influence of the tail of the adjacent mass peak. During the measurements described in Section 3.3.2 – 3.3.4, the filament for EI ionization was OFF. The natural isotope ratio of potassium is known to be .[6]
3.3.1 Mass spectrum of potassium by EI ionization
In the electron-impact ionization, isotope discrimination is performed only by the mass analysis with the QMS. Fig. 5 shows an observed mass spectrum around the potassium mass region. Though the mass peak could hardly be found because of the small abundance, the isotope ratio of is obtained from the each peak current. The deviation from the natural isotope ratio might be due to the fluctuation of the channeltron current.
The observed peak at is the contribution of produced by the decomposition of as shown in Eq. (1). No atoms nor molecules except for potassium are ionized by the resonance ionization, so this peak is not observed in RIMS (See Fig. 8 or Fig. 9).

3.3.2 Hyperfine splitting of potassium
Hyperfine splitting is a splitting of each electron state into multiple energy levels caused by the interaction of the electron spin induced magnetic dipole moment with the magnetic moment of the atomic nucleus. In atoms, hyperfine splitting of the ground state makes two energy levels ( MHz) and (173.1 MHz) as shown in Fig. 6, resulting in two observed resonance ionization peaks. Here, is the total angular momentum quantum number including nuclear spin. Hyperfine splitting of the excited state is relatively ignorable.[7]

 |
Fig. 7 shows an experimental result of the resonance ionization signal of , and . In this figure, the higher peak of at the lower , or the lower laser frequency, corresponds to the level of the ground state of , and the lower peak to (See also Fig. 3). The peak current ratio of these two peaks reflects a statistical weight of , which is . The same is considered to be true for except for the detailed energy levels of the and level of the 4s ground state. The two peaks of are less clearly observed than those of , because the potassium doppler width of about 100MHz is not negligible compared to the narrower hyperfine splitting width of . The two peaks of correspond to the level at the lower and level at the higher . The peak current ratio of the two peaks of is expected to be .
3.3.3 Isotope shift of with respect to
The isotope shift is a slight difference of the transition frequency (wavelength) between the specific pair of the atomic states of two isotopes of the same element. The isotope shift of the 404.7 nm resonance excitation line of with respect to this line of can be estimated by the observed difference of the piezo voltage at the peak of the measured channeltron current. Scanning by hand from 93.5 V to 96.0 V, we found the peak current at 94.56 V and at 94.78 V. Both peaks correspond to the resonance excitation line from the level of the 4s ground state of each isotope. Fig. 8 shows a mass spectrum under each piezo voltage .
The observed difference of the piezo voltage was V, corresponding to the frequency of MHz or the wavelength of nm. The error is dominated by the reading error of at the resonant peak and might be improved with a computer control system of it. Taking into account the difference of the splitting width of and 4s ground state as shown in Fig. 6, the isotope shift is calculated to be MHz. Our result is lower than the precise measurement of this isotope shift using saturation spectroscopy by L. J. S. Halloran et al., [8] probably because of the unknown accuracy of the linearity between and the laser frequency, in other words, the accuracy of 2 GHz/V as described in Section 2.1.
This linearity can be estimated by the known hyperfine splitting width of ground state as seen in Fig. 7. The known splitting width of 462 MHz corresponds to the piezo voltage of V, so the linearity is obtained to be GHz/V. With this value, the isotope shift is recalculated to be MHz, which is consistent with the data by L. J. S. Halloran et al.[8]
As mentioned above, isotopic selectivity can be achieved with a CW laser diode in addition to the mass discrimination by QMS. According to Pulhani et al.,[9] the optical isotopic selectivity for the specific isotope A to the interfering one B is defined as
| (5) |
where is the intensity of isotope A at its transition frequency , is its abundance in the sample, is the intensity of isotope B at the transition frequency of isotope A, and is its abundance. Here, the intensity of each isotope can be replaced by the measured peak channeltron current, so the observed optical isotopic selectivity to is a factor of 5. optical isotopic selectivity to could hardly be estimated because resonance ionization line from the level of the ground state is close to this line (See Fig. 3). It is necessary to reduce the effect of the doppler width for the improvement of the optical isotopic selectivity.
The isotope ratio of is estimated from the peak current of at V and at V in Fig. 8, which is close to the natural isotope ratio and the result of EI ionization described in 3.3.1.

3.3.4 Mass spectral peak of
is the naturally-occurring radioactive potassium isotope which has an abundance of 0.0117%.[6] In this work, the mass peak of has also been observed as shown in Fig. 9 with a setting of better mass resolution (leading to a little lower sensitivity) for the QMS as well as fine-tuned piezo voltage to about 95 V. This peak is thought to be the resonace excitation signal from the lower level of the 4s ground state because of the higher piezo voltage, in other words, higher frequency of the observed line than or (See Fig. 6).
Comparing the peak current at and 40, optical isotopic selectivity to is estimated to be about 7. Taking into account the fact that the isotopic selectivity increases with additional resonance excitation processes, higher selectivity could be achieved by resonance ionization through multiple excited states.
 |
4 Future Prospect
Our resonance ionization mass spectrometer is quite effective for the trace element analysis because of its low noise level of the channeltron detector as well as insensitivity to isobaric interferences. Especially, it can be applicable to the contamination assessment on the surface of the semiconductor wafer.
ICP-MS is mainly used in this field conventionally, however it suffers from argon plasma interferences with mass region around 40, resulting in relatively worse detection limits of potassium () and calcium () than other elements.
The detection efficiency of the present system is limited by the power of 808nm ionizing laser. Therefore, we are planning to increase the 808nm laser power by a factor of 20 using an Apollo Instruments model FL-60. We expect a detection limit of potassium (K) of comparable to or even better than that of ICP-MS with our improved system.
The laser diode is a good device to use for the resonance excitation because of its narrow linewidth and relatively low price. However, it is not applicable to the analysis of other chemical elements for the limited variable wavelength range. For the contamination assessment of a variety of impurities on the wafers, a variable wavelength dye laser can be used at a higher cost.
5 Conclusion
Trace element analysis of potassium gas atoms has been performed by our own resonance ionization mass spectrometer consisting of two laser diodes for resonance ionization and QMS for mass analysis. The overall detection efficiency is currently estimated to be .
Isotope discrimination test has also been performed with a high resolution QMS setting to verify the isotope shift and the optical isotopic selectivity. The isotope shift between and in the 404.7nm resonance excitation line is estimated to be MHz compared to the known hyperfine splitting width of ground state. The obtained optical isotopic selectivities of to and to are about 5 and 7, respectively. A clear hyperfine splitting of the ground level was observed in each potassium isotope.
We are planning to apply RIMS to the contamination assessment on the surface of the semiconductor wafer. The detection limit of potassium impurities can be improved to be comparable to or even better than that of a conventional method of ICP-MS by increasing the 808nm laser power by a factor of 20. Also, a wavelength-tunable dye laser to cover the wide range of resonance excitation wavelength enables us to perform contamination assessment of a wide variety of impurities in addition to potassium.
Acknowledgment
This research is supported by Grant-in-Aid for Exploratory Research, the Japan Society for Promotion of Science, by the Research Center for the Early Universe, School of Science, University of Tokyo, and also by the Global COE Program ”the Physical Sciences Frontier”, MEXT, Japan.
References
- [1] B. A. Bushaw, W. Nrtershuser, P. Mller, and K. Wendt: J. Radioanal. Nucl. Chem.Phys. 247 (2001) 351.
- [2] K. Watanabe, Y. Higuchi, J. Kawarabayashi, and T. Iguchi: J. Nucl. Sci. Technol. 43 (2006) 325.
- [3] E. B. Saloman: Spectrochim. Acta B 48 (1993) 1139.
- [4] L. L. Simmons, L. F. Lowden, and T. C. Ehlert: J. Phys. Chem. 81 (1977) 706.
- [5] Wolfgang Demtrder: Laser Spectroscopy: Basic Concepts and Instrumentation (Springer, Berlin, 1996) 2nd enl. ed., Chap. 5.
- [6] NIST homepage: http://physics.nist.gov/.
- [7] E. Arimondo, M. Inguscio, and P. Violino: Rev. Mod. Phys. 49 (1977) 31.
- [8] L. J. S. Halloran, S. Fostner, E. Paradis, and J. A. Behr: submitted to Opt. Commun.
- [9] A. K. Pulhani, G. P. Gupta, and B. M. Suri: J. Phys. B 35 (2002) 3677.