Correlations of Prompt and Afterglow Emission in Swift Long and Short Gamma Ray Bursts
Abstract
Correlation studies of prompt and afterglow emissions from gamma-ray bursts (GRBs) between different spectral bands has been difficult to do in the past because few bursts had comprehensive and intercomparable afterglow measurements. In this paper111to appear in The Astrophysical Journal, Dec 20, 2008, v. 689, no. 2 we present a large and uniform data set for correlation analysis based on bursts detected by the Swift mission. For the first time, short and long bursts can be analyzed and compared. It is found for both classes that the optical, X-ray and gamma-ray emissions are linearly correlated, but with a large spread about the correlation line; stronger bursts tend to have brighter afterglows, and bursts with brighter X-ray afterglow tend to have brighter optical afterglow. Short bursts are, on average, weaker in both prompt and afterglow emissions. No short bursts are seen with extremely low optical to X-ray ratio as occurs for “dark” long bursts. Although statistics are still poor for short bursts, there is no evidence yet for a subgroup of short bursts with high extinction as there is for long bursts. Long bursts are detected in the dark category at the same fraction as for pre-Swift bursts. Interesting cases are discovered of long bursts that are detected in the optical, and yet have low enough optical to X-ray ratio to be classified as dark. For the prompt emission, short and long bursts have different average tracks on flux vs fluence plots. In Swift, GRB detections tend to be fluence limited for short bursts and flux limited for long events.
Subject headings:
gamma rays: bursts1. Introduction
One of the longest enduring Gamma Ray Burst (GRB) classification schemes is based on their distributions in duration and spectral hardness. Both quantities seem to cluster into two separate classes with the longer events (those above s; Kouveliotou et al. 1993) being predominantly softer while the shorter ones are harder. The mechanism for the origin of the GRB explosions (the central engine) appears to be quite different for the two types. Long bursts are ascribed to the core collapse to a black hole of a massive, young, rapidly rotating star in the “collapsar” model (Woosley 1993; MacFadyen & Woosley 1999; Woosley & Bloom 2006) which is supported by observations such as the coincidence of SNe with well-observed nearby GRBs (Galama et al. 1998; Bloom et al. 1999; Staneck et al. 2003; Hjorth et al. 2003; Pian et al. 2006). The prevalent model for short bursts has them caused by the coalescence of a binary pair of compact old stars (Lattimer & Schramm 1974; Paczyński 1986; Eichler et al. 1989; Mochkovitch et al. 1993; Rosswog, Ramirez-Ruiz, & Davies 2003; Oechslin, Janka, & Marek 2007) which is supported by recent observations of progenitor sites with low star formation activity (Gehrels et al. 2005; Bloom et al. 2006; Fox et al. 2005; Villasenor et al. 2005, Hjorth et al. 2005; Barthelmy et al. 2005b; Berger et al. 2005). In both scenarios, a highly-relativistic collimated outflow of particles and radiation occurs producing prompt gamma-ray emission from shock accelerated electrons, which evolves into a long-lasting afterglow from shock interactions with the circumburst medium (e.g., Mészáros & Rees 1997). For short bursts there are also models for the afterglow in which a radioactive wind causes emission in the first day or so (Li & Paczyński 1998, Kulkarni 2005).
Correlation studies of prompt and afterglow emission are crucial for understanding their production mechanisms and environmental effects. For example, Jakobsson et al. (2004) developed a criterion for determining which GRBs are “dark” bursts, by comparing the relative intensity of their X-ray and optical afterglows to find what fraction of bursts have high column densities. Stratta et al. (2004) studied the X-ray and optical absorption properties of 13 GRBs studied by BeppoSax. Roming et al. (2006) and Fynbo et al. (2007) expanded on previous work to include (long) bursts from the Swift satellite. A more detailed work on dark bursts using a broad-band spectral analysis is given by Rol et al. (2005, 2007). Zhang et al. (2007) present a study comparing radiative efficiencies for short and long bursts as derived from a correlation analysis. Using Swift short bursts, Berger (2007) compared their X-ray afterglow to their gamma-ray prompt emission, and found that 20% have anomalously low X-ray to gamma ray ratios indicating very low density burst sites, possibly in globular clusters, for that subpopulation (see also Berger et al 2007). Other correlation studies have been undertaken by Salmonson & Galama (2002), Firmani et al. (2006), Nava et al. (2006), Butler (2007), and Nysewander, Fruchter, & Pe’er (2008). An early study of X-ray afterglow properties at hr was carried out by Piran et al. (2001).
In this study we perform correlation studies using the extensive data set from Swift. Sections 2 and 3 cover observations and results, respectively, while in Section 4, we discuss the implications of the results and in Section 5 the conclusions and future prospects.
2. Observations
2.1. Swift Studies
The Swift mission (Gehrels et al. 2004) has so far provided uniform observations of prompt and afterglow emission for hundreds of GRBs. This sample is an order of magnitude larger than the one previously available with e.g., the BeppoSAX satellite (de Pasquale et al. 2006).222see also website by J. Greiner: http://www.mpe.mpg.de/jcg/grbgen.html Further, Swift X-ray observations covering time-scales from 1 minute to several days after the burst are provided for the first time for most every GRBs. After three years of operations, our data set has now reached a critical size where statistically meaningful correlations can be studied.
We present here three correlation studies: (1) X-ray vs optical afterglow, (2) gamma-ray prompt vs X-ray afterglow, and (3) prompt gamma-ray peak flux vs fluence. All the data used in this study are listed in Tables except that gamma-ray data are listed only for those bursts with, at least, an X-ray afterglow. The full list of fluences and fluxes for the 193 bursts used for study (3) are directly from the Sakamoto et al. (2008) tables. We include all Swift bursts from January 2005 through July 2007 for studies (1) and (2) and through February 2007 for study (3). We adopt s for the dividing line between long and short GRBs, except for ones with soft extended emission. In those cases the duration of the initial hard pulse was required to be s, and only that emission was used in the analysis (GRB 050724, 051227, 061006, 061210, and 070714B). Including the extended emission in the fluence would increase it by a factor and would not significantly change the correlations.
For the X-ray vs optical afterglow study, we use the methods developed by Jakobsson et al. (2004) in their comparison of X-ray and optical afterglow fluxes for pre-Swift bursts. In order to compare to the Jakobsson et al. results, we use the same definition of quantities: the X-ray flux density at 3 keV, the optical flux in the band, and sampling time at 11 hr after the burst. The Swift X-ray lightcurves have been found typically to have complex shapes (Nousek et al. 2005; Zhang et al. 2005) often including a poorly understood “plateau phase”; the use of flux at 11 hr in most cases avoids sampling during the plateau phase and gives a measure of the true burst afterglow.
2.2. X-ray Fluxes
The X-ray fluxes are from measurements of the Swift X-Ray Telescope (XRT; Burrows et al. 2005). Our primary data product for the XRT flux is the integral flux between 0.3 and 10 keV corrected for absorption at low energies (unabsorbed flux). This is converted to the flux density at 3 keV using the measured spectral index. Given an integral keV X-ray flux erg cm-2 s-1 and a keV X-ray photon index , the flux density at 3 keV, in Jy, is given by
| (1) |
where keV, keV, and keV. The integral fluxes, photon spectral indices and flux densities are listed in Tables . A 10% systematic uncertainty was added in quadrature to the measured error to account for uncertainties in the shape and variability of the lightcurves.
The integral flux calculation was carried out as follows (see J. Racusin et al. 2008, in preparation, for a more detailed discussion of the method). Level 1 data products were downloaded from the NASA/GSFC Swift Data Center (SDC) and processed using XRTDAS software (v2.0.1). The xrtpipeline task was used to generate level 2 cleaned event files. Only events with Windowed Timing (WT) mode grades and Photon Counting (PC) mode grades and energies between keV were used in subsequent temporal and spectral analysis.
The XRT light curves were created by extracting the counts in a circular region around the GRB afterglow with a variable source radius designed to optimize the depending on the count rate. They were background subtracted, pile-up corrected where applicable, exposure map corrected, and corrected for the fraction of the PSF excluded by the extraction region. The number of counts per bin is variable and dependent on the count rate. Time intervals of significant flaring were removed from the light curves and they were fit to power-laws, broken power-laws, and multiply broken power-law. Using these temporal fits, we interpolated the count rate at 11 hr.
Spectra for the power-law segments of the light curves were extracted individually to limit contamination by potential spectral variability. The segment used for the counts to flux conversion was that at 11 hr. The spectra were created by extracting the counts in a 20 pixel radius extraction region and a 40 pixel radius background region. The Ancillary Response Files were made using the xrtmkarf task and grouped with 20 counts per bin using the grppha task. The spectra were fit in XSPEC to absorbed power-laws and used to measure the keV flux and count rate which was applied to the interpolated count rate to convert into flux units.
2.3. Optical and Gamma Ray Fluxes
The optical fluxes are from measurements by ground-based telescopes and from the Swift UV Optical Telescope (UVOT; Roming et al. 2005). An extensive literature search was done to find the best optical data for each burst. Bursts were included in the study if measurements were available within a factor of 2 of 11 hr (i.e., at hr or hr). The value at 11 hr was estimated by interpolations and extrapolations when measurements were not available exactly at 11 hr. The correction applied to the data for 11 hr was . The one exception to the factor of 2 criterion was GRB 070508 with measurements to only 4 hr, which was included because it appears to be an interesting dark burst candidate. A few bursts are listed with optical flux upper limits at the bottom of Table 2. This is not an exhaustive list of optical limits, but only those with low optical to X-ray ratio limits. A 10% systematic uncertainty was added in quadrature to the measured error to account for uncertainties in the shape and variability of the lightcurves.
Galactic extinction was taken into account using the study of Schlegel, Finkbeiner, & Davis (1998).333http://nedwww.ipac.caltech.edu/forms/calculator.html For the precise sky map positions we utilize the XRT localizations. For each data source reference, a determination had to be made as to whether the galactic correction had already been made. (For the GCN entries, it was always assumed the correction had not been made.) For most of the GRBs, the band correction is small (a few tenths of a magnitude). The exceptions from Table 1 are 050724 () and 061006 (); the exceptions from Table 2 are 050713B () and 070704 (). Corrections this large are highly uncertain due to the patchiness in extinction in the Galactic plane.
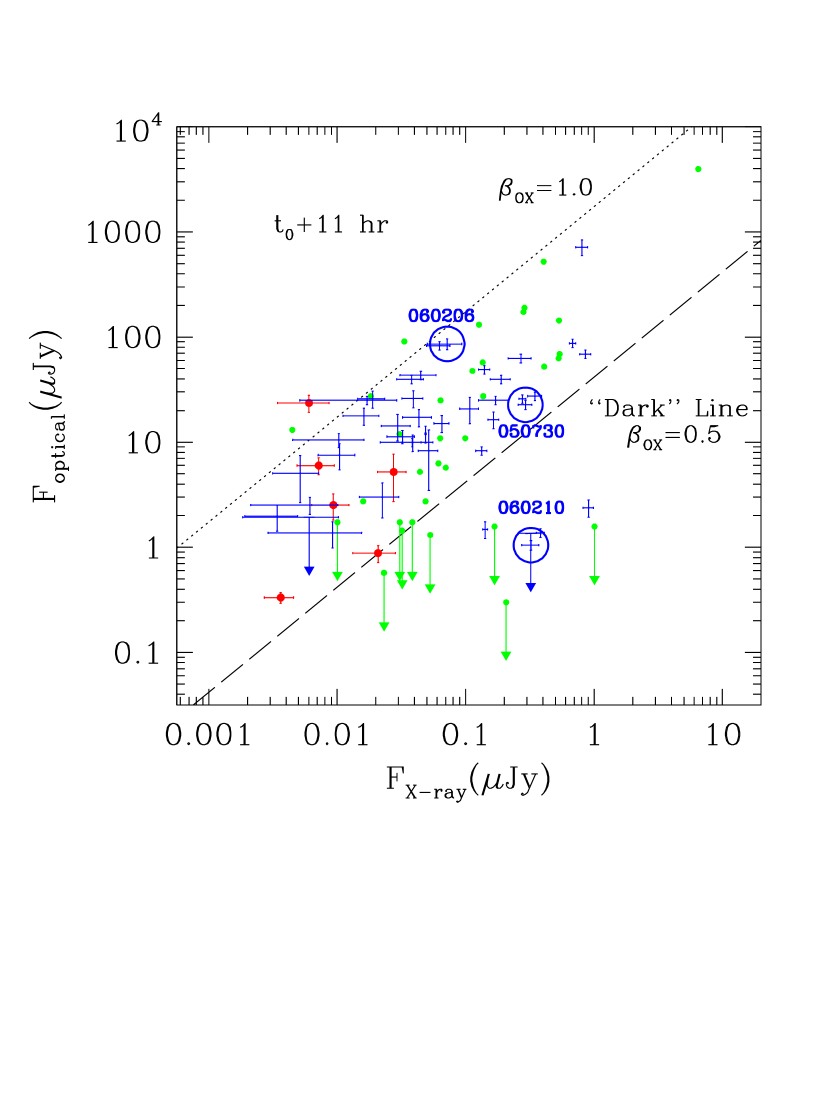
Our sample contains three GRBs with redshift values large enough () so that Lyman blanketing may affect the band fluxes. For these bursts 050730, ; 060206, ; and 060210, the expected redshifting of the Lyman series . For Ly, and for Ly, . Thus the effect of the redshifted absorption is to impact the blue edge of the band filter . The band fluxes for the three highest bursts (indicated by circles in Fig. 1) scatter about the mean band flux line, however, rather than being concentrated at low values as would have been expected had blanketing been an issue. Although for the Ly feature will be shifted redward of the (skew-symmetric) peak of the filter, the centroid and FWHM of the filter still predict the bulk of the filter response to lie redward of most of the Lyman series, which would be most dominant for at (e.g., for the Cousins [Bessell 90] filter, and Fukugita, Shimasaku, & Ichikawa 1995, see their Table 9). The absorptive effect would likely warrant a corrective multiplicative factor , which is small given the decade spread in for Figure 1. Therefore we do not attempt to correct for redshifted Lyman absorption for these three high-z bursts.
The gamma-ray fluences and peak fluxes are in the keV band and are from the Swift Burst Alert Telescope (BAT; Barthelmy et al. 2005a) as compiled in the BAT GRB catalog (Sakamoto et al. 2008). For the gamma-ray flux needed in study (3), we use 1 s binning as quoted by Sakamoto et al. (2008).
2.4. Correlation Analysis
For each study, we have performed fits to the two-parameter correlation data using the Spearman rank test (Spearman 1904; Press et al. 1986) and derived the correlation coefficient, , to determine the degree and significance of the correlation. Upper limits were not included in the fits. In the Spearman rank test, the probability of a null correlation, , is given by
| (2) |
where is the number of data points. The significance of the correlation is . The fraction of the observed spread of the data that can be explained by the correlation is given by . The fit parameters and correlation values are listed in Table 4. Equation (2) only applies in the limit of large (). For , the concept of applying a significance criterion to a correlation study begins to lose its meaning.444This can be seen in the limit where one considers two data points and . In this example , so the statement “” carries no information and has no significance. Therefore, although for completeness we list and values for cases with small , we stress that they are only indicative of trends in those cases.
3. Results
3.1. X-ray and Optical Afterglow Correlations
Figure 1 shows the Swift X-ray afterglow average flux density at 3 keV as a function of the band optical flux density, both converted to Jy at 11 hr after the burst, for short and long bursts. The pre-Swift data points are taken from Jakobsson et al. (2004) and are shown as filled green points. Also shown is the solid line of constant X-ray to optical spectral index that they propose separates the true “dark” bursts from the rest. As listed in Table 4, the Spearman rank test for the two GRB populations in Figure 1 gives a null probability of or a 99% correlation probability between the optical and X-ray flux densities of the long GRBs, and only % for the short population.
The long Swift GRBs fall in the same general region of the plot as the pre-Swift ones. As with the pre-Swift bursts, several Swift long bursts (detections and upper limits) also fall below the Jakobsson et al. dark line. The brightest short GRBs fall in the midst of the long GRB points, but in the region toward lower flux densities. To date there are no short bursts that fall below the dark burst line; those with low optical flux densities or upper limits tend to also have weak X-ray flux densities that place them above the line.
3.2. Gamma Ray Prompt and X-ray Afterglow Correlations
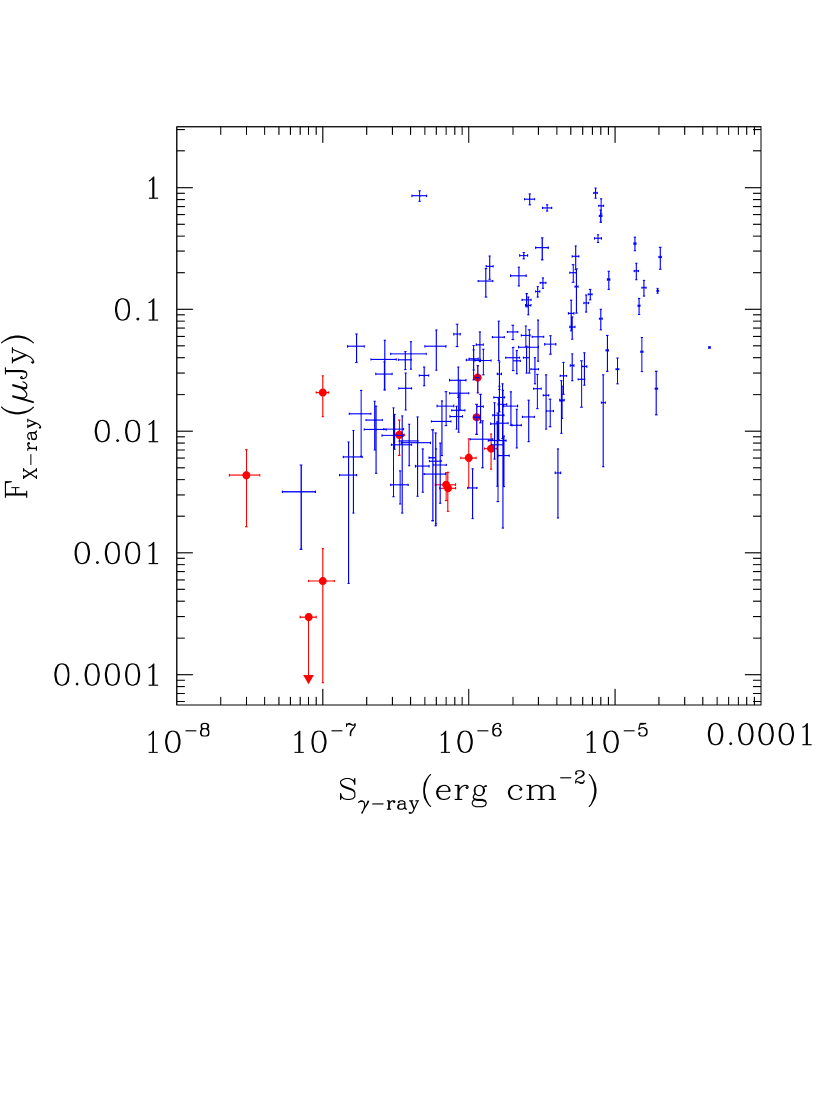
We show in Figure 2 the average X-ray afterglow flux density vs the gamma-ray fluence of the prompt emission for long and short Swift GRBs. We find a highly significant correlation (99.9999996% probability) for the long GRBs, albeit with a wide spread in the data. The correlation of the short bursts is less significant (69% probability) mostly due to the smaller number of points. There is an overlap between the brightest short bursts and the faintest long GRBs. The weakest short bursts are fainter than the weakest long bursts.
3.3. Prompt Gamma Ray Fluence and Peak Flux Correlations
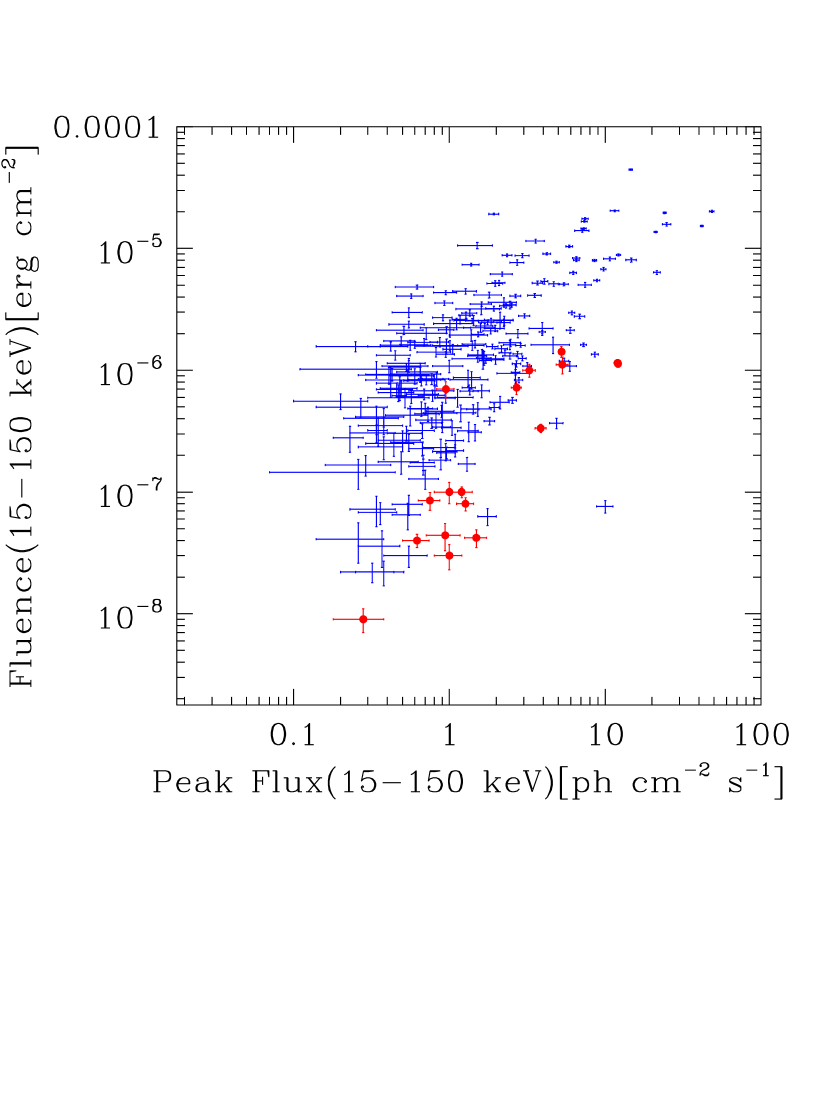
Figure 3 shows the prompt emission fluence as a function of peak flux for GRBs detected by BAT. We see a linear correlation for both short and long bursts with a significant spread in the correlation. The correlation probability is virtually 100% (null probability ) for long bursts and 99.9998% for short bursts. The best fit lines are distinctly different for short and long bursts, with the long burst having a higher fluence on average for a given flux level than short bursts as expected from duration alone.
4. Discussion
4.1. Correlations & Short/Long Distributions
We show in this work that correlations exist between prompt and afterglow fluxes of GRBs and between different wavelength bands in the afterglow. The highest significance correlation is between the prompt emission gamma-ray fluence and the X-ray afterglow flux at a significance level of 99.9999996% for long bursts and 69% for short bursts. The correlation between the optical afterglow and X-ray afterglow fluxes is less significant at 99% significance for long bursts and only % for short bursts (for a small sample, however).
It is important to note that there is a wide spread in the data for all of the correlations. The correlations are real and significant, but the fraction of the observed variations due to the correlations between the above parameters accounts for only a portion of the data spread. The correlation can only be used to predict a flux level to within approximately an order of magnitude. The fraction of the variation due to the correlations is given by the square of the correlation parameter, , which, as shown in Table 4, varies from a few percent to 50%. The rest of the data spread is due to other factors such as correlations with additional unknown parameters. An example of an additional parameter is extinction in the optical afterglow.
Short bursts are weaker on average than long bursts in afterglow fluxes. There is overlap with the dimmer long bursts, but the short bursts extend to lower intensities than seen for long bursts. The average X-ray flux density at 3 keV at 11 hr for the short bursts is Jy, which is more than an order of magnitude less than the average for long bursts of Jy.
The X-ray to gamma-ray correlation in Figure 2 has a positive correlation with a slope of roughly unity. This suggests that brighter bursts have more kinetic energy in the afterglow phase to power the afterglow. This is a manifestation of similar radiative efficiency among different bursts and between long and short GRBs. Such a point was made by Zhang et al. (2007) based on an analysis of a smaller sample of early Swift GRBs.
Except for the bursts below the “dark” line, most bursts in Figure 1 are confined between lines with 0.5 and 1.0. This is consistent with a general interpretation that the optical and X-ray emission belong to the same spectral component with an index close to 0.75. Within the standard model for emission via synchrotron radiation, for slow cooling which is generally relevant at hr, one expects for , which has a typical value of 0.75 for electron distribution power law . (An equivalent statement is that for this spectrum, the predicted ratio yields a line intermediate between and in Fig. 1.) This suggests that on average, the cooling frequency is above or not much below the X-ray band at 11 hr.
4.2. Dark GRBs
Another comparison of short and long GRBs relates to dark bursts. Jakobsson et al. (2004, see also De Pasquale et al. 2003) used the simple criterion to define dark bursts as those with extremely low optical to X-ray afterglow ratio, falling below the line of optical to X-ray spectral index, , equal to 0.5. It may seem counterintuitive that there can be dark bursts with optical detections and bursts not detected in the optical that are not “dark”, but the important criterion is how optically faint the burst is relative to its X-ray flux. For the pre-Swift sample there were 5 bursts with upper limits below the dark-burst line (restricting the Jakobsson et al. sample to include only those with upper limits fainter than , or Jy), compared to 24 bursts with actual measurements (not upper limits) above the line, giving a fraction of % in the dark category. For Swift there are 2 bursts with upper limits (GRB 050713B and 061222A) and 3 cases with measurements (GRB 060210, 070419B and 070508) below the line compared with 34 long bursts above the line for a fraction of % in the dark category, the same as the pre-Swift sample. The conclusion is that Swift is sampling the same source environments as previous instruments.
The discovery of 3 cases of dark bursts with optical detections is particularly interesting. One possible concern with this finding is that Swift X-ray afterglows are contaminated in many bursts by emission components not from the external shocks, e.g. X-ray flares. In such instances, the Jakobsson et al. (2004) approach to define dark bursts is no longer relevant since it assumes that the X-ray and optical emission is from the same emission component, but separated by a cooling break. However, the X-ray lightcurves for the Swift dark bursts are smooth around 11 hr (and beyond the end of the X-ray plateau), with no significant contamination from other components. These are real “dark” bursts from both an observational and physics perspective.
Correlation analyses between optical and X-ray can help answer the question of whether these two afterglow components originate from the same physical processes. It is assumed in the Jakobsson et al (2004) study that both X-ray and optical emission arise from the external forward shock. Multiwavelength observations in the Swift era reveal puzzling chromatic features of afterglow breaks (e.g., Panaitescu et al. 2006; Liang et al. 2007, 2008) that are not consistent with the simplest forward shock model. Models invoking non-forward-shock origin of X-ray afterglows have been discussed in the literature (e.g., Genet et al. 2007; Uhm & Beloborodov 2007; Ghisellini et al. 2007; Shao & Dai 2007; Panaitescu 2008). On the other hand, analyses suggest that the X-ray data are generally consistent with the temporal index and spectral index relations (e.g., Zhang & Mészáros 2004) predicted by the forward shock models, although not in every case. (Liang et al. 2007, Willingale, et al. 2007). The optical/X-ray data of some bursts (e.g., Grupe et al. 2007; Mangano et al. 2007) are consistent with the same forward shock model. Regardless of the exact process, the analysis presented in this paper shows that generally optical/X-ray afterglow fluxes are correlated, which suggests that they are due to the same emission process. The few cases well below the correlation line are found to be dark due to extinction in the host galaxy.
For the first time we can search for dark short bursts. No short bursts are seen that fall below the dark-burst line. It is hard to find dark GRBs using this criterion since X-ray afterglow fluxes are also low for the short bursts. However, there are some short bursts with bright X-ray afterglow, and, to date, none of those is seen to be highly deficient in optical afterglow. Statistics are still small with only 5 optical detections, but if the observed trend continues we will be able to conclude that short bursts do not occur in regions with extremely high extinction as occurs for some long bursts.
We are beginning to have optical detections of bursts below the dark burst line. In one of the three dark bursts with detections (GRB 060210), the burst is found to have high extinction associated with its host galaxy, explaining the low optical flux (Curran et al. 2007b). By modeling the differences between , , and , and taking into account the Lyman absorption (), the authors find the band source extinction could be mag () or mag (). This is an important development in our understanding of dark GRBs. (For two of the three dark bursts with detections - 070419B and 070508 - there has not yet been sufficiently detailed follow-up work on the putative hosts for constraints to be placed on the host extinction.) Assuming that the dark bursts can be largely explained by extinction, then the optical - X-ray correlations, ignoring the dark bursts, would hold true. We note that new studies are being done to examine dark burst definitions (van der Horst et al. 2008).
4.3. Prompt Fluence and Flux Comparisons
The comparison of fluences and peak fluxes in the prompt emission as shown in Figure 3 is a different kind of study than in the other two above. In this case, the strong observed correlation and high degree of separation of short and long bursts is expected; brighter bursts with higher peak fluxes naturally have higher fluences and short bursts tend to have lower fluence for a given flux by the very fact of their short duration. Within the short and long classes, the spread in fluence that is seen for a given peak flux is due to the diversity of durations and spectral indices. Bursts with longer duration and hard spectra have higher fluences for the same peak flux.
It is interesting to note in Figure 3 that the short bursts tend to be fluence limited in the BAT, while long bursts tend to be peak flux limited. This is due to the way BAT operates. A valid GRB trigger requires a statistically significant excess in both the rate and image domains (Fenimore et al. 2004). The ability to form an image depends on the number of photons collected on various trigger timescales, which is related to the burst fluence. Even for relatively high peak-fluxes, short bursts can have low fluence values and be limited in the number of photons available for the image trigger. On the other hand, long bursts tend to have higher fluences for a given peak-flux and become rate limited before the image limit is reached. BAT also has a pure-image mode for triggering where very long duration GRBs and other transients are found by comparing sky images instead of having a rate trigger. The lowest long-burst point in Figure 3 at a peak flux of was such an image-mode trigger for the very long ( min) and weak GRB 060218. A caveat on the above discussion is that the BAT trigger algorithm is complex with different trigger criteria evaluated. There are many different thresholds and limits coming into play for short and long burst triggering, with some mix of flux and fluence limits for both types.
This study was based on a 1 s binning for the gamma-ray fluxes. We have also investigated the effect of using a smaller bin size of 64 ms. Smaller bins pick out larger peak flux values when there is short time structure or when the burst has a duration shorter than the bin size. The effect of the smaller bin size is to shift the short bursts to the right (higher peak flux) relative to the long bursts by about a factor of 5. The larger bin size that we use allows for better statistics and is more reliable for long bursts. In either case, the short bursts tend to cluster toward lower fluences than long bursts.
5. Future Prospects
The combined prompt and afterglow data set for Swift GRBs is the largest available to date. We have chosen a criterion on the afterglow measurements for inclusion in this study of being a solid measurement 11 hr after the burst. Even with this stringent definition, there are more than 100 long bursts with X-ray afterglow data. The optical detections at 11 hr are less numerous with about 40 good measurements, but still enough statistics for conclusions to be reached.
The short burst correlation studies are possible now and key results are beginning to emerge. The Swift data base is growing quickly with time. In its expected lifetime of yr, the mission should provide a sample of short and long GRBs with good afterglow and prompt observations. That sized data set will allow more detailed correlations studies to investigate the interesting trends found in the current analysis.
References
- (1) Antonelli, L. A., et al. 2006, A&A, 456, 509
- (2) Barthelmy, S. D., et al. 2005a, Space Sci Rev, 120, 143
- (3) Barthelmy, S. D., et al. 2005b, Nature, 438, 994
- (4) Berger, E., et al. 2005, Nature, 438, 988
- (5) Berger, E., et al. 2006, GCN Circ. 5697, http://gcn.gsfc.nasa.gov/gcn/gcn3/5697.gcn3
- (6) Berger, E. 2007, ApJ, 670, 1254
- (7) Berger, E., et al. 2007, ApJ, 664, 1000
- (8) Bikmaev, I., et al. 2005, GCN Circ. 3797, http://gcn.gsfc.nasa.gov/gcn/gcn3/3797.gcn3
- (9) Bloom, J. S., et al. 1999, Nature, 401, 453
- (10) Bloom, J. S., et al. 2006, ApJ, 638, 354
- (11) Burrows, D. N., et al. 2005, Space Sci Rev, 120, 165
- (12) Butler, N. R. 2007, ApJ, 656, 1001
- (13) Cenko, S. B., et al. 2006, ApJ, 652, 490
- (14) Chen, H.-W., et al. 2007, ApJ, 663, 420
- (15) Cobb, B. E., & Bailyn, C. D. 2005, GCN Circ. 3104, http://gcn.gsfc.nasa.gov/gcn/gcn3/3104.gcn3
- (16) Curran, P. A., et al. 2007a, MNRAS, 381, L65
- (17) Curran, P. A., et al. 2007b, A&A, 467, 1049
- (18) Dai, X., et al. 2007, ApJ, 658, 509
- (19) D’Avanzo, P., et al. 2006, GCN Circ. 5884, http://gcn.gsfc.nasa.gov/gcn/gcn3/5884.gcn3
- (20) Della Valle, M., et al. 2006, ApJ, 642, L103
- (21) de Pasquale, M., et al. 2003, ApJ, 592, 1018
- (22) de Pasquale, M., et al. 2006, A&A, 455, 813
- (23) Durig, D. T., & Price, A. 2005, GCN Circ. 4023, http://gcn.gsfc.nasa.gov/gcn/gcn3/4023.gcn3
- (24) Efimov, Yu., et al. 2006, GCN Circ. 5986, http://gcn.gsfc.nasa.gov/gcn/gcn3/5986.gcn3
- (25) Eichler, D., Livio, M., Piran, T., & Schramm, D. N. 1989, Nature, 340, 126
- (26) Fenimore, E., et al. 2004, AIP, 727, 667
- (27) Firmani, C., Ghisellini, G., Avila-Reese, V., & Ghirlanda, G. 2006, MNRAS, 370, 185
- (28) Fox, D. B., et al. 2005, Nature, 437, 845
- (29) Fukugita, M., Shimasaku, K., & Ichikawa, T. 1995, PASP, 107, 945
- (30) Fynbo, J. P. U., et al. 2007, astro-ph/0703458
- (31) Fynbo, J. P. U., et al. 2006, Nature, 444, 1047
- (32) Galama, T. J., et al. 1998, Nature, 395, 670
- (33) Garnavich, P., & Karska, A. 2006, GCN Circ. 5253, http://gcn.gsfc.nasa.gov/gcn/gcn3/5253.gcn3
- (34) Gehrels, N., et al. 2004, ApJ, 611, 1005
- (35) Gehrels, N., et al. 2005, Nature, 437, 859
- (36) Genet, F., Daigne, F., & Mochkovitch, R. 2007, MNRAS, 381, 732
- (37) George, K., Banerjee, D. P. K., Chandrasekhar, T., & Ashok, N. M. 2006, ApJ, 640, L13
- (38) Ghirlanda, G., Nava, L., Ghisellini, G., & Firmani, C. 2007, A&A, 466, 127
- (39) Ghisellini, G., Ghirlanda, G., Nava, L., & Firmani, C. 2007, ApJ, 658, L75
- (40) Grupe, D. et al. 2007, ApJ, 662, 443
- (41) Hjorth, J., et al. 2003, Nature, 423, 847
- (42) Hjorth, J., et al. 2005, Nature, 437, 851
- (43) Huang, K. Y., et al. 2007, ApJ, 654, L25
- (44) Jakobsson, P., et al. 2004, ApJ, 617, L21
- (45) Kamble, A., Resmi, L., & Misra, K. 2007, ApJ, 664, L5
- (46) Kouveliotou, C., Meegan, C. A., Fishman, G. J., Bhat, N. P., Briggs, M. S., Koshut, T. M., Paciesas, W. S., & Pendleton, G. N. 1993, ApJ, 413, L101
- (47) Kulkarni, S. R. 2005, astro-ph/0510256
- (48) Lattimer, J. M., & Schramm, D. N. 1974, ApJ, 192, L145
- (49) Lee, W. H., & Ramirez-Ruiz, E. 2007, New J. Phys., 9, 17
- (50) Li, L.-X., & Paczyński, B. 1998, ApJ, 507, L59
- (51) Liang, E.-W., Racusin, J. L., Zhang, B., Zhang, B.-B., & Burrows, D. N. 2008, ApJ, 675, 528
- (52) Liang, E.-W., Zhang, B.-B., & Zhang, B. 2007, ApJ, 670, 565
- (53) MacFadyen, A. I., & Woosley, S. E. 1999, ApJ, 524, 262
- (54) Malesani, D., Stella, L., Covino, S., Lidman, C., & Naef, D. 2006, GCN Circ. 5705, http://gcn.gsfc.nasa.gov/gcn/gcn3/5705.gcn3
- (55) Malesani, D., et al. 2007, GCN Circ. 6565, http://gcn.gsfc.nasa.gov/gcn/gcn3/6565.gcn3
- (56) Malesani, D., et al. 2007, GCN Circ. 6674, http://gcn.gsfc.nasa.gov/gcn/gcn3/6674.gcn3
- (57) Malesani, D., et al. 2007, A&A, 473, 77
- (58) Mangano, V. et al. 2007, A&A, 470, 105
- (59) Melandri, A., Tanvir, N., & Guidorzi, C. 2006, GCN Circ. 5322, http://gcn.gsfc.nasa.gov/gcn/gcn3/5322.gcn3
- (60) Mészáros, P., & Rees, M. J. 1997, ApJ, 476, 232
- (61) Milne, P. A. 2006, GCN Circ. 5127, http://gcn.gsfc.nasa.gov/gcn/gcn3/5127.gcn3
- (62) Misra, K., & Pandey, S. B. 2005, GCN Circ. 3396, http://gcn.gsfc.nasa.gov/gcn/gcn3/3396.gcn3
- (63) Misra, K., et al. 2007, A&A, 464, 903
- (64) Mochkovitch, R., Hernanz, M., Isern, J., & Martin, X. 1993, Nature 361, 236
- (65) Monfardini, A., et al. 2006, ApJ, 648, 1125
- (66) Mundell, C. G., et al. 2006, GCN Circ. 5700, http://gcn.gsfc.nasa.gov/gcn/gcn3/5700.gcn3
- (67) Mundell, C. G., et al. 2007, ApJ, 660, 489
- (68) Nakar, E., et al. 2007, Phys Reports, 442, 166
- (69) Nava, L., Ghisellini, G., Ghirlanda, G., Tavecchio, F., & Firmani, C. 2006, A&A, 450, 471
- (70) Nousek, J. A., et al. 2006, ApJ, 642, 389
- (71) Nysewander, M., et al. 2007, astro-ph/0708.3444v2
- (72) Nysewander, M., Fruchter, A. S., & Pe’er, A. 2008, astro-ph/0806.3607v1
- (73) Oates, S. R., et al. 2006, MNRAS, 372, 327
- (74) Oechslin, R., Janka, H.-T., & Marek, A. 2007, A&A, 467, 395
- (75) Paczyński, B. 1986, ApJ, 308, L43
- (76) Page, K. L., et al. 2007, ApJ, 663, 1125
- (77) Panaitescu, A. 2008, MNRAS, 383, 1143
- (78) Panaitescu, A., et al. 2006, MNRAS, 366, 1357
- (79) Pandey, S. B., et al. 2006, A&A, 460, 415
- (80) Perley, D. A., et al. 2008, ApJ, 672, 449
- (81) Perley, D. A., Thoene, C. C., & Bloom, J. S. 2007, GCN Circ. 6774, http://gcn.gsfc.nasa.gov/gcn/gcn3/6774.gcn3
- (82) Pian, E., et al. 2006, Nature, 442, 1011
- (83) Piran, T., Kumar, P., Panaitescu, A., & Piro, L. 2001, ApJ, 560, L167
- (84) Press, W. H., Flannery, B. P., Teukolsky, S. A., & Vetterling, W. T. 1986, Numerical Recipes (New York: Cambridge Univ. Press)
- (85) Price, P. A., et al. 2006, GCN Circ. 5077, http://gcn.gsfc.nasa.gov/gcn/gcn3/5077.gcn3
- (86) Quimby, R., & Rykoff, E. S. 2006, GCN Circ. 5377, http://gcn.gsfc.nasa.gov/gcn/gcn3/5377.gcn3
- (87) Rol, E., et al. 2005, ApJ, 624, 868
- (88) Rol, E., et al. 2007, ApJ, 669, 1098
- (89) Roming, P. W. A., et al. 2005, Space Sci Rev, 120, 95
- (90) Roming, P. W. A., et al. 2006, ApJ, 652, 1416
- (91) Rosswog, S., Ramirez-Ruiz, E., & Davies, M. B. 2003, MNRAS, 345, 1077
- (92) Rykoff, E. S., et al. 2006, ApJ, 638, L5
- (93) Sakamoto, T., et al. 2006, in “Gamma-Ray Bursts in the Swift Era”, ed. S. S. Holt, N. Gehrels, and J. A. Nousek (AIP: New York), p. 43
- (94) Sakamoto, T., et al. 2008, ApJS, 175, 179
- (95) Salmonson, J. D., & Galama, T. J. 2002, ApJ, 569, 682
- (96) Schlegel, D. J., Finkbeiner, D. P., & Davis, M. 1998, ApJ, 500, 525
- (97) Schmidt, B., & Bayliss, D. 2006, GCN Circ. 4880, http://gcn.gsfc.nasa.gov/gcn/gcn3/4880.gcn3
- (98) Schmidt, B., & Mackie, G. 2007, GCN Circ. 6325, http://gcn.gsfc.nasa.gov/gcn/gcn3/6325.gcn3
- (99) Shao, L., & Dai, Z. G. 2007, ApJ, 660, 1319
- (100) Sharapov, D. et al. 2005, GCN Circ. 3701, http://gcn.gsfc.nasa.gov/gcn/gcn3/3701.gcn3
- (101) Shao, L., & Dai, Z. G. 2005, ApJ, 633, 1027
- (102) Soderberg, A. M., et al. 2006, ApJ, 650, 261
- (103) Soderberg, A. M., et al. 2007, ApJ, 661, 982
- (104) Sollerman, J., et al. 2007, A&A, 466, 839
- (105) Soyano, T., Mito, H., & Urata, Y. 2006, GCN Circ. 5548, http://gcn.gsfc.nasa.gov/gcn/gcn3/5548.gcn3
- (106) Spearman, C. 1904, Am J Psychol, 15, 72
- (107) Stanek, K. Z., et al. 2003, ApJ, 591, L17
- (108) Stanek, K. Z., et al. 2007, ApJ, 654, L21
- (109) Stefanescu, A., et al. 2006, GCN Circ. 5291, http://gcn.gsfc.nasa.gov/gcn/gcn3/5291.gcn3
- (110) Stratta, G., Fiore, F., Antonelli, L. A., Piro, L., & de Pasquale, M. 2004, ApJ, 608, 846
- (111) Terra, F., et al. 2007, GCN Circ., 6458, http://gcn.gsfc.nasa.gov/gcn/gcn3/6458.gcn3
- (112) Thoene, C. C., Fynbo, J. P. U., & Jakobsson, P. 2006, GCN Circ. 5747, http://gcn.gsfc.nasa.gov/gcn/gcn3/5747.gcn3
- (113) Thoene, C. C., Fynbo, J. P. U., & Williams, A. 2007, GCN Circ. 6389, http://gcn.gsfc.nasa.gov/gcn/gcn3/6389.gcn3
- (114) Thoene, C. C., Kann, D. A., Augusteijn, T., & Reyle-Laffont, C. 2007, GCN Circ. 6154, http://gcn.gsfc.nasa.gov/gcn/gcn3/6154.gcn3
- (115) Uhm, Z. L., & Beloborodov, A. M. 2007, ApJ, 665, L93
- (116) van der Horst, A. J., et al. 2008, ApJ, in prep.
- (117) Villasenor, J. S., et al. 2005, Nature, 437, 851.
- (118) Willingale, R., et al. 2007, ApJ, 662, 1093
- (119) Woosley, S. E., 1993, ApJ, 405, 273.
- (120) Woosley, S. E., & Bloom, J. S. 2006, ARAA, 44, 507
- (121) Woźniak, P. R., Vestrand, W. T., Wren, J. A., White, R. R., Evans, S. M., & Casperson, D. 2005, ApJ, 627, L13
- (122) Yost, S. A., et al. 2007, ApJ, 657, 925
- (123) Zhang, B., et al. 2006, ApJ, 642, 354
- (124) Zhang, B., et al. 2007, ApJ, 655, 989
- (125) Zhang, Z.-B., & Choi, C.-S. 2008, A&A, 484, 293
- (126) Zhang, B., & Mészáros, P. 2004, IJMPA, 19, 2385
| (1) | (2) | (3) | (4) | (5) | (6) | (7) | (8) | (9) | (10) | (11) | (12) | (13) | (14) | (15) | (16) |
|---|---|---|---|---|---|---|---|---|---|---|---|---|---|---|---|
| GRB | -rayaaBAT prompt fluence in keV band. Data from Sakamoto et al. (2008). | -rayaaBAT prompt fluence in keV band. Data from Sakamoto et al. (2008). | X-ray | X-ray | X-ray | X-ray | X-ray | X-raybbXRT flux density at 3 keV at 11 hr after the burst trigger. Error includes 10% systematic uncertainty. | X-raybbXRT flux density at 3 keV at 11 hr after the burst trigger. Error includes 10% systematic uncertainty. | TimeccHrs after burst trigger of optical data, or code for optical data. If a number, it is the time after the burst (typically listed for GCN only data). If letters, the first letter is for F = full light curve, I = interpolated between measured values on either side of 11 hr, and E = extrapolated from measured data. The lower case letters indicate if the data in the referenced papers was in magnitude or Jansky units (mmf = first two references in magnitude units, third reference in Jansky units) | FluxddOptical data in band at 11 hr after the burst trigger. band flux density estimated from typical burst spectra if data taken in other bands. Error includes 10% systematic uncertainty. | FluxddOptical data in band at 11 hr after the burst trigger. band flux density estimated from typical burst spectra if data taken in other bands. Error includes 10% systematic uncertainty. | |||
| Fluence | Fluence | Integral | Integral | Spectrum | Spectrum | Spectrum | Flux | Flux | Error | band | Density | Density | Ref. | ||
| Error | Flux | Flux | Photon | Photon | Photon | Density | Density | data | @11 hr | Error | |||||
| keV | Error | Index | Index | Index | @3 keV | Error | or code | ||||||||
| @11 hr | Lower | Upper | @11 hr | ||||||||||||
| Error | Error | ||||||||||||||
| erg cm-2 | erg cm-2 | erg cm-2 s-1 | erg cm-2 s-1 | Jy | Jy | hr | Jy | Jy | |||||||
| 050509B | 0.09 | 0.02 | UL | 11. | UL | Correlations of Prompt and Afterglow Emission in Swift Long and Short Gamma Ray Bursts | |||||||||
| 050724 | 9.98 | 1.2 | 1.59 | 0.51 | 2.06 | 0.52 | 0.79 | 6.03 | 2.6 | 20.3 | 0.2 | Ff | 23.6 | 4.4 | Correlations of Prompt and Afterglow Emission in Swift Long and Short Gamma Ray Bursts |
| 050813 | 0.44 | 0.11 | UL | 13. | UL | Correlations of Prompt and Afterglow Emission in Swift Long and Short Gamma Ray Bursts | |||||||||
| 051220 | 0.85 | 0.14 | |||||||||||||
| 051221A | 11.5 | 0.35 | 7.52 | 1.4 | 2.12 | 0.17 | 0.19 | 27.5 | 6.9 | 21.9 | 0.5 | If | 5.22 | 2.5 | Correlations of Prompt and Afterglow Emission in Swift Long and Short Gamma Ray Bursts |
| 051227 | 6.99 | 1.1 | 0.864 | 0.18 | 1.86 | 0.21 | 0.23 | 3.63 | 0.93 | 24.9 | 0.12 | 11.45 | 0.333 | 0.04 | Correlations of Prompt and Afterglow Emission in Swift Long and Short Gamma Ray Bursts |
| 060313 | 11.3 | 0.45 | 4 | 0.66 | 2.27 | 0.2 | 0.23 | 13 | 3.6 | UL | 8.4 | UL | Correlations of Prompt and Afterglow Emission in Swift Long and Short Gamma Ray Bursts | ||
| 060502B | 0.4 | 0.05 | UL | 16.8 | UL | Correlations of Prompt and Afterglow Emission in Swift Long and Short Gamma Ray Bursts | |||||||||
| 060801 | 0.8 | 0.1 | UL | 2.69 | 0.69 | 1.1 | UL | ||||||||
| 061006 | 14.2 | 1.4 | 1.66 | 0.43 | 1.78 | 0.28 | 0.44 | 7.17 | 2.3 | 21.8 | 0.2 | 14.6 | 6.0 | 1.1 | Correlations of Prompt and Afterglow Emission in Swift Long and Short Gamma Ray Bursts |
| 061201 | 3.34 | 0.27 | 2.07 | 0.59 | 1.61 | 0.27 | 0.55 | 9.32 | 3 | 22.7 | 0.3 | 8.38 | 2.52 | 0.7 | Correlations of Prompt and Afterglow Emission in Swift Long and Short Gamma Ray Bursts |
| 061217 | 0.42 | 0.07 | 2.17 | 3.1 | |||||||||||
| 070724A | 0.3 | 0.07 | 1.18 | 0.53 | 2.1 | 0.46 | 0.57 | 4.34 | 2.7 | ||||||
| 070729 | 1 | 0.2 | 0.16 | 0.091 | 2.11 | 0.77 | 1.5 | 0.586 | 0.5 | ||||||
| 070809 | 1 | 0.1 | 4.55 | 1.5 | 1.4 | 0.35 | 0.5 | 20.8 | 7.6 | 23.8 | 0.2 | 11.21 | 0.879 | 0.16 | Correlations of Prompt and Afterglow Emission in Swift Long and Short Gamma Ray Bursts |
References. — [1] Misra & Pandey (2005) [2] Malesani et al. (2007) [3] Bikmaev et al. (2005) [4] Soderberg et al. (2006) [5] Berger et al. (2007) [6] Schmidt & Bayliss (2006) [7] Price et al. (2006) [8] Malesani et al. (2006) [9] D’Avanzo et al. (2006) [10] Perley, Thoene, & Bloom (2007)
| (1) | (2) | (3) | (4) | (5) | (6) | (7) | (8) | (9) | (10) | (11) | (12) | (13) | (14) | (15) | (16) |
|---|---|---|---|---|---|---|---|---|---|---|---|---|---|---|---|
| GRB | -rayaaBAT prompt fluence in keV band. Data from Sakamoto et al. (2008). | -rayaaBAT prompt fluence in keV band. Data from Sakamoto et al. (2008). | X-ray | X-ray | X-ray | X-ray | X-ray | X-raybbXRT flux density at 3 keV at 11 hr after the burst trigger. Error includes 10% systematic uncertainty. | X-raybbXRT flux density at 3 keV at 11 hr after the burst trigger. Error includes 10% systematic uncertainty. | TimeccHrs after burst trigger of optical data, or code for optical data. If a number, it is the time after the burst (typically listed for GCN only data). If letters, the first letter is for F = full light curve, I = interpolated between measured values on either side of 11 hr, and E = extrapolated from measured data. The lower case letters indicate if the data in the referenced papers was in magnitude or Jansky units (mmf = first two references in magnitude units, third reference in Jansky units) | FluxddOptical data in band at 11 hr after the burst trigger. band flux density estimated from typical burst spectra if data taken in other bands. Error includes 10% systematic uncertainty. | FluxddOptical data in band at 11 hr after the burst trigger. band flux density estimated from typical burst spectra if data taken in other bands. Error includes 10% systematic uncertainty. | |||
| Fluence | Fluence | Integral | Integral | Spectrum | Spectrum | Spectrum | Flux | Flux | Error | band | Density | Density | Ref. | ||
| Error | Flux | Flux | Photon | Photon | Photon | Density | Density | data | @11 hr | Error | |||||
| keV | Error | Index | Index | Index | @3 keV | Error | or code | ||||||||
| @11 hr | Lower | Upper | @11 hr | ||||||||||||
| Error | Error | ||||||||||||||
| erg cm-2 | erg cm-2 | erg cm-2 s-1 | erg cm-2 s-1 | Jy | Jy | hr | Jy | Jy | |||||||
| with OPT | |||||||||||||||
| @11 hr | |||||||||||||||
| 050315 | 32.2 | 1.5 | 41.9 | 3.2 | 2 | 0.068 | 0.071 | 165 | 16 | 20.7 | 0.2 | 11.6 | 16.4 | 3 | Correlations of Prompt and Afterglow Emission in Swift Long and Short Gamma Ray Bursts |
| 050318 | 10.8 | 0.77 | 9.61 | 1.4 | 1.93 | 0.13 | 0.14 | 39.2 | 7.3 | 20.2 | 0.2 | Ef | 26 | 4.8 | Correlations of Prompt and Afterglow Emission in Swift Long and Short Gamma Ray Bursts |
| 050319 | 13.1 | 1.5 | 45 | 9.6 | 2.05 | 0.12 | 0.13 | 171 | 45 | 20.2 | 0.1 | Fmmmf | 25 | 2.3 | Correlations of Prompt and Afterglow Emission in Swift Long and Short Gamma Ray Bursts,Correlations of Prompt and Afterglow Emission in Swift Long and Short Gamma Ray Bursts,Correlations of Prompt and Afterglow Emission in Swift Long and Short Gamma Ray Bursts,Correlations of Prompt and Afterglow Emission in Swift Long and Short Gamma Ray Bursts |
| 050416A | 3.67 | 0.37 | 10.4 | 1.3 | 2.1 | 0.12 | 0.14 | 38.5 | 6.5 | 21.2 | 0.1 | Fff | 9.94 | 0.92 | Correlations of Prompt and Afterglow Emission in Swift Long and Short Gamma Ray Bursts,Correlations of Prompt and Afterglow Emission in Swift Long and Short Gamma Ray Bursts |
| 050525A | 153 | 2.2 | 14.3 | 2.7 | 2.32 | 0.2 | 0.26 | 44.8 | 14 | 19.6 | 0.1 | Ffmf | 43.4 | 4 | Correlations of Prompt and Afterglow Emission in Swift Long and Short Gamma Ray Bursts,Correlations of Prompt and Afterglow Emission in Swift Long and Short Gamma Ray Bursts,Correlations of Prompt and Afterglow Emission in Swift Long and Short Gamma Ray Bursts |
| 050721 | 36.2 | 3.2 | 12.7 | 1.6 | 1.93 | 0.15 | 0.2 | 51.7 | 8.9 | 21.4 | 0.6 | If | 8.27 | 4.8 | Correlations of Prompt and Afterglow Emission in Swift Long and Short Gamma Ray Bursts |
| 050730 | 23.8 | 1.5 | 62.8 | 3.3 | 1.72 | 0.051 | 0.052 | 277 | 17 | 20.2 | 0.1 | Fmff | 25.8 | 2.4 | Correlations of Prompt and Afterglow Emission in Swift Long and Short Gamma Ray Bursts,Correlations of Prompt and Afterglow Emission in Swift Long and Short Gamma Ray Bursts,Correlations of Prompt and Afterglow Emission in Swift Long and Short Gamma Ray Bursts |
| 050801 | 3.1 | 0.48 | 2.47 | 0.66 | 1.85 | 0.18 | 0.28 | 10.4 | 3.3 | 21.5 | 0.3 | Ef | 7.54 | 2.1 | Correlations of Prompt and Afterglow Emission in Swift Long and Short Gamma Ray Bursts |
| 050802 | 20 | 1.6 | 15.4 | 1.7 | 1.84 | 0.087 | 0.094 | 65.2 | 8.7 | 20.7 | 0.2 | Ff | 15.1 | 2.8 | Correlations of Prompt and Afterglow Emission in Swift Long and Short Gamma Ray Bursts |
| 050820A | 34.4 | 2.4 | 176 | 7.5 | 2.02 | 0.048 | 0.049 | 681 | 40 | 18.8 | 0.1 | Ffff | 87.2 | 8 | Correlations of Prompt and Afterglow Emission in Swift Long and Short Gamma Ray Bursts,Correlations of Prompt and Afterglow Emission in Swift Long and Short Gamma Ray Bursts,Correlations of Prompt and Afterglow Emission in Swift Long and Short Gamma Ray Bursts |
| 050824 | 2.66 | 0.52 | 9.88 | 3.6 | 2.01 | 0.22 | 0.24 | 38.7 | 17 | 21.2 | 0.2 | Ff | 9.94 | 1.8 | Correlations of Prompt and Afterglow Emission in Swift Long and Short Gamma Ray Bursts |
| 050908 | 4.83 | 0.51 | 1.24 | 0.38 | 1.88 | 0.28 | 0.45 | 5.15 | 2 | 21.9 | 0.5 | If | 5.06 | 2.4 | Correlations of Prompt and Afterglow Emission in Swift Long and Short Gamma Ray Bursts |
| 050922C | 16.2 | 0.54 | 8.27 | 1.5 | 2.15 | 0.18 | 0.19 | 29.5 | 7.5 | 20.8 | 0.3 | 7 | 14.3 | 4 | Correlations of Prompt and Afterglow Emission in Swift Long and Short Gamma Ray Bursts |
| 051109A | 22 | 2.7 | 48.5 | 6.4 | 2.02 | 0.13 | 0.14 | 189 | 33 | 19.7 | 0.1 | Fff | 39.6 | 3.7 | Correlations of Prompt and Afterglow Emission in Swift Long and Short Gamma Ray Bursts,Correlations of Prompt and Afterglow Emission in Swift Long and Short Gamma Ray Bursts |
| 060108 | 3.69 | 0.37 | 6 | 1.5 | 2.08 | 0.25 | 0.29 | 22.5 | 7.6 | 22.5 | 0.4 | If | 3 | 1.1 | Correlations of Prompt and Afterglow Emission in Swift Long and Short Gamma Ray Bursts |
| 060124 | 4.61 | 0.53 | 223 | 16 | 2.04 | 0.078 | 0.081 | 856 | 83 | 19.1 | 0.1 | Fmf | 68.8 | 6.3 | Correlations of Prompt and Afterglow Emission in Swift Long and Short Gamma Ray Bursts,Correlations of Prompt and Afterglow Emission in Swift Long and Short Gamma Ray Bursts |
| 060206 | 8.31 | 0.42 | 18.6 | 2.4 | 2.23 | 0.14 | 0.16 | 62.6 | 13 | 18.9 | 0.1 | Ffffff | 82.7 | 7.6 | Correlations of Prompt and Afterglow Emission in Swift Long and Short Gamma Ray Bursts,Correlations of Prompt and Afterglow Emission in Swift Long and Short Gamma Ray Bursts,Correlations of Prompt and Afterglow Emission in Swift Long and Short Gamma Ray Bursts, Correlations of Prompt and Afterglow Emission in Swift Long and Short Gamma Ray Bursts |
| 060210 | 76.6 | 4.1 | 106 | 5.3 | 2.13 | 0.057 | 0.058 | 383 | 28 | 23.4 | 0.1 | Fmf | 1.37 | 0.13 | Correlations of Prompt and Afterglow Emission in Swift Long and Short Gamma Ray Bursts,Correlations of Prompt and Afterglow Emission in Swift Long and Short Gamma Ray Bursts |
| 060418 | 83.3 | 2.5 | 5.12 | 1.9 | 2.24 | 0.59 | 0.96 | 17.1 | 12 | 20.2 | 0.1 | Ff | 25 | 2.3 | Correlations of Prompt and Afterglow Emission in Swift Long and Short Gamma Ray Bursts |
| 060512 | 2.32 | 0.4 | 2.98 | 1.1 | 2.19 | 0.35 | 0.53 | 10.3 | 5.8 | 21.1 | 0.16 | 6.8 | 10.5 | 1.6 | Correlations of Prompt and Afterglow Emission in Swift Long and Short Gamma Ray Bursts |
| 060526 | 12.6 | 1.6 | 8.69 | 1.7 | 1.74 | 0.17 | 0.24 | 38 | 9 | 19.7 | 0.1 | Fmff | 39.6 | 3.7 | Correlations of Prompt and Afterglow Emission in Swift Long and Short Gamma Ray Bursts, Correlations of Prompt and Afterglow Emission in Swift Long and Short Gamma Ray Bursts |
| 060604 | 4.02 | 1.1 | 11.5 | 2.1 | 2.07 | 0.17 | 0.19 | 43.2 | 11 | 20.6 | 0.2 | 16.5 | 17.2 | 3.2 | Correlations of Prompt and Afterglow Emission in Swift Long and Short Gamma Ray Bursts |
| 060605 | 6.97 | 0.9 | 4.36 | 1 | 2.1 | 0.19 | 0.27 | 16.1 | 5 | 20.6 | 0.2 | Ff | 17.8 | 3.3 | Correlations of Prompt and Afterglow Emission in Swift Long and Short Gamma Ray Bursts |
| 060607A | 25.5 | 1.1 | 23.8 | 3.4 | 1.59 | 0.13 | 0.14 | 108 | 18 | 20.4 | 0.3 | Ef | 20.8 | 5.8 | Correlations of Prompt and Afterglow Emission in Swift Long and Short Gamma Ray Bursts |
| 060614 | 204 | 3.6 | 70.3 | 11 | 2.04 | 0.15 | 0.16 | 269 | 55 | 19.2 | 0.1 | Ffmf | 62.7 | 5.8 | Correlations of Prompt and Afterglow Emission in Swift Long and Short Gamma Ray Bursts,Correlations of Prompt and Afterglow Emission in Swift Long and Short Gamma Ray Bursts,Correlations of Prompt and Afterglow Emission in Swift Long and Short Gamma Ray Bursts |
| 060714 | 28.3 | 1.7 | 9.18 | 1.6 | 2.18 | 0.17 | 0.18 | 32.2 | 7.8 | 21.1 | 0.15 | 8.7 | 11.3 | 1.6 | Correlations of Prompt and Afterglow Emission in Swift Long and Short Gamma Ray Bursts |
| 060729 | 26.1 | 2.1 | 218 | 16 | 2.1 | 0.076 | 0.078 | 805 | 84 | 16.6 | 0.18 | 20 | 716 | 120 | Correlations of Prompt and Afterglow Emission in Swift Long and Short Gamma Ray Bursts |
| 060904B | 16.2 | 1.4 | 5.57 | 0.87 | 2.22 | 0.17 | 0.18 | 18.9 | 4.5 | 20.2 | 0.2 | 15.7 | 25.9 | 4.8 | Correlations of Prompt and Afterglow Emission in Swift Long and Short Gamma Ray Bursts |
| 061007 | 444 | 5.6 | 11.3 | 0.11 | 1.78 | 0.014 | 0.014 | 48.7 | 0.63 | 21 | 0.2 | Im | 12 | 2.2 | Correlations of Prompt and Afterglow Emission in Swift Long and Short Gamma Ray Bursts |
| 061021 | 29.6 | 1 | 37.5 | 2.7 | 2.08 | 0.079 | 0.083 | 140 | 14 | 19.5 | 0.1 | 16.5 | 49 | 4.5 | Correlations of Prompt and Afterglow Emission in Swift Long and Short Gamma Ray Bursts |
| 061110A | 10.6 | 0.76 | 0.845 | 0.31 | 1.95 | 0.32 | 0.41 | 3.41 | 1.5 | 23 | 0.3 | 8 | 1.98 | 0.55 | Correlations of Prompt and Afterglow Emission in Swift Long and Short Gamma Ray Bursts |
| 061121 | 137 | 2 | 82 | 8.4 | 1.84 | 0.1 | 0.11 | 347 | 44 | 20.1 | 0.1 | Fff | 27.4 | 2.5 | Correlations of Prompt and Afterglow Emission in Swift Long and Short Gamma Ray Bursts,Correlations of Prompt and Afterglow Emission in Swift Long and Short Gamma Ray Bursts |
| 061126 | 67.7 | 2.2 | 33.2 | 2.4 | 1.95 | 0.096 | 0.1 | 133 | 13 | 21.4 | 0.1 | Fm/f | 8.27 | 0.76 | Correlations of Prompt and Afterglow Emission in Swift Long and Short Gamma Ray Bursts |
| 070224 | 3.05 | 0.51 | 2.49 | 1.1 | 2.1 | 0.67 | 0.91 | 9.2 | 6.3 | 23.4 | 0.3 | 7.2 | 1.37 | 0.38 | Correlations of Prompt and Afterglow Emission in Swift Long and Short Gamma Ray Bursts |
| 070419B | 73.6 | 2 | 204 | 16 | 1.68 | 0.092 | 0.096 | 906 | 85 | 22.8 | 0.2 | 7.3 | 2.38 | 0.44 | Correlations of Prompt and Afterglow Emission in Swift Long and Short Gamma Ray Bursts |
| 070508 | 196 | 2.7 | 32.1 | 1.2 | 1.7 | 0.054 | 0.057 | 142 | 6.5 | 23.3 | 0.2 | 4.1 | 1.48 | 0.27 | Correlations of Prompt and Afterglow Emission in Swift Long and Short Gamma Ray Bursts |
| 070518 | 1.62 | 0.24 | 1.87 | 0.7 | 2.27 | 0.5 | 0.68 | 6.12 | 4 | 22.7 | 0.2 | 9 | 2.52 | 0.47 | Correlations of Prompt and Afterglow Emission in Swift Long and Short Gamma Ray Bursts |
| OPTICAL | |||||||||||||||
| LIMIT | |||||||||||||||
| @11 hr | |||||||||||||||
| 050713B | 31.8 | 3.2 | 77.5 | 12 | 1.89 | 0.17 | 0.19 | 321 | 65 | UL | 6. | UL | Correlations of Prompt and Afterglow Emission in Swift Long and Short Gamma Ray Bursts | ||
| 061004 | 5.66 | 0.31 | 2.06 | 0.67 | 2.4 | 0.53 | 0.67 | 6.04 | 4.2 | UL | 12. | UL | Correlations of Prompt and Afterglow Emission in Swift Long and Short Gamma Ray Bursts | ||
| 061222A | 79.9 | 1.6 | 158 | 13 | 2.09 | 0.095 | 0.099 | 587 | 68 | UL | 16. | UL | Correlations of Prompt and Afterglow Emission in Swift Long and Short Gamma Ray Bursts | ||
| 070721A | 0.71 | 0.18 | 1.43 | 0.45 | 2.65 | 0.39 | 0.39 | 3.17 | 2.1 | UL | 18.8 | UL | Correlations of Prompt and Afterglow Emission in Swift Long and Short Gamma Ray Bursts |
References. — [1] Cobb & Bailyn (2005) [2] Liang et al. (2008) [3] Woźniak et al. (2005) [4] George et al. (2006) [5] Huang et al. (2007) [6] Kamble, Resmi, & Misra (2007) [7] Ghirlanda, Nava, Ghisellini, & Firmani (2007) [8] Soderberg et al. (2007) [9] Shao & Dai (2005) [10] Della Valle et al. (2006) [11] Antonelli et al. (2006) [12] Pandey et al. (2006) [13] Chen et al. (2007) [14] Rykoff et al. (2006) [15] Cenko et al. (2006) [16] Sollerman et al. (2007) [17] Durig & Price (2005) [18] Yost et al. (2007) [19] Oates et al. (2006) [20] Misra et al. (2007) [21] Monfardini et al. (2006) [22] Stanek et al. (2007) [23] Curran et al. (2007a) [24] Curran et al. (2007b) [25] Milne (2006) [26] Dai et al. (2007) [27] Garnavich & Karska (2006) [28] Nysewander et al. (2007) [29] Fynbo et al. (2006) [30] Mangano et al. (2007) [31] Melandri, Tanvir & Guidorzi (2006) [32] Quimby & Rykoff (2006) [33] Soyano, Mito, & Urata (2006) [34] Mundell et al. (2007) [35] Thoene, Fynbo & Jakobsson (2006) [36] Fynbo (2006) [37] Page et al. (2007) [38] Perley et al. (2007) [39] Thoene et al. (2007) [40] Schmidt & Mackie (2007) [41] Thoene, Fynbo, & Williams (2007) [42] Terra et al. (2007) [43] Sharapov et al. (2005) [44] Berger et al. (2006) [45] Efimov et al. (2006) [46] Malesani et al. (2007)
| (1) | (2) | (3) | (4) | (5) | (6) | (7) | (8) | (9) | (10) |
|---|---|---|---|---|---|---|---|---|---|
| GRB | -rayaaBAT prompt fluence in keV band. Data from Sakamoto et al. (2008). | -rayaaBAT prompt fluence in keV band. Data from Sakamoto et al. (2008). | X-ray | X-ray | X-ray | X-ray | X-ray | X-raybbXRT flux density at 3 keV at 11 hr after the burst trigger. Error includes 10% systematic uncertainty. | X-raybbXRT flux density at 3 keV at 11 hr after the burst trigger. Error includes 10% systematic uncertainty. |
| Fluence | Fluence | Integral | Integral | Spectrum | Spectrum | Spectrum | Flux | Flux | |
| Error | Flux | Flux | Photon | Photon | Photon | Density | Density | ||
| keV | Error | Index | Index | Index | @3 keV | Error | |||
| @11 hr | Lower | Upper | @11hr | ||||||
| Error | Error | ||||||||
| erg cm-2 | erg cm-2 | erg cm-2 s-1 | erg cm-2 s-1 | Jy | Jy | ||||
| 050124 | 11.9 | 0.66 | 12.4 | 2.7 | 1.89 | 0.22 | 0.27 | 51.3 | 14 |
| 050128 | 50.2 | 2.3 | 23.6 | 5.2 | 2 | 0.19 | 0.21 | 92.8 | 26 |
| 050215B | 2.27 | 0.29 | 2.76 | 1.1 | 1.67 | 0.4 | 0.47 | 12.3 | 5.3 |
| 050219B | 158 | 5 | 38.8 | 3.6 | 2.01 | 0.15 | 0.16 | 151 | 22 |
| 050223 | 6.36 | 0.65 | 1.28 | 0.53 | 1.9 | 0.51 | 0.62 | 5.26 | 2.7 |
| 050326 | 88.6 | 1.6 | 12.1 | 2.5 | 2.05 | 0.21 | 0.45 | 46.1 | 15 |
| 050505 | 24.9 | 1.8 | 31.1 | 3 | 2.03 | 0.085 | 0.089 | 120 | 15 |
| 050603 | 63.6 | 2.3 | 27.6 | 3.6 | 1.93 | 0.11 | 0.12 | 113 | 18 |
| 050607 | 5.92 | 0.55 | 2.13 | 0.65 | 2.49 | 0.5 | 0.59 | 5.67 | 4 |
| 050712 | 10.8 | 1.2 | 11 | 2.2 | 2.18 | 0.23 | 0.26 | 38.4 | 12 |
| 050713A | 51.1 | 2.1 | 22 | 2.9 | 2.27 | 0.15 | 0.17 | 71.8 | 15 |
| 050713B | 31.8 | 3.2 | 77.5 | 12 | 1.89 | 0.17 | 0.19 | 321 | 65 |
| 050714B | 5.95 | 1 | 2.63 | 0.72 | 2.88 | 0.38 | 0.21 | 4.43 | 2.7 |
| 050716 | 61.7 | 2.4 | 9.57 | 1.7 | 2.16 | 0.25 | 0.29 | 33.9 | 10 |
| 050726 | 19.4 | 2.1 | 4.38 | 0.88 | 2.11 | 0.25 | 0.29 | 16.1 | 4.9 |
| 050814 | 20.1 | 2.2 | 10.2 | 1.7 | 2.01 | 0.14 | 0.15 | 40.1 | 8.6 |
| 050819 | 3.5 | 0.55 | 2.75 | 1.1 | 2.44 | 0.46 | 0.57 | 7.72 | 5.6 |
| 050822 | 24.6 | 1.7 | 17.9 | 2.3 | 2.21 | 0.15 | 0.16 | 61.1 | 12 |
| 050915A | 8.5 | 0.88 | 3.63 | 0.89 | 1.93 | 0.33 | 0.43 | 14.8 | 5 |
| 050915B | 33.8 | 1.4 | 5.74 | 1.9 | 2.21 | 0.3 | 0.37 | 19.7 | 9.3 |
| 051001 | 17.4 | 1.5 | 2.3 | 0.51 | 2.46 | 0.28 | 0.35 | 6.31 | 2.8 |
| 051008 | 50.9 | 1.4 | 9.78 | 1.6 | 2.16 | 0.19 | 0.2 | 34.6 | 8.6 |
| 051016B | 1.7 | 0.22 | 11.9 | 2.4 | 1.86 | 0.19 | 0.21 | 49.7 | 13 |
| 051117A | 43.4 | 1.6 | 5.96 | 1.1 | 2.36 | 0.18 | 0.21 | 18 | 5.3 |
| 051221A | 11.5 | 0.35 | 7.52 | 1.4 | 2.12 | 0.17 | 0.19 | 27.5 | 6.9 |
| 060109 | 6.55 | 1 | 4.96 | 1 | 2.58 | 0.3 | 0.35 | 12 | 5.7 |
| 060111A | 12 | 0.58 | 5.1 | 0.78 | 2.32 | 0.18 | 0.21 | 15.9 | 4.2 |
| 060111B | 16 | 1.4 | 3.73 | 0.9 | 2.14 | 0.29 | 0.35 | 13.5 | 5 |
| 060115 | 17.1 | 1.5 | 5.66 | 2.3 | 2.72 | 0.46 | 0.68 | 11.6 | 10 |
| 060202 | 21.3 | 1.6 | 10.6 | 1.3 | 3.21 | 0.17 | 0.19 | 11.2 | 3.9 |
| 060204B | 29.5 | 1.8 | 7.18 | 1.3 | 2.33 | 0.22 | 0.26 | 22.3 | 7 |
| 060211A | 15.7 | 1.4 | 2.84 | 0.79 | 2.47 | 0.34 | 0.43 | 7.73 | 4.2 |
| 060306 | 21.3 | 1.2 | 11.7 | 1.5 | 2.28 | 0.15 | 0.17 | 37.8 | 8.1 |
| 060319 | 2.64 | 0.34 | 8.65 | 1.4 | 2.21 | 0.18 | 0.22 | 29.5 | 7.6 |
| 060428A | 13.9 | 0.78 | 66 | 8 | 2.21 | 0.19 | 0.2 | 226 | 49 |
| 060428B | 8.23 | 0.81 | 3.22 | 0.54 | 1.92 | 0.16 | 0.18 | 13.2 | 2.8 |
| 060507 | 44.5 | 2.3 | 7.85 | 1.6 | 2.14 | 0.21 | 0.25 | 28.4 | 8.3 |
| 060510A | 80.5 | 3.1 | 178 | 21 | 1.98 | 0.069 | 0.14 | 708 | 100 |
| 060510B | 40.7 | 1.8 | 1.45 | 0.5 | 2.32 | 0.36 | 0.5 | 4.54 | 2.6 |
| 060707 | 16 | 1.5 | 15.4 | 4.1 | 2.05 | 0.25 | 0.33 | 59 | 21 |
| 060708 | 4.94 | 0.37 | 7.5 | 1 | 2.05 | 0.12 | 0.12 | 28.6 | 5 |
| 060712 | 12.4 | 2.2 | 3.09 | 0.74 | 2.45 | 0.25 | 0.32 | 8.59 | 3.6 |
| 060719 | 15 | 0.91 | 5.93 | 1.2 | 2.77 | 0.27 | 0.33 | 11.5 | 5.6 |
| 060804 | 5.98 | 0.99 | 15.1 | 3.3 | 2.26 | 0.25 | 0.35 | 49.7 | 18 |
| 060807 | 8.48 | 1.1 | 9.29 | 1.3 | 2.43 | 0.19 | 0.21 | 26.2 | 7.3 |
| 060813 | 54.6 | 1.4 | 43.2 | 11 | 2.16 | 0.33 | 0.36 | 154 | 61 |
| 060814 | 146 | 2.4 | 31.4 | 3.2 | 2.21 | 0.11 | 0.12 | 107 | 16 |
| 060923A | 8.69 | 1.3 | 5.44 | 1 | 2.07 | 0.19 | 0.28 | 20.5 | 5.6 |
| 060923C | 15.8 | 2.2 | 4.05 | 1 | 2.72 | 0.4 | 0.5 | 8.34 | 5.7 |
| 061004 | 5.66 | 0.31 | 2.06 | 0.67 | 2.4 | 0.53 | 0.67 | 6.04 | 4.2 |
| 061019 | 25.9 | 4 | 12.8 | 3 | 2.05 | 0.38 | 0.45 | 49 | 19 |
| 061222A | 79.9 | 1.6 | 158 | 13 | 2.09 | 0.095 | 0.099 | 587 | 68 |
| 070103 | 3.38 | 0.46 | 0.951 | 0.21 | 2.06 | 0.27 | 0.29 | 3.62 | 1.1 |
| 070107 | 51.7 | 2.6 | 58 | 5.7 | 2.2 | 0.14 | 0.14 | 200 | 33 |
| 070129 | 29.8 | 2.7 | 16.5 | 4.6 | 2.14 | 0.22 | 0.25 | 59.5 | 22 |
| 070208 | 4.45 | 1 | 2.92 | 0.89 | 2.46 | 0.43 | 0.54 | 8.01 | 5.1 |
| 070220 | 104 | 2.3 | 7.26 | 1.5 | 1.7 | 0.23 | 0.27 | 32.2 | 7.7 |
| 070223 | 17 | 1.2 | 4.02 | 1.2 | 1.9 | 0.65 | 0.95 | 16.6 | 7.9 |
| 070306 | 53.8 | 2.9 | 77.8 | 11 | 2.18 | 0.16 | 0.18 | 273 | 60 |
| 070318 | 24.8 | 1.1 | 12.8 | 1.9 | 2.33 | 0.17 | 0.19 | 40 | 9.9 |
| 070328 | 90.6 | 1.8 | 45.6 | 5.5 | 2.03 | 0.14 | 0.16 | 176 | 30 |
| 070330 | 1.83 | 0.31 | 4.62 | 1.2 | 2.37 | 0.41 | 0.54 | 13.9 | 7.7 |
| 070420 | 140 | 4.5 | 53.9 | 5.2 | 2.04 | 0.16 | 0.17 | 207 | 32 |
| 070521 | 80.1 | 1.8 | 21.1 | 2.8 | 1.98 | 0.18 | 0.2 | 84 | 16 |
| 070529 | 25.7 | 2.4 | 3.73 | 0.87 | 2.18 | 0.26 | 0.4 | 13.1 | 4.9 |
| 070611 | 3.91 | 0.57 | 2.06 | 0.59 | 1.95 | 0.29 | 0.35 | 8.31 | 3.1 |
| 070616 | 192 | 3.5 | 8.41 | 1.6 | 2.49 | 0.24 | 0.3 | 22.3 | 8.7 |
| 070621 | 43. | 1. | 7.85 | 1.4 | 2.63 | 0.29 | 0.33 | 17.8 | 8.2 |
| 070704 | 59. | 3. | 6.69 | 1.8 | 1.97 | 0.35 | 0.58 | 26.7 | 11 |
| 070714A | 1.5 | 0.2 | 1.53 | 0.53 | 2.42 | 0.73 | 0.95 | 4.36 | 3.8 |
| 070721A | 0.71 | 0.18 | 1.43 | 0.45 | 2.65 | 0.39 | 0.39 | 3.17 | 2.1 |
| 070721B | 36. | 2. | 3.5 | 0.72 | 1.88 | 0.18 | 0.17 | 14.6 | 3.7 |
| (1) | (2) | (3) | (4) | (5) | (6) | (7) |
|---|---|---|---|---|---|---|
| Data Set | Number of | AaaFit with the function | BaaFit with the function | Correlation | Null | Fraction of |
| Data | Coefficient | Hypothesis | variability | |||
| Points | ProbabilitybbThe significance of the correlation is . | due to | ||||
| correlationbbThe significance of the correlation is . | ||||||
| Long GRBs: | ||||||
| Optical () vs X-ray () | 37 | 0.006 | 0.19 | |||
| Short GRBs: | ||||||
| Optical () vs X-ray () | 6 | 0.68 | 0.00 | |||
| Long GRBs: | ||||||
| X-ray () vs -ray () | 111 | 0.28 | ||||
| Short GRBs: | ||||||
| X-ray () vs -ray () | 10 | 0.31 | 0.12 | |||
| Long GRBs: | ||||||
| Fluence () vs Peak Flux () | 218 | 0.44 | ||||
| Short GRBs: | ||||||
| Fluence () vs Peak Flux () | 17 | 0.71 |