Exploring the limits of single emitter detection in fluorescence and extinction
Abstract
We present an experimental comparison and a theoretical analysis of the signal-to-noise ratios in fluorescence and extinction spectroscopy of a single emitter. We show that extinction measurements can be advantageous if the emitter is weakly excited. Furthermore, we discuss the potential of this method for the detection and spectroscopy of weakly emitting systems such as rare earth ions.
The progress of nanoscience and technology in the past two decades has been accompanied by a growing interest in the optical study of single nano-objects Kulzer:04 . A major thrust in this research area came from cryogenic spectroscopy Moerner:89 ; Orrit:90 as well as room temperature detection Shera:90 and microscopy Betzig:93 ; Nie:94 of dye molecules. Although a fluorescent atom suspended in vacuum can be seen even by the naked eye, achieving a high signal-to-noise ratio (SNR) in the detection of single molecules is a nontrivial task in the condensed phase. In particular, the background light and noise associated with the fluorescence or scattering from the environment can easily dominate the small signal of a single emitter. Furthermore, the dark counts and noise of photodetectors put a limit on the lowest signals that one might hope to detect.
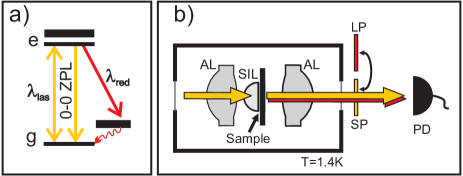
As shown in Fig. 1a, the level scheme of a fluorescent molecule consists of vibrational manifolds in the electronic ground () and excited () states. For an appropriate combination of an emitter and its surrounding matrix, the linewidth of the so-called zero-phonon line (ZPL) of the 0-0 transition between the vibrational ground states of and can become lifetime limited at cryogenic temperatures, thus enhancing the emitter’s absorption cross section SMbook . A very successful method for detecting a single molecule with a narrow 0-0 ZPL has been fluorescence excitation spectroscopy Orrit:90 where the red-shifted incoherent fluorescence of the molecule at wavelength is separated from the light at the laser wavelength by using high quality spectral filters. The SNR of this technique is determined on the one hand by the detector noise, which can be as low as 20-100 counts per second (cps) for very good avalanche photodiode single photon counters. On the other hand, saturation limits the maximum attainable signal to typical values of cps on the detector for a good dye molecule. Thus, fluorescence excitation spectroscopy can enjoy a very healthy SNR when applied to strongly fluorescent systems. Detection of very weak emitters, however, remains a challenge. In particular, fluorescence detection of single rare earth ions has been hampered owing to their long lifetimes and therefore ultra weak fluorescence.
An alternative approach to the detection of single solid-state emitters is to go back to the first method that was applied in single molecule spectroscopy Moerner:89 , namely to detect the extinction of the laser light caused by a single molecule in its path. This method was successfully revived by Plakhotnik and Palm in 2001 Plakhotnik:01 where the coherent scattering of the excitation light was interfered with the residual reflections from the interfaces in the setup. Closely related efforts followed on quantum dots, especially with the aim of acquiring access to the linewidth of the main optical transition in these systems Guest:02 ; Alen:03 . Recently, we have extended this approach to detect the extinction of a laser beam by a single molecule in transmission without the need for any noise suppression technique Gerhardt:07a ; Gerhardt:07b ; Wrigge:08 . In this paper, we compare the conventional fluorescence excitation technique with extinction measurements in terms of the SNR and discuss the potential of the latter for detecting emitters with very weak optical transitions.
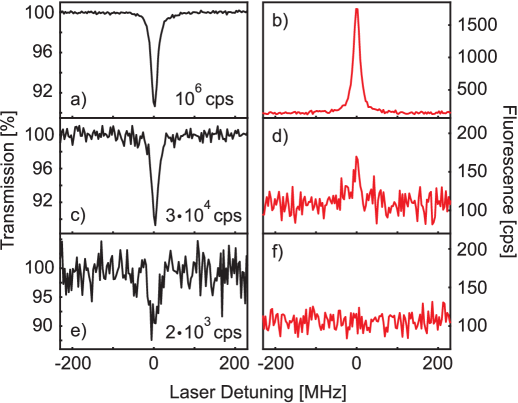
The experimental arrangement of our discussion is depicted in Fig. 1b, and its details are described in Refs. Gerhardt:07a ; Wrigge:08 . Briefly, the excitation laser light was focused onto the sample consisting of DBATT molecules embedded in a n-tetradecane matrix inside a cryostat. For this we used an aspheric lens with a numerical aperture of and a cubic zirconia hemispherical solid immersion lens (SIL). After interaction with the sample, a second aspheric lens collimates the beam and directs it to an avalanche photodiode (PD). Two different filter sets are used to either reject and detect or vice versa. The former arrangement delivers a fluorescence excitation spectrum while the latter allows a direct resonant measurement. Fig. 2 shows examples of fluorescence and extinction spectra recorded from the same single molecule and on the same detector at three different incident powers. In this article we adopt the unit of counts per second (cps) for power. When the detected laser power reads cps on PD (corresponding to an excitation regime well below saturation) both extinction (a) and fluorescence (b) yield comparable SNR of . For a detected laser power of cps, the fluorescence of the molecule is hardly above the detector dark count rate of 100 cps. However, the extinction is still easily observable at 10% visibility. Even at an ultra-low illumination level of cps the extinction signal succeeds in detecting the molecule whereas the fluorescence peak is fully buried under the detector noise.
Assuming a perfect transmission channel and detector, the power on PD in the absence of any spectral filter is given in cps by
| (1) | |||||
where and represent the electric fields associated with the laser and the molecular emission at the detector, respectively, and is the frequency of the emitted photon. denotes the solid angle of light collection and is assumed to cover all the transmitted laser light. The molecular emission consists of a part that originates from the 0-0 ZPL transition and is resonant with the laser light and a red-shifted component which results from molecular and lattice vibronic transitions. The electric field associated with the coherent part of the resonance fluorescence Wrigge:08 ; cohen-book gives rise to a nonzero third term of Eq. (1), signifying the interference between the molecular emission and the laser beam. This component, which is known as the “extinction” term Jackson-book is equivalent to a homodyne signal where the excitation laser beam acts as the local oscillator Haus-new ; Yuen:90 .
It is helpful for the following discussion to write the terms of Eq. (1) in an explicit manner:
| (2) |
The quantity gives the total power emitted by the molecule into the solid angle. is the population of the excited state, and the on-resonance saturation parameter S reads cohen-book
| (3) |
where is the Rabi frequency defined by . The transition dipole moment and the incident electric field at position of the molecule are assumed to be parallel for simplicity. The factor describes the ratio of the power emitted on the 0-0 ZPL to the total excited state emission. Thus, where denotes the dipole moment associated with the total spontaneous emission rate of the excited state given by . represents the transverse decay rate which equals in the absence of any dephasing. The parameter signifies the fraction of the total emitted molecular power to that collected into the detection solid angle . We note that in addition, one might have to account for total internal reflection and waveguiding in the substrate which influence the angular distribution of the laser light and the molecular emission Gerhardt:07a . Finally, the quantities and represent the portions of the molecular emission into the solid angle that are resonant with the excitation laser and red shifted from it, respectively.
It is now instructive to separate the properties of the laser beam from the spectroscopic features of the emitter. Using the definitions of and , one can rearrange the saturation parameter in Eq. (3) to read
| (4) |
where is a unitless geometrical factor that relates to the laser power . More precisely, denotes the ratio of the total power scattered by a weakly excited two-level system and the incident power. It depends on the spatial mode of the laser beam and the focusing optics. The reader is referred to Ref. Zumofen:08 for details.
The expressions in Eq. (Exploring the limits of single emitter detection in fluorescence and extinction) provide us with the red shifted fluorescence . The noise on this signal is given by the fluctuations in the detector dark counts if we assume that the excitation light is completely rejected by the filters. Thus, the SNR for a fluorescence excitation measurement becomes
| (5) |
where we have introduced to account for losses (e.g. cryostat windows, filters, etc.) and the detector efficiency. The SNR maximum is given by and occurs in the fully saturated regime.
Considering that the solid angle collects all the incident laser light, a simple energy balance argument implies that in Eq. (1) must correspond to the total power emitted by the molecule. Now we insert a spectral filter to select only the part of the transmitted light that is resonant with the laser light. Denoting the size of the dip in the power that is detected in this case by , Eq. (1) and Eqs. (Exploring the limits of single emitter detection in fluorescence and extinction) yield,
| (6) |
The noise on a resonant extinction measurement is composed of the shot noise of the laser power, the laser intensity fluctuations where is a proportionality constant, and . Since these contributions are statistically independent, the total noise can be written as , where again, accounts for losses and the detection efficiency. Assuming that intensity fluctuations have been mastered at a sufficient level and that , one finds . Thus, the signal-to-noise ratio for an extinction measurement becomes
| (7) |
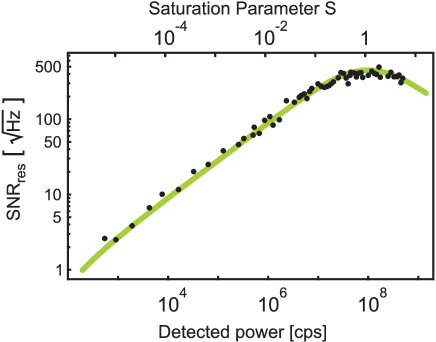
Fig. 3 presents as a function of the detected laser power and of the saturation parameter . In each case, was directly derived from the power broadened linewidth of the fluorescence excitation spectrum. Our system could perform at the shot-noise limit down to the sub Hertz bandwidth over the whole power range presented here. The green theoretical fit curve is obtained using Eq. (7). With the parameters that have been independently determined for our setup (, =0.5, , ), an excellent agreement with the measured data is achieved. The deterioration of under very strong excitation is clearly visible and stems from the fact that for a quantum emitter, saturates at high incident powers. The maximal attainable SNR in a shot-noise limited resonant detection then becomes and occurs at S=1 if we assume .
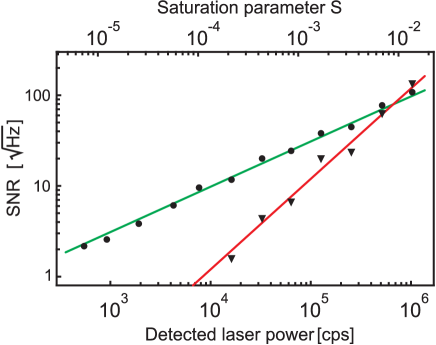
To compare the SNR of fluorescence and extinction measurements directly, we have recorded spectra such as those shown in Fig. 2 for low excitation powers corresponding to to as shown in Fig. 4. The circles and the triangles display the SNR for the extinction and fluorescence detections, respectively. To determine the experimental SNR, we first fitted the spectra with Lorentzian functions. Then we extracted the on-resonant signal and divided it by the off-resonant rms noise. The data were recorded by adding 100 scans with 10 ms integration time, corresponding to a total acquisition time of 1 second per frequency pixel. This procedure helped to correct for possible laser drifts and spectral diffusion of the molecule. The fitted green and red theoretical curves depend on and , respectively (see Eqs. (5) and (7)) and show a very good agreement with the experimental data. We conclude that in case of a weakly excited system, an extinction measurement can be superior to fluorescence detection in terms of SNR. We point out in passing that both and scale as the square root of the integration time and thus, the comparison between the fluorescence and extinction methods holds for fast and slow measurements alike.
We remark that in the existing literature, the root-mean-square (rms) fluctuation of the signal itself has been often included as a noise source in fluorescence but ignored in extinction measurements moerner06 ; plakhotnik:02 . In our comparison of the two methods, we have consistently chosen to define the signal as the response of the system of interest, namely a single emitter, and the noise as all fluctuations stemming from other sources. Therefore, we do not include the signal rms noise in our analysis of SNR. This strategy is particularly convenient for the evaluation of SNR from single spectra.
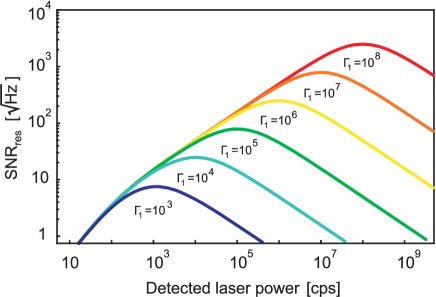
An exciting question that arises is whether extinction detection opens doors for studying weakly fluorescent nano-objects. Conventional single molecule detection has been successful for molecules that have fluorescence lifetimes of a few nanoseconds, corresponding to . Such a high photon flux provides a good SNR even considering realistic collection plus detection efficiency of a few percent and cps. However, for weakly emitting systems such as rare earth ions with lifetimes of the order of milliseconds, becomes comparable or smaller than unity. Fig. 5 displays the expected as a function of the detected laser power for various radiative decay rates . Here we have assumed a laboratory value of , , , and , but extension of the results to other situations is straightforward by following Eq. (7). These plots indicate that single emitters with spontaneous emission times as long as a millisecond should be detectable using extinction spectroscopy even when realistic detection parameters (e.g. are considered. In addition, we emphasize that extinction measurements have the great added value that they provide direct access to the coherent interaction of the incident light and the emitter.
Although the basic concepts discussed in this paper have been known in signal processing and electrical engineering Haus-new , their direct experimental investigations at the single emitter level have been made possible through advances in cryogenic spectroscopy Plakhotnik:01 ; Wrigge:08 ; Vamivakas:07 . Inspired by this progress, very recently we have also succeeded in extinction detection of a single solid-state quantum emitter at room temperature Kukura:08 despite the fact that the extinction cross section is reduced by 5-6 orders of magnitude due to severe broadening of the transition (). Another interesting application of extinction or homodyne detection has been demonstrated almost independently for imaging small metallic and dielectric nanoparticles Mikhailovsky:03 ; Lindfors:04 ; Arbouet:04 ; Jacobsen:06 ; Ignatovich:06 ; Ewers:07 . Conventional methods of nanoparticle detection such as dark-field Schultz:00 or total internal reflection Soennichsen:00 microscopy rely on the elimination of the incident light from the detection path and the detection of the power scattered by the particles. To this end, these techniques are analogous to fluorescence excitation spectroscopy where frequency spectra are replaced by spatial images, and spatial filtering substitutes spectral filtering for the discrimination of the incident laser light. However, in practice the two systems are limited in different ways because in the case of spatial imaging, the persistent source of ”noise” is the light scattered from residual optical roughness of the medium Jacobsen:06 . The equivalent of this problem usually does not arise in extinction detection of emitters because they are typically embedded in well-behaved matrices Kulzer:04 ; Moerner:89 without any optical transitions in the spectral region of interest.
In conclusion, we have explored the signal-to-noise ratio in the spectroscopic detection of single emitters. We have provided expressions for evaluating the performance of both fluorescence and extinction measurements. In particular, we have demonstrated that extinction measurements can be superior to fluorescence detection in the weak excitation regime. Furthermore, we have shown that even weakly fluorescent emitters should be detectable using coherent extinction spectroscopy. This prospect is especially interesting for the optical storage and read out of quantum information in new systems such as rare earth ions.
Acknowledgments
This work was supported by the Swiss National Foundation (SNF).
References
- (1) F. Kulzer and M. Orrit, “Single-Molecule Optics,” Ann. Rev. Phys. Chem. 55, 585–611 (2004), http://dx.doi.org/10.1146/annurev.physchem.54.011002.103816.
- (2) W. E. Moerner and L. Kador, “Optical Detection and Spectroscopy of Single Molecules in a Solid,” Phys. Rev. Lett. 62, 2535–2538 (1989), http://link.aps.org/abstract/PRL/v62/p2535.
- (3) M. Orrit and J. Bernard, “Single pentacene molecules detected by fluorescence excitation in a p-terphenyl crystal,” Phys. Rev. Lett. 65(21), 2716–2719 (1990), http://link.aps.org/abstract/PRL/v65/p2716.
- (4) E. Shera, N. Seitzinger, L. Davis, R. Keller, and S. Soper, “Detection of single fluorescent molecules,” Chem.Phys.Lett. 174, 553–557 (1990), http://dx.doi.org/10.1016/0009-2614(90)85485-U.
- (5) E. Betzig and R. J. Chichester, “Single Molecules Observed by Near-Field Scanning Optical Microscopy,” Science 262, 1422–1425 (1993), http://dx.doi.org/10.1126/science.262.5138.1422.
- (6) S. Nie, D. T. Chiu, and R. N. Zare, “Probing Individual Molecules with Confocal Fluorescence Microscopy,” Science 266, 1018–1021 (1994), http://dx.doi.org/10.1126/science.7973650.
- (7) T. Basche, W. E. Moerner, M. Orrit, and U. Wild, Single Molecule Spectroscopy (John Wiley and Sons, 1999).
- (8) T. Plakhotnik and V. Palm, “Interferometric Signatures of Single Molecules,” Phys. Rev. Lett. 87, 183,602 (2001), http://link.aps.org/abstract/PRL/v87/e183602.
- (9) J. R. Guest, T. H. Stievater, X. Li, J. Cheng, D. G. Steel, D. Gammon, D. S. Katzer, D. Park, C. Ell, A. Thränhardt, G. Khitrova, and H. M. Gibbs, “Measurement of optical absorption by a single quantum dot exciton,” Phys. Rev. B. 65, 241,310(R) (2002), http://link.aps.org/abstract/PRB/v65/e241310.
- (10) B. Alen, F. Bickel, K. Karrai, R. J. Warburton, and P. M. Petroff, “Stark-shift modulation absorption spectroscopy of single quantum dots,” Appl. Phys. Lett. 83, 2235–2237 (2003), http://link.aip.org/link/?APPLAB/83/2235/1.
- (11) I. Gerhardt, G. Wrigge, P. Bushev, G. Zumofen, M. Agio, R. Pfab, and V. Sandoghdar, “Strong Extinction of a Laser Beam by a Single Molecule,” Phys. Rev. Lett. 98, 033,601 (2007), http://link.aps.org/abstract/PRL/v98/e033601.
- (12) I. Gerhardt, G. Wrigge, M. Agio, P. Bushev, G. Zumofen, and V. Sandoghdar, “Scanning Near-Field Optical Coherent Spectroscopy of Single Molecules at 1.4 Kelvin,” Opt. Lett. 32, 1420–1422 (2007), http://dx.doi.org/10.1364/OL.32.001420.
- (13) G. Wrigge, I. Gerhardt, J. Hwang, G. Zumofen, and V. Sandoghdar, “Efficient coupling of photons to a single molecule and the observation of its resonance fluorescence,” Nature Phys. 4, 60–66 (2008), http://dx.doi.org/10.1038/nphys812.
- (14) C. Cohen-Tannoudji, J. Dupont-Roc, and G. Grynberg, Atom-Photon Interactions (John Wiley & Sons, Inc., 1992).
- (15) D. Jackson, Classical Electrodynamics (Wiley and Sons, 1999).
- (16) H. A. Haus, Electromagnetic Noise and Quantum Optical Measurements (Springer-Verlag, Heidelberg, 2000).
- (17) H. P. Yuen and V. W. S. Chan, “Noise in homodyne and heterodyne detection,” Opt. Lett. 8, 177 (1983), http://ol.osa.org/abstract.cfm?URI=ol-8-3-177.
- (18) G. Zumofen, N. M. Mojarad, V. Sandoghdar, and M. Agio, “Perfect Reflection of Light by an Oscillating Dipole,” submitted, http://arxiv.org/abs/0805.3231v2 (2008).
- (19) W. E. Moerner, “Examining Nanoenvironments in Solids on the Scale of a Single, Isolated Impurity Molecule,” Science 265, 46–53 (1994), http://dx.doi.org/10.1126/science.265.5168.46.
- (20) T. Plakhotnik, “Absorption and coherent emission of single molecules,” J. Lum. 98, 57–62 (2002), http://dx.doi.org/10.1016/S0022-2313(02)00252-1.
- (21) A. N. Vamivakas, M. Atatüre, J. Dreiser, S. T. Yilmaz, A. Badolato, A. K. Swan, B. B. Goldberg, A. Imamoglu, and M. S. Ünlü, “Strong extinction of a far-field laser beam by a single quantum dot,” Nano Letters 7, 2892–2896 (2007), http://dx.doi.org/10.1021/nl0717255.
- (22) P. Kukura, M. Celebrano, A. Renn, and V. Sandoghdar, “Extinction imaging of a single quantum emitter in its bright and dark states,” submitted, http://arxiv.org/abs/0802.1206 (2008).
- (23) A. A. Mikhailovsky, M. A. Petruska, M. I. Stockman, and V. I. Klimov, “Broadband near-field interference spectroscopy of metal nanoparticles using a femtosecond white-light continuum,” Opt. Lett. 28, 1686–1688 (2003), http://dx.doi.org/10.1364/OL.28.001686.
- (24) K. Lindfors, T. Kalkbrenner, P. Stoller, and V. Sandoghdar, “Detection and spectroscopy of gold nanoparticle using supercontinuum white light confocal microscopy,” Phys. Rev. Lett. 93, 037,401–1 (2004), http://link.aps.org/abstract/PRL/v93/e037401.
- (25) A. Arbouet, D. Christofilos, N. D. Fatti, F. Vallée, J. R. Huntzinger, L. Arnaud, P. Billaud, and M. Broyer, “Direct measurement of the single-metal-cluster optical absorption,” Phys. Rev. Lett. 93, 127,401 (2004), http://link.aps.org/abstract/PRL/v93/e127401.
- (26) V. Jacobsen, P. Stoller, C. Brunner, V. Vogel, and V. Sandoghdar, “Interferometric optical detection and tracking of very small gold nanoparticles at a water-glass interface,” Opt. Express 14, 405–414 (2006), http://dx.doi.org/10.1364/OPEX.14.000405.
- (27) F. V. Ignatovich and L. Novotny, “Real-Time and Background-Free Detection of Nanoscale Particles,” Phys. Rev. Lett. 96, 013,901 (2006), http://link.aps.org/abstract/PRL/v96/e013901.
- (28) H. Ewers, V. Jacobsen, E. Klotzsch, A. E. Smith, A. Helenius, and V. Sandoghdar, “Label-free Optical Detection and Tracking of Single Virions Bound to their Receptor in Supported Membrane Bilayers,” Nano Lett. 7, 2263–2266 (2007), http://dx.doi.org/10.1021/nl070766y.
- (29) S. Schultz, D. R. Smith, J. J. Mock, and D. A. Schultz, “Single-target molecule detection with nonbleaching multicolor optical immunolabels,” PNAS 97(3), 996–1001 (2000), http://www.pnas.org/content/97/3/996.abstract.
- (30) C. Sönnichsen, S. Geier, N. E. Hecker, G. von Plessen, J. Feldmann, H. Ditlbacher, B. Lamprecht, J. R. Krenn, F. R. Aussenegg, V. Z.-H. Chan, J. P. Spatz, and M. Möller, “Spectroscopy of single metallic nanoparticles using total internal reflection microscopy,” Appl. Phys. Lett. 77(19), 2949–2951 (2000), http://link.aip.org/link/?APPLAB/77/2949/1.