Suzaku Observations of Four Heavily Absorbed HMXBs
Abstract
We report on Suzaku observations of four unidentified sources from the INTEGRAL and Swift BAT Galactic plane surveys. All the sources have a large neutral hydrogen column density and are likely members of an emerging class of heavily absorbed high mass X-ray binary (HMXB) first identified in INTEGRAL observations. Two of the sources in our sample are approximately constant flux sources, one source shows periodic variation and one source exhibited a short, bright X-ray outburst. The periodicity is transient, suggesting it is produced by a neutron star in an elliptical orbit around a stellar wind source. We analyze the flaring source in several segments to look for spectral variation and discuss the implications of the findings for the nature of the source. We conclude that all four sources in our sample can be identified with the emerging class of highly absorbed HMXBs, that one is a newly identified transient X-ray pulsar and that at least one is a newly identified supergiant fast X-ray transient (SFXT).
1 Introduction
With its first observation, INTEGRAL (Winkler et al.,, 2003) began a collection of highly absorbed sources, some of which may represent a new class of binary (see Kuulkers, (2005) for a review; K05 hereafter). IGRJ16318-4848 was a bright X-ray source with extreme absorption that would later be shown to have bright X-ray emission lines. Since then, the INTEGRAL Galactic plane survey has discovered several more similar sources, suggesting that these objects form a new class of X-ray binary, characterized by high absorption columns, slow spin periods and occasional bright X-ray outbursts. The first INTEGRAL catalog (Bird et al.,, 2004) notes 28 unidentified sources from the INTEGRAL Galactic plane survey, ten of which have been followed up at X-ray and optical wavelengths and have been shown to belong to this new source class.
Nearly simultaneously to the discovery of this potentially new class of source by INTEGRAL, the Swift BAT Galactic plane survey began to uncover many new sources from its own survey. It was speculated, due to their absence from previous soft X-ray surveys, that some of these sources may be highly absorbed binaries, possibly members of the new class of INTEGRAL binaries.
Several objects identified in the first INTEGRAL catalog, as of Fall 2006, remained without significant follow-up in the X-ray or at other wavelengths. During the Suzaku cycle 1 call for proposals, we proposed to follow-up three INTEGRAL detected sources that were suspected to be members of the new class but had yet to be studied in detail. We proposed, furthermore, to observe two newly identified sources from the BAT Galactic plane survey to determine whether they were also members of this new source class.
In this paper, we detail the analysis of the Suzaku data collected on these sources, discuss the likelihood that these sources are similar to the originally discovered IGR sources and briefly discuss the possible nature of the new class. The paper is organized as follows: in §2 we describe the observations and data analysis; in §3 we present our results; in §4 we discuss the similarity of each source and the propriety of calling each a member of the IGR source class and discuss the potential nature of these sources; in §5 we summarize our results and conclusions.
2 Observations and Data Reduction
Observations of the five targets, three INTEGRAL sources and two additional sources from the BAT Galactic plane survey, were conducted between April 12 and October 31, 2006 (see Table 1). On four of the five targets, a single observation was collected while on one source two observations were collected, separated by 6 months. All sources were observed using the HXD aimpoint and with the XIS instruments in normal imaging mode. One of the sources (SWJ1010.1-5747) was found to be a symbiotic star and these observations were published in Smith et al., (2008); this source will not be discussed further here.
Data from the four other targets were reduced using the standard Suzaku processing software, xisrmfgen version 2007-05-14 and xissimarfgen version 2007-09-22 and the other standard analysis tools contained in HEADAS version 6.4. Point source processing was carried out as described in the Suzaku ABC Data Reduction Guide 111http://heasarc.gsfc.nasa.gov/docs/suzaku/analysis/abc. In processing the data from the HXD instrument, which is a non-focused instrument, it was discovered that the observation of IGRJ16465-4507 was contaminated by the nearby bright X-ray source GX340+0. As a result the HXD instrument data for this source have not been used. The HXD data of the other sources were checked for contamination by nearby bright sources but none was found.
Data from the XIS0, XIS2 and XIS3 front illuminated instruments were combined together while data from the XIS1 back illuminated instrument were kept separate. Data from the combined front illuminated instruments, from the back illuminated instrument and from the HXD PIN (except in the case of IGRJ16465-4507) were then fit simultaneously in XSPEC (version 12.4.0). Data from the XIS instruments were binned to have a minimum of 50 events per bin. Data from the HXD instruments were binned to have a minimum of 100 events per bin.
The Xronos timing analysis software version 5.21 was used to search for periodicity in the data. In cases where significant temporal structure was found in the data (either periodicity or transient outbursts), time-separated spectral analysis was done to search for spectral variation.
| Obsnum | Source | observation start | observation stop | XIS t | HXD PIN t |
|---|---|---|---|---|---|
| (s) | (s) | ||||
| 401052010 | IGRJ16465-4507 | 2006-09-09-09:12:56 | 2006-09-09-22:05:14 | 14536 | 24645 |
| 401053010 | SWJ2000.6+3210 | 2006-04-12-15:53:10 | 2006-04-12-21:56:04 | 12444 | 9877 |
| 401053020 | SWJ2000.6+3210 | 2006-10-31-00:29:37 | 2006-10-31-07:16:19 | 10146 | 11727 |
| 401054010 | IGRJ16493-4348 | 2006-10-05-21:10:30 | 2006-10-06-10:05:24 | 18975 | 20220 |
| 401055010 | SWJ1010.1-5747 | 2006-06-05-05:13:12 | 2006-06-05-18:25:25 | 19171 | 20000 |
| 401056010 | IGRJ16195-4945 | 2006-09-20-20:25:12 | 2006-09-21-17:21:20 | 27908 | 42265 |
3 Results
Two of the sources in our sample show only random temporal variability while two of the sources show important temporal and spectral variations that warrant further discussion. We begin this section with an overview of the characteristics of each source, considering the observation as a whole, and the global characteristics of the sample. We will then focus, in turn, on each of the two sources whose data are worthy of more detailed analysis.
3.1 Global fitting
In some cases, fitting a simple absorbed powerlaw model produces a fit with 1, but in all cases a partial covering absorber model is strongly preferred (see Table 2). The partial covering model is invoked here for its ability to quantify interesting parameters from a wide range of geometries using a minimum of fit components. Assuming a dust halo subtending 4 steradians, for example, the partial covering model provides information about the scattering fraction and thus about the density of the halo. Assuming, instead, a geometry similar to accretion disk corona (ADC) systems, the partial covering model provides information about the vertical extent of the ADC and the scale height of the neutral disk material. While the precision of the observations discussed in this paper is too low to confidently distinguish between these different possible geometries, we adopt the use of the partial covering model here to lend our results to future discussion in this context.
The photon index () in the partial covering model, ranges from 1.8 to 2.4, the partial covering fraction (PCF) ranges from 0.5 to 0.8 and the column ranges from 11023 cm-2 to 11024 cm-2. These are similar to those seen previously in highly absorbed HMXBs (Kuulkers,, 2005). In one case, the column is slightly below 11023 cm-2 (though within errors; 91022 cm-2). We note that the HXD data for this target, IGRJ16465-4507, are contaminated by a field source and cannot be used. As a result, the high energy spectral slope for this source is not well constrained as it is for the others, probably leading to an unusually high value of the PCF compared to the other sources. The effect of the higher PCF is to suppress the soft X-ray flux which helps to explain the lower column in this source. If we assume a PCF and for this source similar to the other three sources in our sample (defined by the mean values of PCF=0.6 and =2.15 respectively) we find column values of 3.21022 cm-2 and 1.01023 cm-2 for the Galactic and local components respectively, similar to what is seen in the other three sources.
| Source | part | PCF | Flux | Fe EW | dof | ||||
|---|---|---|---|---|---|---|---|---|---|
| (1022cm-2)aaFully covered neutral hydrogen column | (1022cm-2)bbPartially covered neutral hydrogen column | ccPartial covering fraction | ddPhoton index | (10)eeFit range set to 0.2keV to 10 keV | eV | ffReduced of partial covering fit | ggReduced of simple absorbed powerlaw fit | hhdegrees of freedom in partial covering fit | |
| IGRJ16465-4507 | 2.0 | 7.3 | 0.82 | 2.19 | 8.95 | 135 | 0.859 | 0.994 | 270 |
| IGRJ16493-4348 | 8.6 | 26 | 0.62 | 2.37 | 13.5 | 84 | 0.902 | 1.09 | 389 |
| IGRJ16195-4945 | 11 | 78 | 0.53 | 1.80 | 16.1 | 43 | 0.934 | 0.999 | 614 |
| SWJ2000.6+3210(1) | 2.3 | 9.3 | 0.68 | 2.21 | 32.0 | 51 | 0.918 | 1.58 | 417 |
| SWJ2000.6+3210(2) | 2.1 | 8.2 | 0.70 | 2.01 | 55.0 | 71 | 0.897 | 1.66 | 725 |
All sources show variability on timescales of hundreds of seconds. Furthermore, IGRJ16195-4945 shows a bright outburst lasting 5000 s and SWJ2000.6+3210 shows periodic variations. We will return to discuss these two objects in greater detail shortly. Overall flux levels range from 110-11 to 510-11 ergs cm-2 s-1 (absorbed) in the 0.2-10 keV energy band.
As a check of consistency with previous work, we have compared the results of absorbed cutoff powerlaw fits of the three sources in our sample that were also fit to cutoff powerlaws by K05. Our best fit results for IGRJ16195-4945 match well. Our best fit results for IGRJ16493-4348 do not match those of K05, but if we fix to be similar to that found by K05, we find a column density similar to theirs and can additionally note a cutoff energy of 17.5 keV. Our best fit results of IGRJ16465-4507 do not match that of K05. Even after fixing and the cutoff energy to match that of K05, the column that we find is still more than an order of magnitude lower than that found by K05. As noted earlier, the observation of IGRJ16465-4507 suffered from high energy contamination, leaving us with data only form 0.2-10.0 keV. While this may account for some of the discrepancy between our results and K05, we also note that we see no evidence in our data of the 4 minute period noted by K05. This suggests that our data may be taken during the apoastron phase of an elliptical binary orbit when the flux level, spectrum and absorption column have different values than they do near periastron and where the higher wind density is likely to produce periodic variations as are reported in the K05 observation. Thus, it is not surprising that our observations of this source appear different. In general, however, our overall results appear consistent with those of K05.
Swift BAT data from the forthcoming 22-month survey (Tueller et al.,, 2008) have been analyzed for each of the sources in our sample except for IGRJ16465-4507 which is contaminated by the same nearby source which hampers the Suzaku HXD analysis. No evidence of outbursts on daylong timescales (similar to those seen in the Suzaku observation of IGRJ16915-4945, e.g.) are found. The BAT daily survey detection threshold is 5-10 mCrab (Markwardt et al.,, 2005), however, so the non-detection of the 100-500 Crab outbursts seen in our Suzaku data is not surprising. We have, furthermore, examined the BAT data binned over longer timescales (2, 4, 8, 16, 32 and 64 days) to improve the sensitivity of our variability search. While all sources show stochastic variability on these timescales, no evidence of periodicity is seen.
For the 3 sources with uncontaminated BAT data, we have made simultaneous fits with the Suzaku and BAT data. In the cases of IGRJ16493-4348 and SWJ2000.6+3210, the BAT data are well fit by the same model derived from fitting the Suzaku data alone. This implies that the snapshot captured in the Suzaku observations of these 2 sources is representative of the overall source behavior and shows that the partial covering scenario is supported to energies as high as 200keV. In the case of IGRJ16195-4945, the BAT data are not well fit to the same spectrum as the total Suzaku observation, nor to any of the segmented spectra shown in Table 5. Since the total Suzaku observation does not match the BAT data, we can infer that flares such as that seen in the Suzaku data do not dominate the flux from the source. Since the BAT data are also not well fit by the spectrum seen in the Suzaku quiescent data (the BAT data fit a softer spectrum than any segment of the Suzaku data and have a higher intensity than the quiescent segment but lower intensity than the Post-Flare segment), we can also infer that the quiescent state is not best representative of this source. Since the post-flare state is also a poor fit to the BAT data, we infer that the source spends more time in the quiescent state than is seen in the Suzaku observation, but that flares such as that seen in the Suzaku data are somewhat common (since the quiescent state does not match the BAT data). We will discuss this in further detail in §4.
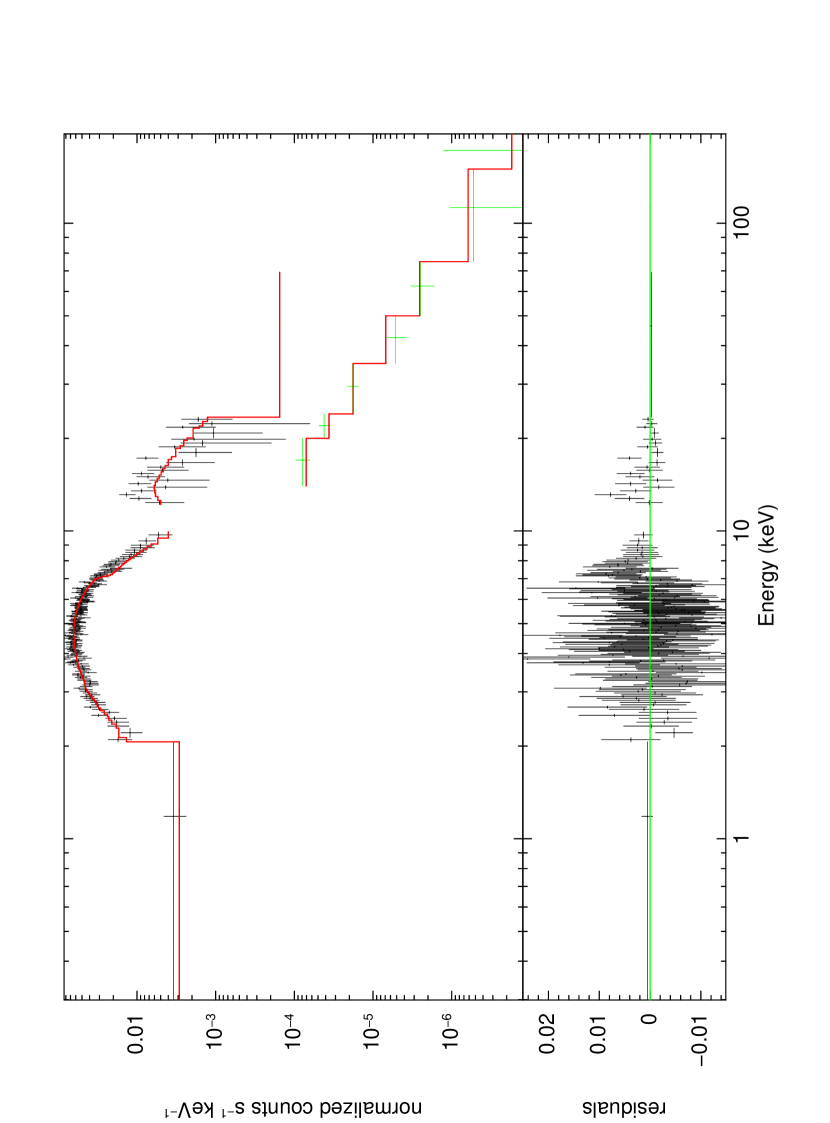
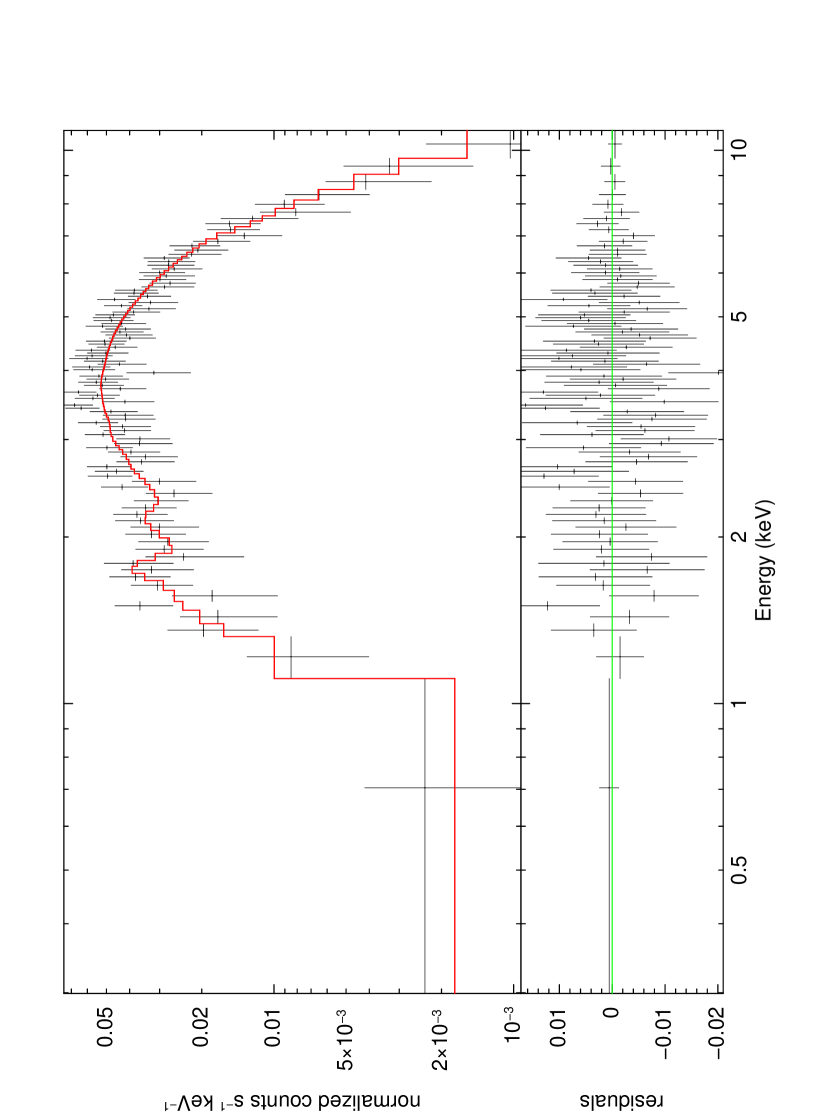
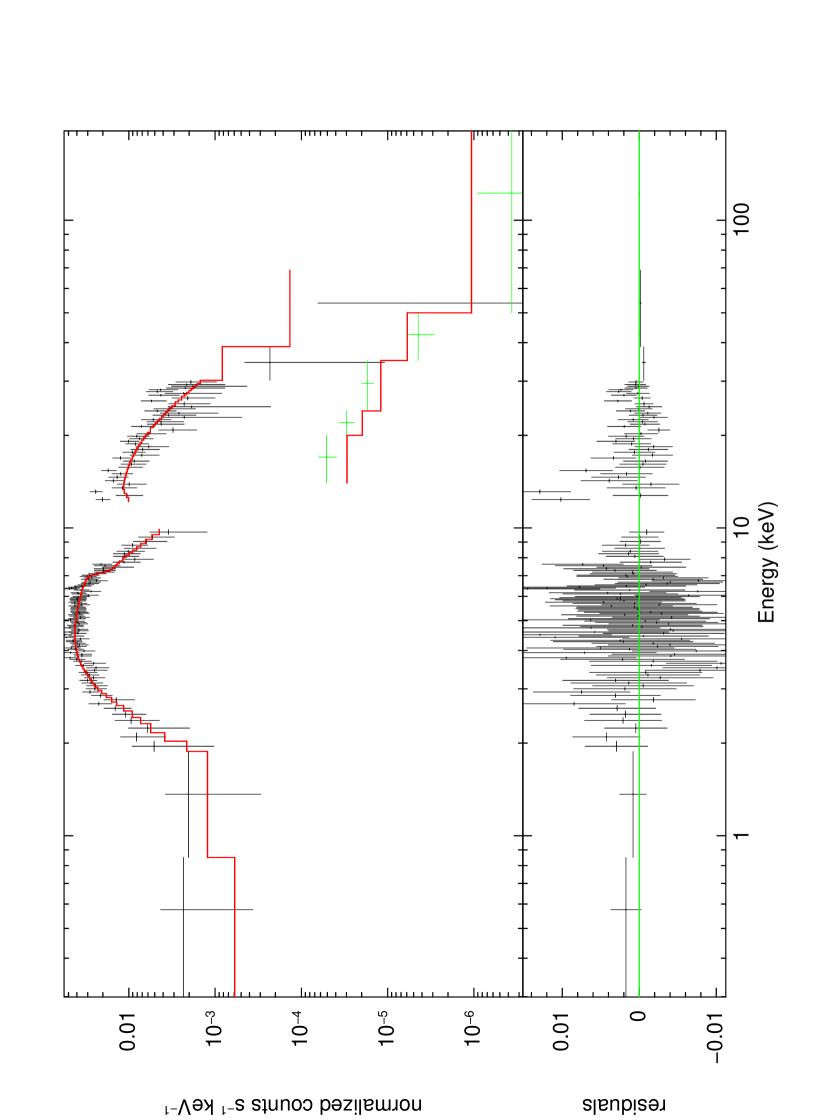
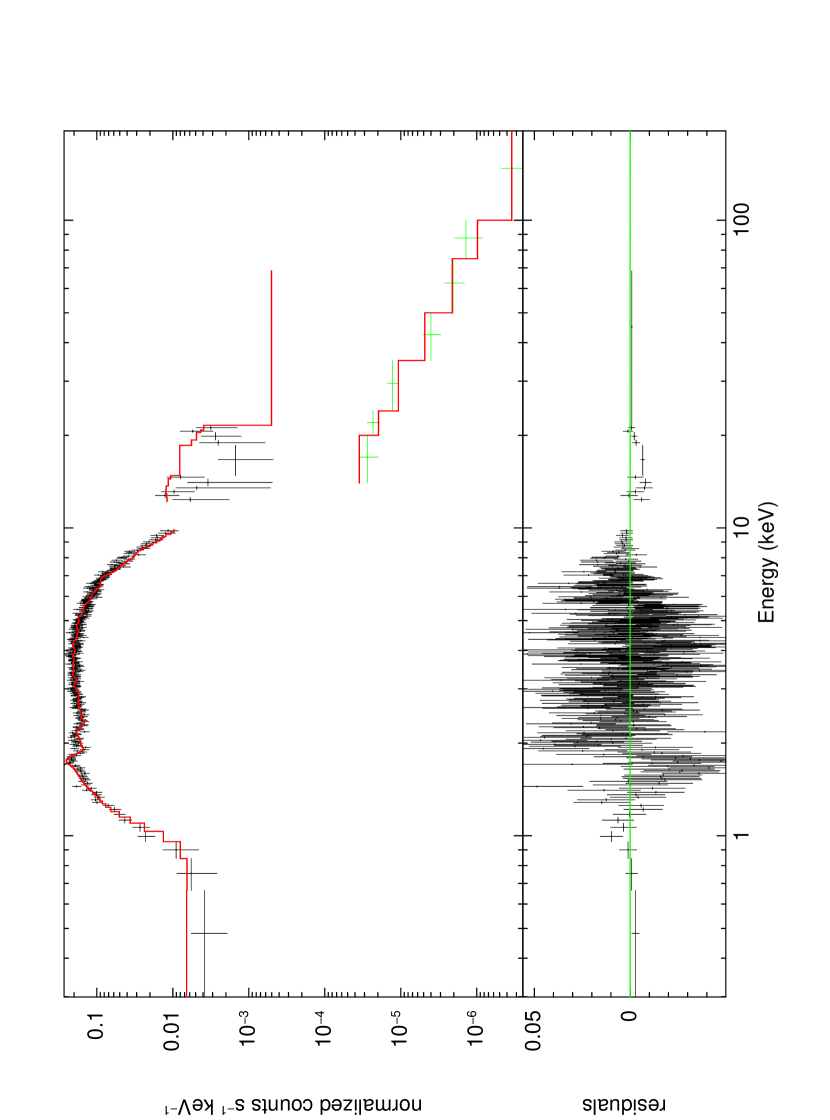
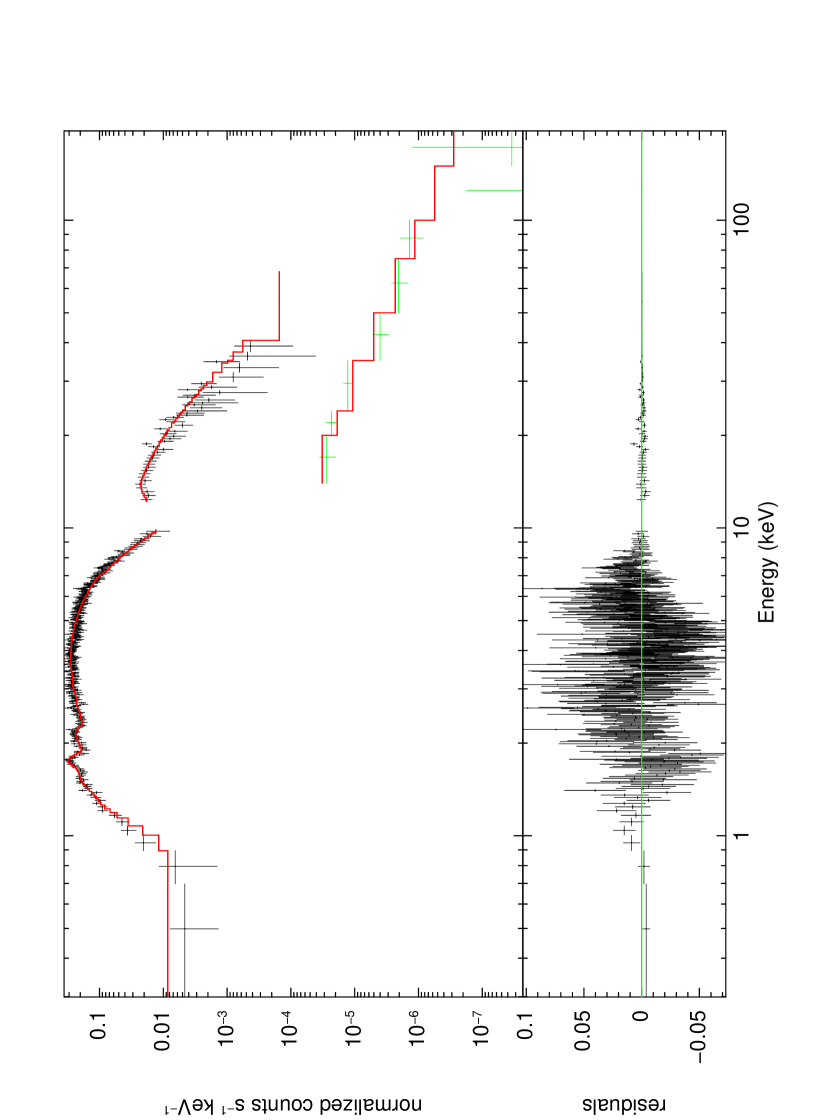
Spectra and lightcurves (in cases where the lightcurve shows noteworthy behavior) of each source are shown in Figures 1-5. In the spectral plots, black datapoints show Suzaku data while green datapoints show the average 22-month survey data for comparison. We note that the spectral fits detailed in Tables 2, 4 and 5 are derived using Suzaku data only.
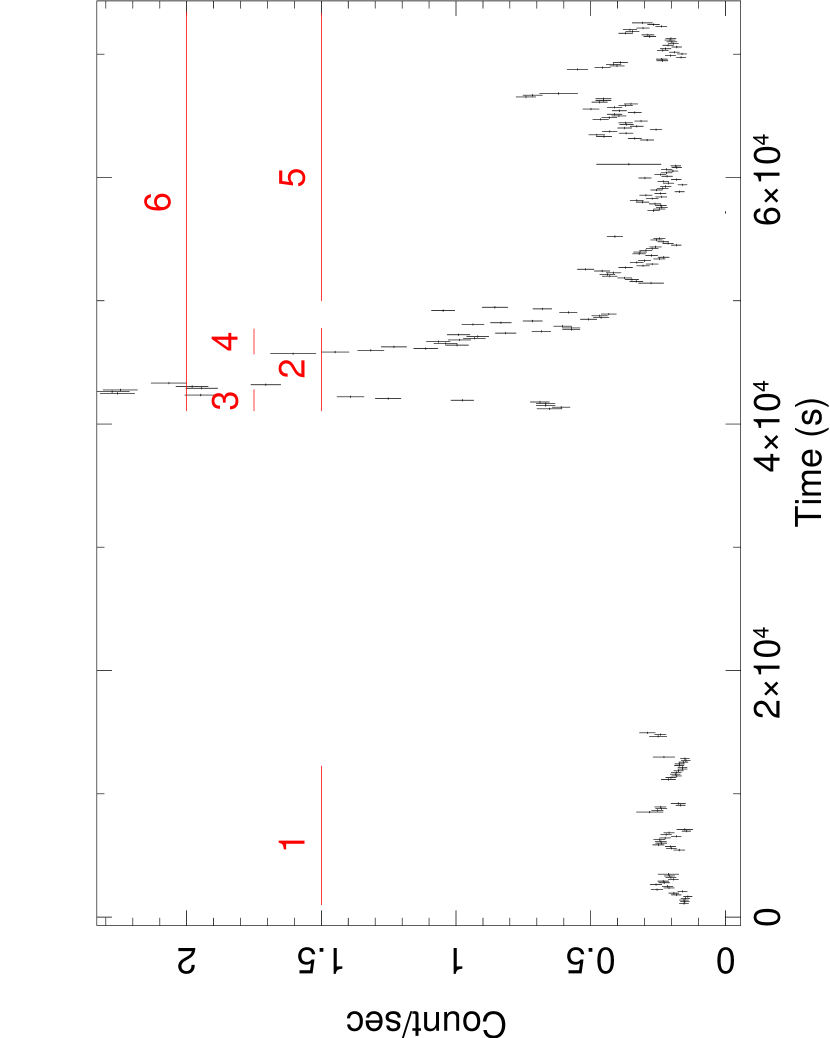
3.2 IGRJ16195-4945
The lightcurve of IGRJ16195-4945 is marked by a short, bright flare, seen in both the XIS and HXD instruments. The flare lasts for 5000 s and reaches a peak flux level 10 brighter than the prior emission level. Such flaring behavior is characteristic of the subset of absorbed HMXBs known as Supergiant Fast X-ray Transients (SFXTs, Negueruela et al., (2006); Smith et al., (2006)). To better understand the nature of the flare and how it compares to the source during quiescence, we have separated the data as shown in Figure 3 and Table 3. The data segmentation separates the period prior to the flare (quiescence) from the flare itself (flare) and from the period after the giant flare has decayed to near the original level (post-flare). The definition of the quiescent period is clear due to an extended gap in the data (20ks) prior to the onset of the giant flare. The definition of the end of the flare is less clear, but we have chosen to define the end of the flare with the end of the orbit during which the flare decays below 2 the original level. The subsequent data to the end of the observation are defined as post-flare. This definition ensures that the flare segment is dominated by flare emission even if some small amount of ”post-flare” emission is included. It also ensures that the post-flare data are sufficient to produce an accurate spectrum. We have further subdivided the giant flare into the rising leg of the flare, the decaying leg of the flare (which are conveniently separated by an orbital gap) and a segment that encompasses all data from the onset of the flare to the end of the observation (”on”).
| Segment | start | stop | duration |
|---|---|---|---|
| (s) | (s) | (s) | |
| quiescence | 0 | 12000 | 12000 |
| total flare | 40068 | 46684 | 6616 |
| flare onset | 40068 | 41769 | 1701 |
| flare decay | 44669 | 46684 | 2015 |
| post-flare | 49000 | 72000 | 23000 |
| on | 40068 | 72000 | 31932 |
The results of absorbed powerlaw and partial covering model spectral fits to each of the six segments (quiescence, total flare, flare onset, flare decay, post-flare, on) are shown in Table 4. To limit the number of free parameters in the fit we have fixed the global column density, the partial covering column and the PCF to the values that they have when fitting the complete observation, allowing only to vary. We will return momentarily to the possibility that the spectral variation is due to these other parameters.
When allowing only to vary, we find that the ”on” segment is well fit by a model with 1.8. The quiescent data, in contrast, are fit by a much softer . No significant Fe lines are seen, although upper limits are given in Table 4. It is interesting to note that remains nearly unchanged (perhaps even becoming harder) as the flare subsides and the ”post-flare” phase begins. Considering the modest flux level of the ”post-flare” phase, one would expect that as the flare decays the spectrum would soften as the quiescent component once again becomes comparable to the flaring component. That this is not seen suggests that, during the ”post-flare” phase, the emission component that was seen during the quiescent phase is not merely being overwhelmed by the component responsible for the flare emission, but rather that the quiescent component is absent altogether.
| Seg# | Source | part | PCF | Flux | dof | Fe EW | |||
|---|---|---|---|---|---|---|---|---|---|
| (1022cm-2) | (1022cm-2) | (10)aaFit range set to 0.2keV to 10 keV | (eV) | ||||||
| 1-6 | Total | 11 | 76 | 0.55 | 1.81 | 16.1 | 565.0 | 591 | 43 |
| 1 | quiescent | 11 | 76 | 0.55 | 2.46 | 2.68 | 64.5 | 88 | 320 |
| 2 | total flare | 11 | 76 | 0.55 | 1.78 | 48.0 | 290.7 | 340 | 19 |
| 3 | flare onset | 11 | 76 | 0.55 | 1.81 | 58.5 | 71.3 | 123 | 65 |
| 4 | flare decay | 11 | 76 | 0.55 | 1.82 | 45.8 | 99.4 | 122 | 37 |
| 5 | post-flare | 11 | 76 | 0.55 | 1.73 | 9.68 | 242.2 | 269 | 81 |
| 6 | on | 11 | 76 | 0.55 | 1.75 | 20.6 | 508.5 | 554 | 28 |
If we leave all components of the partial covering model free to vary we find the results shown in Table 5. Here we see the quiescent phase described by a high PCF, moderately hard powerlaw and low column density. In contrast, the flare shows a low PCF and softer powerlaw with much higher column density. Finally, the ”post-flare” phase shows a PCF between the other two, the softest and the highest column density of all the segments. This suggests that the flare signals the onset of emission from a region of much greater local column density, perhaps from interaction with a disk. We will return to discuss this possibility in §4.
Previous observations of this source by both ASCA (Sidoli et al.,, 2005) and INTEGRAL (Sguera et al.,, 2006) have also shown evidence of outbursts lasting 1-2 hours. Translated into a common energy range the flux of these previous outbursts is lower than that seen in our Suzaku observations by a factor of a few, but differences in the measured spectral parameters and the lower signal to noise of these earlier observations limit the precision of the comparison. Nevertheless, the similarity of the outbursts in these three observations seems suggestive either of a characteristic timescale of the accretion flow of this source (perhaps indicative of an associated clump size in the flow) or of a periodic interaction of the neutron star with an over-dense region in the wind, possibly a disk. We note that a short (5ks) Chandra observation has been made of this source but no variability has previously been reported, though irregularities in the data complicate the analysis (Tomsick et al.,, 2006).
| Seg# | Source | part | PCF | Flux | dof | Fe EW | |||
|---|---|---|---|---|---|---|---|---|---|
| (1022cm-2) | (1022cm-2) | (10)aaFit range set to 0.2keV to 10 keV | (eV) | ||||||
| 1-6 | Total | 11 | 77 | 0.55 | 1.82 | 16.1 | 573.8 | 615 | 43 |
| 1 | quiescent | 3.5 | 10 | 0.95bbPCF is poorly constrained in the quiescent fit due to the low number of counts | 1.58 | 2.85 | 64.5 | 85 | 356 |
| 2 | total flare | 11 | 72 | 0.57 | 1.82 | 48.2 | 289.0 | 337 | 15 |
| 3 | flare onset | 10 | 48 | 0.52 | 1.73 | 59.4 | 69.0 | 120 | 49 |
| 4 | flare decay | 11 | 65 | 0.58 | 1.89 | 46.4 | 95.7 | 119 | 25 |
| 5 | post-flare | 12.4 | 121 | 0.75 | 2.07 | 9.73 | 237.0 | 266 | 68 |
| 6 | on | 11 | 83 | 0.55 | 1.75 | 20.4 | 507.2 | 551 | 43 |
3.3 SW2000.6+3210
Data were collected on SWJ2000.6+3210 during two epochs, separated by six months (see Figures 4-5). We have analyzed each of these observations separately. Neither observation is adequately fit by a simple absorbed powerlaw (see Table 2). Both observations are well fit by a partial covering model and the parameters of both fits are quite similar. The later observation has a slightly harder and significantly larger flux. Both observations show evidence of a weak Fe fluorescence line at 6.4 keV with apparently constant equivalent width.
Interestingly, while the first observation shows only random variability, the second observation shows regular variations with a period of 1056 s. We interpret this as the spin period of the neutron star companion in a binary, similar to long periodic variations noted in several other sources (Kuulkers,, 2005). There is the suggestion of secular variation beneath the 1056 s period, but the data are insufficient to confidently determine any further periodic components.
This may suggest that the system is a HMXB with an elliptical orbit. During the first observation, the compact object is far from the donor star where the wind density is low. In this case, the X-ray flux is likely to be approximately constant, possibly associated with an accretion disk or corona around the compact object. During the second observation, the compact object is nearer to the donor star where the stellar wind is more dense, channeling more material onto the neutron star and producing the observed periodicity through accretion.
4 Discussion
All of the sources in our sample are generally consistent with being members of the new INTEGRAL highly absorbed binary source class. The most likely candidate among our sources to be a member of this new class is SWJ2000.6-3210, which displays moderately high (11023 cm-2), and cutoff energy similar to other members of the class and periodic variations with a period of 1056 s.
IGRJ16195-4945 shows a high absorbing column and a brief but bright X-ray outburst, identifying it as a new SFXT. We note, however, that variations are not strictly required during the flare. If NH variations are not invoked, the outbursts can be associated with variable accretion and the duration of the flare may be indicative of the clump size in the companion star wind.
A recent alternative model (Sidoli et al.,, 2007) suggests that SFXT outbursts such as this are due to periodic interaction with an equatorial disk wind from the donor star. A dramatic increase in column is seen when all parameters are left free to vary during fitting, supporting this scenario. Sidoli et al. suggest that such outbursts are actually longer lived than the previously generally observed duration of hours, lasting instead for several days (Romano et al.,, 2007). Since our data coverage ends 30 ks after the flare onset, we cannot rule out that an elevated level of emission continues for several days after the initial flare, though the brightest emission appears to last for only 1 hour in our data.
If we assume the equatorial disk wind model to be applicable to this source, however, we can estimate the orbital period of the binary as follows. We assume that the three broad states seen in the Suzaku observation (quiescent, post-flare and total flare) approximately represent the full range of states of IGRJ16195-495 and thus we can write the following relationship between the flux of the 3 Suzaku states and the orbit-averaged flux level seen by BAT:
| (1) |
where a is the flux level of the Suzaku quiescent state observation and af is the fraction of the orbit spent in this state, b is the flux level of the Suzaku post-flare state observation and bf is the fraction of the orbit spent in this state, c is the flux level of the Suzaku total flare state observation and cf is the fraction of the orbit spent in this state and d is the (orbit averaged) flux of the BAT observation. If we now make the assumption that the bright flare seen in the Suzaku data (the total flare state) represents the entry of the compact object into an equatorial disk wind from the donor star, we must interpret the subsequent post-flare state as the longer lived period of moderate flaring behavior that accompanies the remainder of the journey of the compact object through the disk wind. According to the Romano et al., (2007) observation of SwiftJ11215-5952, this longer lived period of activity can last for up to 5 days. Assuming a similar duration for this phase in IGRJ16195-4945, we have b4.3e5/P and c5e3/P and a where P is the period of the binary in seconds. Thus equation (1) becomes:
| (2) |
To estimate the flux levels a, b, c and d, we fit each corresponding dataset using the average spectral fit to the complete dataset (including the BAT data) and determined the associated flux level in the 15-150 keV band. We find a=5.13e-12, b=8.61e-11, c=3.93e-10 and d=3.11e-11 ergs/cm2/s. Plugging these values into equation (2) returns a predicted period P16 days. This period is unusually short compared to other measured SFXT periods (Heras, Chaty and Rodriguez,, 2007; Romano et al.,, 2007). Even if we alter our calculation to interpret the on state (see Tables 4-5) as the measure of the flux during the passage through the disk wind rather than weighting it heavily to the post-flare state as shown above, the predicted period only increases by a factor of 2, which is still well below the more typically reported SFXT orbital periods of 200 days. An orbital period of 16 days, however, is consistent with previous measurements of orbital periods associated with highly absorbed IGR sources (Corbet, Hannikainen and Remillard,, 2004; Corbet et al.,, 2005). We are pursuing further observations to followup this predicted orbital period. If the predicted period is shown to be accurate, IGRJ16195-4945 may represent an important cross-over source between the known SFXTs with orbital periods of hundreds of days with periodic flaring behavior and the new class of highly absorbed INTEGRAL sources, which have much shorter orbital periods but are without clear observations of periodic flaring behavior. Such a cross-over object would suggest a common mechanism at work for the emission seen from HMXBs of widely varying orbital parameters. It would also suggest a useful method of refining the period search for such sources in instances where a single flare has been observed but large amounts of observatory time are not available for a dedicated follow-up monitoring campaign. A long-term monitoring campaign of this source would be very useful to determine the true duration of the associated outbursts.
IGRJ16493-4843 is a variable source with a high column density and non-periodic variations, also potentially qualifying it with this new source class. Finally, IGRJ16465-4507 presents the fewest similarities to previous observations of the class, but part of the discrepancy may be due to the narrow energy window in which our observations are made for this source. We note that we do not see periodic variability in this source as previously reported by others (Lutovinov et al.,, 2005; Kudryavtsev, Svertilov and Bogomolov,, 2006).
One of the interesting results of this work is that two of the four sources in our sample (IGRJ16465-4507 and SwiftJ2000.6+3210) appear to be transient pulsars. It would be very interesting to know if this is a common characteristic of all sources in this new class. If so, it would imply that elliptical orbits are common in these sources. Since it has been shown, however, that binaries will circularize rapidly (104-106 years) through tidal dissipation following the supernova detonation of the more massive star (Savonije and Papaloizou,, 1983; Lecar, Wheeler and McKee,, 1976), the occurrence of highly elliptical orbits, if found to be common in these sources, will require explanation. As a rough estimate of the fraction of sources that may be expected to be in highly elliptical orbits, we may proceed from work showing that the companion source in several of these systems is a supergiant O or B star (Nespoli, Fabregat and Mennickent,, 2008b, a; Halpern,, 2006; Tomsick et al.,, 2006; Negueruela, Smith and Chaty,, 2005). This implies that the HMXB phase of the lifetime of the system (the time after the detonation of the more massive star and prior to the detonation of the less massive star) will be typically 5-10106 years. Therefore, at most 10-20% of the observed sources should be found in strongly elliptical orbits. Finding a significantly higher fraction of highly elliptical orbits would suggest another mechanism at work during the HMXB evolution. Possible explanations for the lower circularization rate include generally wide orbital separation of the binaries, unusually large initial supernova kicks, and capture events or other gravitational interactions that may amplify eccentricity of the system.
It has been shown by Abt, (2005) that the ellipticity of visual binaries is roughly a function of the mass of the primary and the orbital period of the system, with tidal dissipation responsible for rapid circularization of systems with orbital periods less than about 10 days. Since the same mechanism of tidal dissipation is thought to be responsible for the circularization of X-ray binary orbits, it seems reasonable to assume that a similar function applies to HMXBs. Measuring both the ellipticity of the orbit and the period for a sample of these systems through a monitoring campaign will allow us to test whether this hypothesis is true, and thus will indicate whether tidal dissipation is the dominant effect in HMXB circularization.
Monitoring would also determine orbital periods of each system, a necessary step toward determining the orbital characteristics of the system and ultimately the mass of the compact object, and would allow a more in-depth analysis of spectral variability as a function of orbital phase. Since the neutron stars in these binaries likely orbit only a few stellar radii from the companion and are believed to have orbital periods on the order of ten days, daily or perhaps bi-weekly observations for about a month seem sufficient to accurately determine all of these characteristics. The Swift satellite offers the capability to perform such monitoring and, with its simultaneous X-ray and optical observations, would provide an ideal platform for future observations. Finally, monitoring on long timescales (covering a baseline of several years) will allow investigation of the spin-up/spin-down of the pulsar which can shed light on the magnetic field strength of the pulsar as well as the wind environment in which it is embedded (see, e.g., Patel et al., (2007)).
Three of the four sources in our sample are confidently associated with OB stars from optical spectroscopy (Negueruela, Smith and Chaty,, 2005; Halpern,, 2006; Nespoli, Fabregat and Mennickent,, 2008a). In the case of IGRJ16915-4945, a foreground dwarf star has thwarted attempts to identify the secondary. IGRJ16915-4945 has a history of X-ray outbursts, however, which are a trait of SFXTs that contain OB secondary stars (Negueruela et al.,, 2006). Thus association with a massive star seems likely for this system as well. Since the companion stars in these sources are most likely O or B stars, an interesting potential application of these data is to study the porosity or clump size of the absorbing material in the winds of massive stars. Though the periodic variability and extremely bright outbursts seen in some of the data cannot be explained by variations in the column density along the line of the sight to the observer in classic HMXBs, stochastic variations of lower contrast, which are also seen in the data, are a potential signature of variable obscuration. We have searched for variations in column density (assuming all other spectral parameters remain constant as a simplifying approximation) during the aperiodic pulses seen in some of the data but do not find any to within the uncertainty of the data. We point out, however, that typical fluences in the pulses analyzed are 1000 photons, leading to weak constraints on the column density. While some of these sources have prior observations with XMM-Newton, whose greater effective area will reduce the uncertainty in these measurements, the exposures are extremely short (3-4 ks) and thus are not able to constrain column density variations on timescales of 5-10 ks as seen in these data. Longer observations of these sources with XMM-Newton would be useful in this regard and would offer the additional benefit of high resolution soft X-ray spectroscopy to probe the ionization state of the wind through metal line strengths. Walter and Zurita Heras, (2007) have investigated the size of clumps in the accreting wind of SFXTs and determined typical masses of 1022-1023 g and mass loss rates of 10-5-10-6 M⊙/yr from analysis of INTEGRAL data. INTEGRAL data do not constrain NH, however, and thus cannot distinguish between variability due to changing column density levels and that due to changing accretion levels. XMM-Newton observations at 0.2-10.0 keV will be able to distinguish between these two variability mechanisms.
The limits on the Fe line equivalent widths (EWs) found in these sources are low for sources of such high NH column density (Makishima,, 1986). Such low Fe line EWs imply either an intrinsically low Fe abundance relative to NH (as has been seen in extragalactic sources, e.g., Centaurus A (Markowitz et al.,, 2007)) or that the Fe fluorescence covering fraction is less than 1. If the high NH column density absorber is local to the compact object, as has been suggested through comparisons between X-ray and optical absorption measures (e.g., Revnivtsev et al., (2003); Walter et al, (2003); Chaty and Filliatre, (2004)), and if the Fe fluorescence originates in a shell structure surrounding the compact object, it is difficult to envision a geometry in which the coverage would be less than 4. The Fe emission may originate in the inner region of the accretion disk, however, in which case a lower covering fraction may be reasonable. Furthermore, there are reasons to believe that the assumptions inherent in relating X-ray and optical absorption measures may not be valid for all sources (Maiolino et al,, 2001), and thus the disagreement between X-ray and optical absorption measures may not necessarily imply that the high column absorber is local to the compact object. Alternatively, such low Fe EWs might also be considered as evidence of the presence of ADC emission. The presence of an ADC seems unlikely, however, given the lack of other emission lines from 1-5 keV that are usually produced in ADCs. Still other explanations for low Fe EWs are similar to those discussed by Markowitz et al., (2007) in reference to Cen A and include the Fe fluorescence source being displaced from the X-ray continuum source or the presence of an attenuating obstruction between the X-ray source and the site of the Fe fluorescence. While our data argue against (but do not rule out) the low covering fraction scenario, the intrinsically low Fe EWs scenario requires non-trivial assumptions about the geometry of the system. Further observations, particularly phase-resolved spectroscopy, will be very helpful in disentangling these many potential explanations and are encouraged.
5 Summary and Conclusions
Our primary goal in this study is to determine whether these four sources exhibit similar characteristics to the emerging new class of highly absorbed IGR sgHMXB or SFXT sources. The defining characteristics of this new class are i) high absorption column (11023 cm-2), ii) periodicity on timescales of a few to 100 minutes, generally interpreted as a neutron star spin period, iii) periodicity on timescales of 10 days, generally interpreted as a binary orbital period and iv) occasionally strong X-ray emission lines.
i) In all four sources the total absorbing column is 11023 cm-2. Generally, we do not see significant changes in the absorption over the duration of the observations. While this is not surprising during a single day-long observation, which probably samples a small segment of the orbital phase, it is somewhat surprising that two observations of SWJ20006.+3210, separated by more than six months (and furthermore apparently at different parts of the orbital phase) also show no significant difference in . A dramatic increase in absorbing column is seen in IGR16195-4945 for a duration of 30 ks, during a bright outburst (when all parameters are left free to vary). Since this dramatic increase in is associated with a dramatic increase in flux, one might interpret this as an increase in emission due to interaction of the neutron star with a density enhancement. Such a scenario might be expected due to the passage of the neutron star through a thick disk associated with the donor star. Since an interpretation in which is approximately constant and only varies also produces adequate spectral fits, an alternative model in which the increased emission is due to variable accretion is also possible.
ii) In SWJ2000.6+3210, we see a period of 1056 s which is only observed during one of two observations of the source. This is a newly identified transient X-ray pulsar. Given the low magnetic field implied by the relatively slow rotation period of 1056 s, it is not surprising that the same mechanism that produces periodic observations near periastron is too weak to produce an observable period near apoastron where the wind density will be lower.
iii) Due to the short nature of the observations (generally 1 day), we do not expect to directly measure orbital periods, previously reported to be on the order of ten days in other sgHMXBs and, indeed, we do not. During observations of the one source for which we have well separated observations we also do not see evidence of an orbital period. We have, however, used our observations to calculate a predicted orbital period for IGRJ16195-4945. Assuming that IGRJ16195-4945 is a SFXT and that the bright flare we see signals the interaction of the compact object with an equatorial wind of the donor star, we have combined our Suzaku observations with long-term Swift-BAT observations to predict the orbital period for this source as P16 days. This is unusually short compared to previously measured SFXT orbital periods, but is consistent with orbital periods previously measured for the highly absorbed IGR sources. More consistent monitoring, perhaps using the Swift satellite, would be very useful in confirming or refuting this predicted period and in characterizing the orbital periods of these highly absorbed binaries in general.
iv) We find only weak evidence of Fe fluorescence emission in one source, and only upper limits to Fe lines in the other three sources. This is similar to the behavior reported in the original INTEGRAL highly absorbed X-ray binary sources (Kuulkers,, 2005) in which only 1 of 10 sources showed strong emission lines while the others showed only weak lines or upper limits. The Fe line measurements that we report here are either the first for the source in the literature (IGRJ16465-4507, IGRJ16493-4348, SwiftJ2000.6+3210) or several times more restrictive than previous measurements (IGRJ16195-4945). Moreover, our measurements are similarly or more restrictive than those reported on similar sources in the literature (see, e.g., Sidoli et al., (2005); Patel et al., (2004); Rodriguez et al., (2003)).
While none of these sources is ruled out from the IGR class based on these observations, further observations would be helpful in refining their nature. Of particular value would be periodic monitoring of all four systems.
References
- Abt, (2005) Abt, H. A., 2005, ApJ, 629, 507
- Bird et al., (2004) Bird, A. J., et al., 2004, ApJ, 607, L33
- Chaty and Filliatre, (2004) Chaty, S. and Filliatre, P., 2004, Proc 5th INTEGRAL Workshop on the INTEGRAL Universe, 552, 365
- Corbet, Hannikainen and Remillard, (2004) Corbet, R. H. D., Hannikainen, D. C. and Remillard, R., 2004, ATel, 269, 1
- Corbet et al., (2005) Corbet, R., et al., 2005, ATel, 649, 1
- Halpern, (2006) Halpern, J. P., 2006, ATel, 847, 1
- Heras, Chaty and Rodriguez, (2007) Heras, J. A. Z., Chaty, S. and Rodriguez, J., 2007, ATel, 1035, 1
- Kudryavtsev, Svertilov and Bogomolov, (2006) Kudryavtsev, M. I., Svertilov, S. I. and Bogomolov, V. V., 2006, astro-ph/0610887
- Kuulkers, (2005) Kuulkers, E., 2005, Proc AIP, 797, 402
- Lecar, Wheeler and McKee, (1976) Lecar, M., Wheeler, J. C. and McKee, C. F., 1976, ApJ, 205, 556
- Lutovinov et al., (2005) Lutovinov, A., et al., 2005, A&A, 444, 821
- Maiolino et al, (2001) Maiolino, R., et al., 2001, A&A, 365, 28
- Makishima, (1986) Makishima, K., 1986, ”The Physics of Accretion onto Compact Objects”, 266, 249
- Markowitz et al., (2007) Markowitz, A., et al., 2007, ApJ, 665, 209
- Markwardt et al., (2005) Markwardt, C. B., et al., 2005, ApJ, 633, L77
- Negueruela, Smith and Chaty, (2005) Negueruela, I., Smith, D. M. and Chaty, S., 2005, ATel, 429, 1
- Negueruela et al., (2006) Negueruela, I., et al., 2006, Proc ”The X-ray Universe 2005”, 604, 165
- Nespoli, Fabregat and Mennickent, (2008a) Nespoli, E., Fabregat, J. and Mennickent, R. E., 2008, ATel, 1396, 1
- Nespoli, Fabregat and Mennickent, (2008b) Nespoli, E., Fabregat, J. and Mennickent, R. E., 2008, astro-ph/0806.0295
- Patel et al., (2004) Patel, S. K., et al., 2004, ApJ, 602, L45
- Patel et al., (2007) Patel, S. K., et al., 2007, ApJ, 657, 994
- Revnivtsev et al., (2003) Revnivtsev, M. G., et al., 2003, Astronomy Letters, 29, 587
- Rodriguez et al., (2003) Rodriguez, J., et al., 2003, A&A, 407, L41
- Romano et al., (2007) Romano, P., et al., 2007, A&A, 469, L5
- Savonije and Papaloizou, (1983) Savonije, G. J. and Papaloizou, J. C. B., 1983, MNRAS, 203, 581
- Sguera et al., (2006) Sguera, V., et al., 2006, ApJ, 646, 452
- Sidoli et al., (2005) Sidoli, L., et al., 2005, A&A, 429, 47
- Sidoli et al., (2007) Sidoli, L., et al., 2007, A&A, 476, 1307
- Smith et al., (2006) Smith, D. M., et al., 2006, ApJ, 638, 974
- Smith et al., (2008) Smith, R. K., et al., 2008, PASJ, 60, 43
- Tomsick et al., (2006) Tomsick, J. A., et al., 2006, ApJ, 647, 1309
- Tueller et al., (2008) Tueller, J., et al., 2008, in preparation
- Walter et al, (2003) Walter, R., et al., 2003, A&A, 411, L427
- Walter et al., (2006) Walter, R., et al., 2006, Proc IAU, 230, 351
- Walter and Zurita Heras, (2007) Walter, R. and Zurita Heras, J., 2007, A&A, 476, 335
- Winkler et al., (2003) Winkler, C., et al., 2003, A&A, 411, L1