Quantifying the heart of darkness with GHALO - a multi-billion particle simulation of our galactic halo
Abstract
We perform a series of simulations of a Galactic mass dark matter halo at different resolutions, our largest uses over three billion particles and has a mass resolution of . We quantify the structural properties of the inner dark matter distribution and study how they depend on numerical resolution. We can measure the density profile to a distance of 120 pc (0.05% of ) where the logarithmic slope is -0.8 and -1.4 at (0.5% of ). We propose a new two parameter fitting function that has a linearly varying logarithmic density gradient which fits the GHALO and VL2 density profiles extremely well. Convergence in the density profile and the halo shape scales as , but the shape converges at a radius three times larger at which point the halo becomes more spherical due to numerical resolution. The six dimensional phase-space profile is dominated by the presence of the substructures and does not follow a power law, except in the smooth under-resolved inner few kpc.
keywords:
methods: N-body simulations – methods: numerical – dark matter — galaxies: haloes — galaxies: clusters: general1 Introduction
Over twenty five years ago the theoretical framework for the evolution of a cold dark matter (CDM) dominated universe was established (Peebles, 1982). The hierarchical and violent growth of structure in this model begins at a scale of (Diemand et al., 2005) until the most massive clusters of galaxies form that are many orders of magnitude more massive. The assumption that the dark matter is cold remains to be verified, yet numerical simulations that follow the hierarchical formation of CDM haloes have given several fundamental and robust predictions for the structural and substructure properties of the dark matter distribution within virialised haloes (Dubinski & Carlberg, 1991; Navarro et al., 1996; Avila-Reese et al., 1999; Bullock et al., 2001; Fukushige & Makino, 2001). These results are widely used to compare with observational data and to assist comparisons with analytic models.
The first CDM halo simulated with enough resolution to resolve substructure used particles (Moore et al., 1998), resolving the density profile to about one percent of the virial radius (Ghigna et al., 1998; Moore et al., 1999; Power et al., 2003; Navarro et al., 2004; Diemand et al., 2004). Whilst such simulations find numerous substructures in the outer halo, they find few or none within the inner 20% of and no obvious structure in phase-space in the central halo regions (Moore et al., 2001). Advances in algorithms and supercomputing power have recently allowed us to increase this resolution by over two orders of magnitude with the Via Lactea II (VL2) simulation (Diemand et al., 2008).
There are several reasons why we wish to carry out further studies at a higher resolution: (i) There are many old and forthcoming observational tests that constrain the structure of dark matter haloes on scales well within . These include high resolution rotation curve data and the kinematics of stars at the centres of dwarf galaxies. Future proper motions of these inner stars with GAIA or SIM will provide even tighter constraints. The close binary nuclei in galaxies such as VCC128 constrains the dynamics on even smaller scales (Goerdt et al., 2008). (ii) As large surveys have pushed the surface brightness limits and detection efficiencies, many extremely faint satellite galaxies have been found orbiting the Milky Way. The completeness of current surveys is debated, and it has been argued that many hundreds of additional systems may be found in the coming years (Tollerud et al., 2008). Simulations that can resolve and follow the survival of substructure within of are necessary to compare with these data. (iii) Dark matter detection, either directly on Earth or indirectly via detection of annihilation relics, is the ultimate way to determine its nature. These experiments rely on accurate predictions for the phase-space structure of dark matter at the position of the Earth’s orbit and the abundance and inner properties of substructure throughout the Galactic halo. (iv) Understanding the equilibrium structure resulting from violent relaxation is the ultimate challenge for galactic dynamicists. There is no compelling theory that can explain universal density and phase-space density profiles (Taylor & Navarro, 2001), or correlations such as between the local density profile and the anisotropy parameter (Hansen & Stadel, 2006).
Given this motivation, we have carried out a sequence of simulations of a single Galactic mass dark matter halo, which at our highest resolution contains over a billion particles within its virial radius. In this letter we report on its inner structure and convergence properties.
2 The Simulations
Our initial conditions are based upon the WMAP3+SDSS (Spergel et al., 2007; Yao et al., 2006) cosmological model with . The galaxy sized, , kpc, halo was selected from a cosmological cube of 40 Mpc on a side. This simulation had particles (simulation GHALO5) in which three further nested spatial refinements by a factor of 3 (GHALO4,3,2) were placed such that the Lagrangian region of about of the halo at was covered by high resolution particles in the initial condition. The final effective resolution of GHALO2 is resulting in a particle mass of 1000 and a total of particles and particles within kpc. This allows us to capture all substructures out to more than at the highest resolution. A further refinement GHALO1 (in progress) will resolve the phase-space structure at the position of the sun more sharply for future recoil dark matter detection experiments.
Creating these initial conditions was a significant challenge and we had to parallelize the GRAFIC1 and GRAFIC2 codes of Bertschinger (2001) whereby the GRAFIC2 code was completely rewritten in C and MPI, and checked for near machine precision agreement with the original GRAFIC2. The new parallel GRAFIC1&2 codes can be obtained from the authors. Generation of the initial condition took 10 hours on 500 CPUs. We found that the original GRAFIC2 code had a bug in which the power spectrum used for the refinements was effectively that of the baryonic component. Although this has affected many previous simulations (not GHALO, nor VL2), tests show that the conclusions of these studies are not compromised.
The GHALO2 simulation was run at the Barcelona Supercomputer Center on 1000 CPUs of Marenostrum using a total of 2 million CPU hours. Several significant improvements to the gravity code PKDGRAV2 made this calculation possible including much better parallel computing efficiency and SIMD vector processing. PKDGRAV2 uses a fast multipole method (FMM) similar to Dehnen (2000, 2002) but using a 5th-order reduced expansion for faster and more accurate force calculation in parallel, and a multipole based Ewald summation technique for periodic boundary conditions (Stadel, 2001). It uses adaptive individual time-steps for particles based on a new estimator of the local dynamical time (Zemp et al., 2007). The opening angle in the gravity tree and the accuracy parameter in the dynamical time-stepping is and before , and then increased to 0.7 and 0.06 respectively. We make several comparisons to the VL2 simulation which was also run with the FMM version of PKDGRAV2, but whose initial conditions were selected and generated independently using somewhat different methods. The VL2 halo has a mass of and used a particle mass of 4000 . The spline softening lengths for GHALO2, VL2, GHALO3,4,5 are 61, 40, 182, 546, and 1639 pc, respectively (for GHALO these are set to 1/50 of the mean inter-particle separation).
3 The inner halo structure
3.1 The dark matter density profile
| 3rd parameter | |||||||||
|---|---|---|---|---|---|---|---|---|---|
| Fitting Function | Hernquist () | GH2 | VL2 | GH2 | VL2 | GH2 | VL2 | GH2 | VL2 |
| NFW | (1,3,1) | 3.5 | 6.6 | 2.32 | 4.24 | 14.1 | 13.9 | —– | |
| Dehnen-McLaughlin | 1.6 | 0.70 | 0.273 | 0.591 | 42.6 | 36.7 | —– | ||
| S&M-profile () | —– | 0.93 | 0.41 | 5050 | 11000 | 2.20 | 1.88 | —– | |
| Generalized NFW | (1,3,) | 3.0 | 2.7 | 1.78 | 1.87 | 16.2 | 20.9 | 1.04 | 1.13 |
| Dehnen-McLaughlin | 1.3 | 0.68 | 0.466 | 0.522 | 32.0 | 39.1 | -0.0531 | 0.0129 | |
| Prugniel-Simien () | —– | 1.5 | 0.94 | 14.0 | 19.5 | 59.6 | 92.4 | 0.376 | 0.328 |
| Einasto () | —– | 1.0 | 0.45 | 0.685 | 0.991 | 26.8 | 28.9 | 0.155 | 0.142 |
| S&M-profile () | —– | 0.92 | 0.41 | 4710 | 11200 | 2.47 | 1.82 | 0.102 | 0.100 |
We apply a logarithmic binning to determine the radial density profile for the various simulations which are shown in Figure 2. The convergence radius of the density profile for the lower resolution realizations (GHALO3,4,5) can be clearly seen and are shown by the tick marks. These scale roughly as expected with , and we extrapolate this to conclude that the convergence radius of GHALO2 is around 120 pc. The inner slope of GHALO2 is -0.8 at 120 pc = of and -1.4 at 2 kpc where the first subhalos become visible. Also shown is the power-law slope as a function of , which exhibits a similar linear functional form for both haloes with no rescaling. Based on this observation we propose a new functional form for the fitting function of the density profile,
| (1) |
which we term the S&M-profile (Stadel & Moore in preparation). It is linear in this plot down to a scale beyond which it approaches the central maximum density as . We also note that if one makes a plot of vs. , then this profile forms an exact straight line with slope .
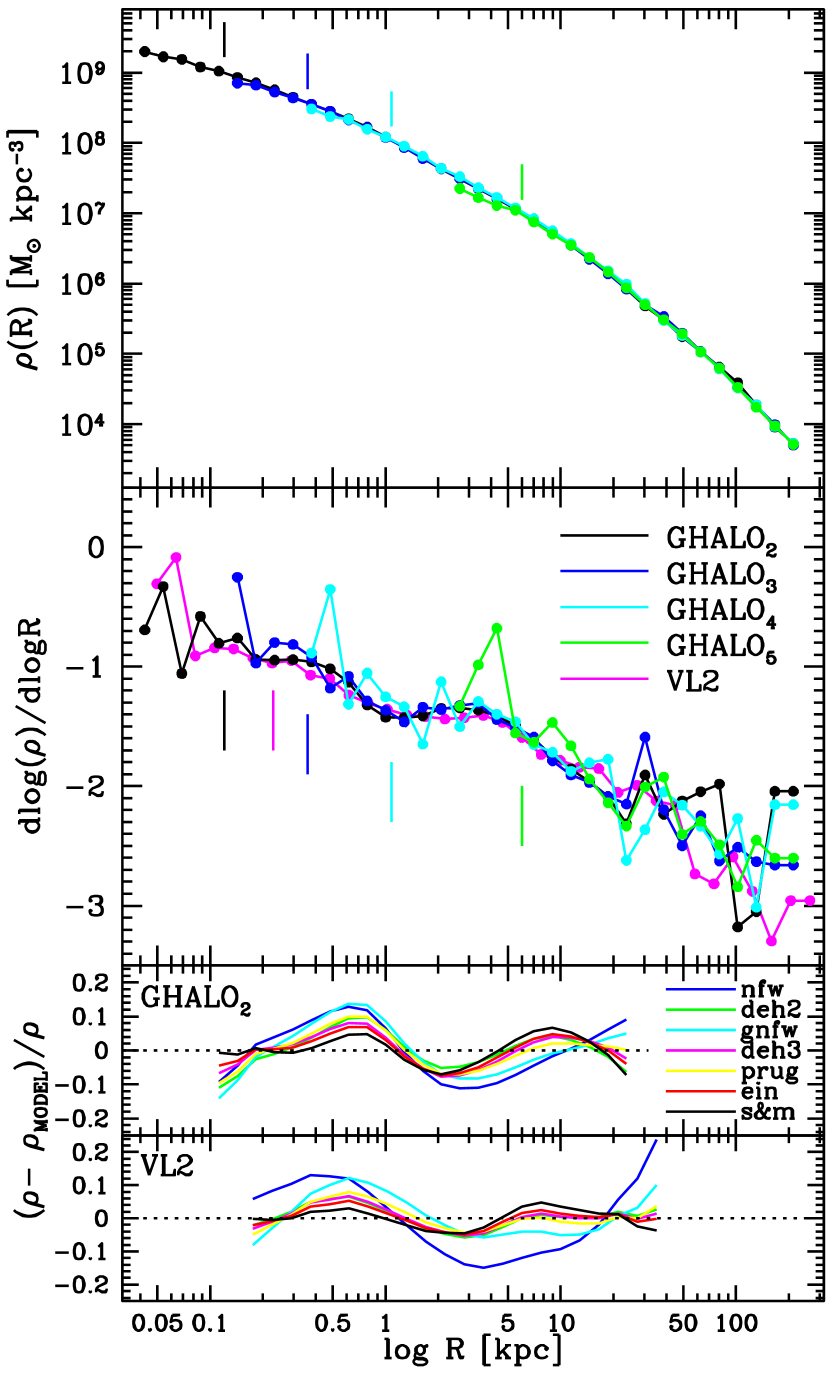
Table 1 lists the best fitting parameters for several functions: the S&M-profile, the restricted Hernquist profiles (Hernquist, 1990; Zhao, 1996), the Einasto profile (Einasto, 1969; Navarro et al., 2004)
| (2) |
and the Prugniel & Simien (1997) profile
| (3) |
where and (for , see Merritt et al. (2006)) such that when projected one obtains a Sérsic profile (Sérsic, 1963, 1968).
The residuals shown in Figure 2 show that the S&M-profile provides a slightly better fit than all the models for the inner, more consistent, part of the profile. Furthermore, it is the only 3-parameter model where the 3rd parameter has a consistent value for the two different simulations. For this reason we also list this model as a possible 2-parameter model, fixing . The Einasto profile also provides an excellent fit to the density profiles of the two simulations.
3.2 Convergence of Halo Shape
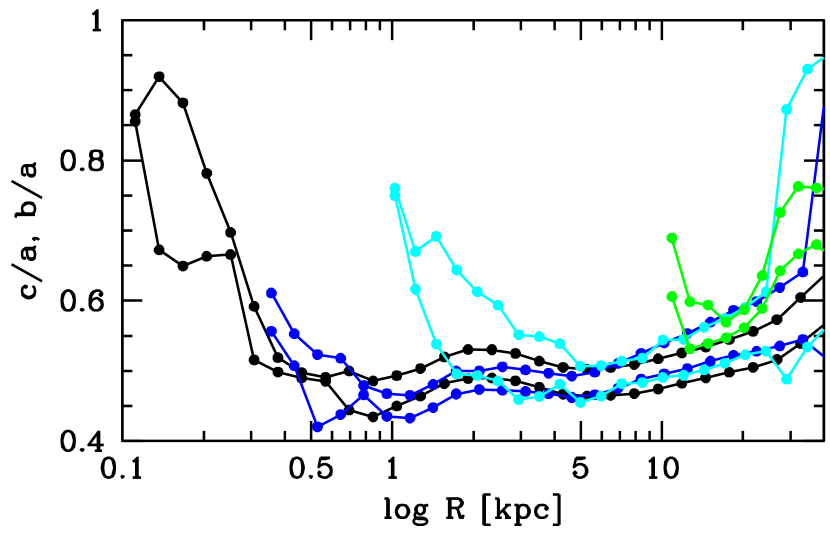
The convergence of the shape parameters (see also Allgood et al. (2006)) for GHALO in Figure 3 show that it is highly prolate over all resolved regions with b/a = c/a 0.5. At the halo centres the shape diverges quickly to a more spherical configuration. This is likely due to the orbital distribution being modified by the effects of resolution and softening. In this region the velocity distribution function is also strongly affected.
We estimate the convergence in the shape to be achieved at 0.3, 0.6, 2, 15 kpc for GHALO2,3,4,5 respectively, a radius that is about 3 times the inferred convergence radius of the density profile but also scaling as . The fact that the variation in shape has little impact on the density profile can be understood by comparing the density profile taken in a 15 degree cone about the major, , axis and the minor, , axis (Jing & Suto, 2002). The for the fits to the various density profiles remains roughly consistent between the two axial density profiles, although the best fit parameters vary. Due to the prolate shape the density profile parameters for the short axis are similar to the ones presented in Table 1.
3.3 Phase-Space Density Profile
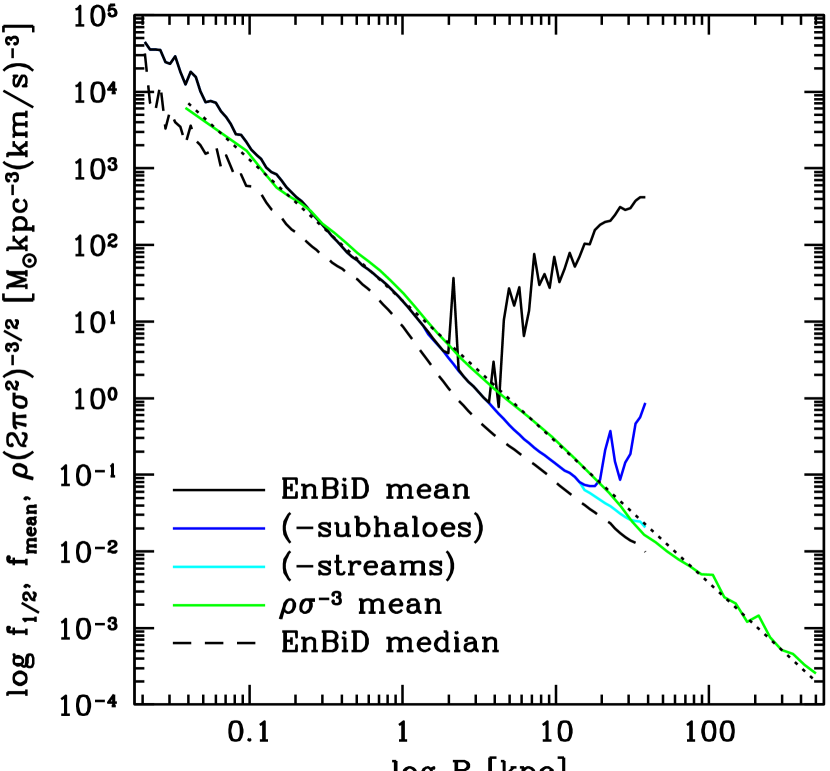
It has been pointed out (Taylor & Navarro, 2001; Dehnen, 2005; Dehnen & McLaughlin, 2005) that the phase-space density (PSD) proxy, vs is a power-law for CDM haloes, and several new fitting functions for the density profile have been proposed using this fact as a starting point such as the Dehnen-McLaughlin models. When averaged in shells, is remarkably well fit by a power-law with slope of as shown in Figure 4. However, it is interesting to compare this spherically averaged estimate with the true 6-dimensional PSD.
The code EnBiD (Sharma & Steinmetz, 2006) has improved on earlier work by Ascasibar & Binney (2005) in calculating better estimates of the 6-dimensional phase-space volume occupied by each particle and hence the PSD. Taking the mean EnBiD PSD in logarithmic shells we see that the closest subhalo at 1.8 kpc stands out prominently and subhalos at larger radii begin to dominate the mean. Using a method based on a 6-dimensional Voronoi tessellation Arad et al. (2004) also showed that the subhalos form a dominant contribution to the phase-space density. This feature of using the EnBiD PSD can be turned to great advantage in identifying subhalos and other substructures such as phase-space streams. However, removing the effect of subhalos with from the mean, we extend the mean background PSD out to much larger radii as shown in Figure 4. By removing streams, with , we can extend this to at least 40 kpc.
We find that the true radial PSD profile estimated with EnBiD does not follow such a perfect power law and shows a steeper slope (roughly ) than the estimator. The EnBiD mean estimate and are in agreement from about 0.2 to 2 kpc but the meaning of the power-law behaviour of is unclear given that inside of 0.2 kpc it is under-resolved and outside of 2 kpc a large contribution comes from the substructure. A further concern is the considerable variation of about a spherical shell of the prolate inner halo, which makes it remarkable that we obtain the same power-law slope as originally found by (Taylor & Navarro, 2001) despite the averaging that is taking place. This also explains the good performance of the Dehnen-McLaughlin 2 and 3-parameter models at fitting the density profile.
From about 2 to 40 kpc the estimator is somewhat enhanced due to the presence of substructure, while inside of 0.1 kpc the EnBiD–mean continues to resolve the power-law behaviour of the profile.
4 Conclusions
The GHALO2 simulation has achieved an unprecedented spatial and mass resolution within a CDM halo, resolving thousands of subhalos within a radius corresponding to the galactic disk and a rich phase-space structure of streams beyond a radius of kpc. Whilst there are more detailed analyses of this simulation in progress, we have reported here on the global inner properties of density and phase-space density profiles and halo shape. Using a sequence of simulations of the same halo at difference resolutions, from – particles, we confirm that the convergence radii for the density profile and shape scales as . The logarithmic slope of the radial density profile is close to a power law, gradually turning over to a slope of at our innermost resolved region ( of ). We have proposed a new two parameter fitting function that has a linearly varying logarithmic gradient which provides the best fit to the inner part of the GHALO and VL2 haloes. A larger sample of haloes, such as Bullock et al. (2001) and Macciò et al. (2007), would be required to determine if this functional form provides a universal fit. We find that the convergence radius of the density is a factor of three smaller than the convergence of halo shape. GHALO is prolate, yet becomes spherical within a region where orbits are most likely innacurately followed due to the effects of finite particle number, relaxation and softening.
All functional forms fit to density profiles, whether 2 or 3 parameters are empirical fits, even those based on properties (the Dehnen-McLaughlin) of the phase-space density profile whose origin is still poorly understood. Therefore the only current confidence can be given to those profiles which have been fit to the highest resolution simulations and over the widest range of halos encountered in N-body simulations. Clearly these two criteria are in conflict since simulations at the resolution of GHALO are too expensive to allow a broader study. Therefore, the results presented here should be considered as guides only, whose generality remains to be tested. Never the less we can consider economy of parameters and simplicity of functional form as guiding principles in the search for suitable profile functions to describe the end state of gravitational collapse. All the profiles we fit here (Table 1 and residuals in Figure 2) meet these subjective criteria, having at most 3 free parameters and simple functional forms.
While the phase-space density estimated by is observed to follow a power law in radius of slope , its meaning is less clear since at small radii it is limited by resolution of the estimator and at larger radii it becomes dominated by subhalos. Using the more sophisticated EnBiD PSD estimator we find that the radial profile is steeper with an index of about , but that it is not as perfect a power-law as seen in .
As a final comment, we note that in large galaxies, the inner structure and shape of the dark matter halo has likely been altered over time by the baryons via a range of physical effects, including dissipation, energy transfer from sinking massive objects, binary black holes, bar-halo interactions, turbulent gas motions and more. Simulations that follow the baryonic components together with the dark matter will resolve these additional questions in the coming years.
Acknowledgments
We are grateful to the Barcelona Supercomputing Center for their generous allocation of resources on the Marenostrum supercomputer and to Jose Maria Ibañez for his enthusiastic support of this project. Support for this work was also provided by the Spanish Ministry grant MEC AYA2007-67752-C03-02 (V.Q.) and by NASA through grants HST-AR-11268.01-A1 and NNX08AV68G (P.M.) and Hubble Fellowship grant HST-HF-01194.01 (J.D.).
References
- Allgood et al. (2006) Allgood B., Flores R. A., Primack J. R., Kravtsov A. V., Wechsler R. H., Faltenbacher A., Bullock J. S., 2006, MNRAS, 367, 1781
- Arad et al. (2004) Arad I., Dekel A., Klypin A., 2004, MNRAS, 353, 15
- Ascasibar & Binney (2005) Ascasibar Y., Binney J., 2005, MNRAS, 356, 872
- Avila-Reese et al. (1999) Avila-Reese V., Firmani C., Klypin A., Kravtsov A. V., 1999, MNRAS, 310, 527
- Bertschinger (2001) Bertschinger E., 2001, ApJS, 137, 1
- Bullock et al. (2001) Bullock J. S., Kolatt T. S., Sigad Y., Somerville R. S., Kravtsov A. V., Klypin A. A., Primack J. R., Dekel A., 2001, MNRAS, 321, 559
- Dehnen (2000) Dehnen W., 2000, ApJ, 536, L39
- Dehnen (2002) Dehnen W., 2002, JCompPhys, 179, 27
- Dehnen (2005) Dehnen W., 2005, MNRAS, 360, 892
- Dehnen & McLaughlin (2005) Dehnen W., McLaughlin D. E., 2005, MNRAS, 363, 1057
- Diemand et al. (2008) Diemand J., Kuhlen M., Madau P., Zemp M., Moore B., Potter D., Stadel J., 2008, Nature, 454, 735
- Diemand et al. (2004) Diemand J., Moore B., Stadel J., 2004, MNRAS, 353, 624
- Diemand et al. (2005) Diemand J., Moore B., Stadel J., 2005, Nature, 433, 389
- Dubinski & Carlberg (1991) Dubinski J., Carlberg R. G., 1991, ApJ, 378, 496
- Einasto (1969) Einasto J., 1969, Astrofizika, 5, 137
- Fukushige & Makino (2001) Fukushige T., Makino J., 2001, ApJ, 557, 533
- Ghigna et al. (1998) Ghigna S., Moore B., Governato F., Lake G., Quinn T., Stadel J., 1998, MNRAS, 300, 146
- Goerdt et al. (2008) Goerdt T., Read J. I., Moore B., Stadel J., 2008, ArXiv e-prints, 806
- Hansen & Stadel (2006) Hansen S. H., Stadel J., 2006, JCAP, 5, 14
- Hernquist (1990) Hernquist L., 1990, ApJ, 356, 359
- Jing & Suto (2002) Jing Y. P., Suto Y., 2002, ApJ, 574, 538
- Macciò et al. (2007) Macciò A. V., Dutton A. A., van den Bosch F. C., Moore B., Potter D., Stadel J., 2007, MNRAS, 378, 55
- Merritt et al. (2006) Merritt D., Graham A. W., Moore B., Diemand J., Terzić B., 2006, AJ, 132, 2685
- Moore et al. (2001) Moore B., Calcáneo-Roldán C., Stadel J., Quinn T., Lake G., Ghigna S., Governato F., 2001, Phys. Rev. D, 64, 63508
- Moore et al. (1998) Moore B., Governato F., Quinn T., Stadel J., Lake G., 1998, ApJ, 499, L5+
- Moore et al. (1999) Moore B., Quinn T., Governato F., Stadel J., Lake G., 1999, MNRAS, 310, 1147
- Navarro et al. (1996) Navarro J. F., Frenk C. S., White S. D. M., 1996, ApJ, 462, 563
- Navarro et al. (2004) Navarro J. F., Hayashi E., Power C., Jenkins A. R., Frenk C. S., White S. D. M., Springel V., Stadel J., Quinn T. R., 2004, MNRAS, 349, 1039
- Peebles (1982) Peebles P. J. E., 1982, ApJ, 263, L1
- Power et al. (2003) Power C., Navarro J. F., Jenkins A., Frenk C. S., White S. D. M., Springel V., Stadel J., Quinn T., 2003, MNRAS, 338, 14
- Prugniel & Simien (1997) Prugniel P., Simien F., 1997, A&A, 321, 111
- Sérsic (1963) Sérsic J. L., 1963, BAAA, 6, 41
- Sérsic (1968) Sérsic J. L., 1968, Atlas de galaxias australes
- Sharma & Steinmetz (2006) Sharma S., Steinmetz M., 2006, MNRAS, 373, 1293
- Spergel et al. (2007) Spergel D. N., Bean R., Doré O., Nolta M. R., Bennett C. L., Dunkley J., Hinshaw G., Jarosik N., Komatsu E., Page L., Peiris H. V., Verde L., Halpern M., Hill R. S., Kogut A., Limon M., Meyer S. S., Odegard N., Tucker G. S., Weiland J. L., Wollack E., Wright E. L., 2007, ApJS, 170, 377
- Stadel (2001) Stadel J. G., 2001, PhD thesis, AA(UW)
- Taylor & Navarro (2001) Taylor J. E., Navarro J. F., 2001, ApJ, 563, 483
- Tollerud et al. (2008) Tollerud E. J., Bullock J. S., Strigari L. E., Willman B., 2008, ArXiv e-prints, 806
- Yao et al. (2006) Yao W. M. et al., 2006, Journal of Nuclear Physics G, 33
- Zemp et al. (2007) Zemp M., Stadel J., Moore B., Carollo C. M., 2007, MNRAS, 376, 273
- Zhao (1996) Zhao H., 1996, MNRAS, 278, 488