DISCOVERY OF THE ULTRA-BRIGHT Type II-L SUPERNOVA 2008es
Abstract
We report the discovery by the Robotic Optical Transient Search Experiment (ROTSE-IIIb) telescope of SN 2008es, an overluminous supernova (SN) at with a peak visual magnitude of 22.2. We present multiwavelength follow-up observations with the Swift satellite and several ground-based optical telescopes. The ROTSE-IIIb observations constrain the time of explosion to be 231 rest-frame days before maximum. The linear decay of the optical light curve, and the combination of a symmetric, broad H emission line profile with broad P Cygni H and Na I profiles, are properties reminiscent of the bright Type II-L SNe 1979C and 1980K, although SN 2008es is greater than 10 times more luminous. The host galaxy is undetected in pre-supernova Sloan Digital Sky Survey images, and similar to Type II-L SN 2005ap (the most luminous SN ever observed), the host is most likely a dwarf galaxy with . Swift Ultraviolet/Optical Telescope observations in combination with Palomar 60 inch photometry measure the spectral energy distribution of the SN from 200 to 800 nm to be a blackbody that cools from 14,000 K at the time of the optical peak to 6400 K 65 days later. The inferred blackbody radius is in good agreement with the radius expected for the expansion speed measured from the broad lines (10,000 km s-1). The bolometric luminosity at the optical peak is erg s-1, with a total energy radiated over the next 65 days of erg. The exceptional luminosity of SN 2008es requires an efficient conversion of kinetic energy produced from the core-collapse explosion into radiation. We favor a model in which the large peak luminosity is a consequence of the core-collapse of a progenitor star with a low-mass extended hydrogen envelope and a stellar wind with a density close to the upper limit on the mass-loss rate measured from the lack of an X-ray detection by the Swift X-Ray Telescope.
Subject headings:
supernovae: general — supernovae: individual (SN 2008es) — ultraviolet: ISM1. Introduction
Hydrogen-rich supernovae (SNe II) produce their radiative energy in several phases; with a diversity of luminosities, light curves, and spectroscopic features that divide them into subclasses. An initial burst of UV/X-ray radiation is observed at the time of shock breakout (Schawinski et al. 2008; Gezari et al. 2008a), followed by declining UV/optical emission from the adiabatic expansion and cooling of the SN ejecta (e.g., SN II-pec 1987A, Hamuy et al. 1988; SN IIb 1993J, Schmidt et al. 1993; Richmond et al. 1994, SN II-P 2006bp, Immler et al. 2007). Type II-plateau (II-P) SNe are characterized by their subsequent plateau in optical brightness, which is understood as the result of a progenitor with a substantial hydrogen envelope, for which a cooling wave of hydrogen recombination recedes through the inner layers of the ejecta (Falk & Arnett 1977; Litvinova & Nadyozhin 1983). Type II-linear (II-L) SNe do not have a plateau phase, but rather a steep drop in luminosity that is thought to be the result of the ejection of large amounts of radioactive material (Young & Branch 1989) or a small hydrogen envelope mass (Barbon et al. 1979; Blinnikov & Bartunov 1993). The subclass of bright SNe II-L (; Patat et al. 1994) has been proposed to be the result of an extended low-mass envelope (Swartz et al. 1991) and reprocessing of UV photons in the superwind of the progenitor star (Blinnikov & Bartunov 1993) or a gamma-ray burst (GRB) explosion buried in a hydrogen-rich envelope (Young et al. 2005). Type II-narrow (IIn) SNe show signs of interaction of the ejecta with circumstellar material (CSM) in the form of narrow emission lines, X-ray emission, and an excess in optical luminosity (e.g., SN 1988Z: Turatto et al. 1993). After the photospheric phase in SNe II, a final exponential decline is powered by heating due to the radioactive decay of 56Co.
In this paper, we present the discovery of an overluminous SN II that has the properties of an SN II-L, but with an exceptional luminosity that we argue is best explained by the core-collapse of a progenitor star with a low-mass, extended hydrogen envelope and a dense stellar wind. We disfavor more exotic scenarios such as an interaction with a massive shell of CSM expelled in an episodic eruption, a pair-instability explosion, or a buried GRB. In §2, we present the Robotic Optical Transient Experiment (ROTSE-IIIb) discovery data, and follow-up observations with the Swift satellite and several ground-based telescopes; in §3 we compare the properties of SN 2008es to other known Type II SNe, and use our observations to constrain the mechanism powering the extraordinary radiative output; and in §4 we make our conclusions.
2. Observations
2.1. Photometry
SN 2008es was discovered as an optical transient at 11h 56m 4913, 27 257 (J2000.0) in unfiltered images (calibrated to the SDSS band) taken by the 0.45 m ROTSE-IIIb telescope (Akerlof et al., 2003) at McDonald Obseratory on 2008 Apr 26 (ROTSE J115649.1+542726; Yuan et al. 2008). UT dates are used throughout this paper. ROTSE-IIIb continued to monitor the transient for days. We began a monitoring program with the Palomar 60 inch (P60) telescope (Cenko et al., 2006) in the , , and bands on 2008 May 2, with continued observations for days. Observations in the band were obtained by the 1.3m MDM telescope and the 4 K detector with 0.315 arcsec pixel-1 spatial resolution, starting on 2008 May 24 and continuing for 45 days. Secondary standard stars were established through observations of stars from Landolt (1992), and included the determination of nightly extinction corrections. Observations on 2008 August in the , , and bands were obtained with the Palomar 200 inch telescope (P200) and the Large Format Camera.
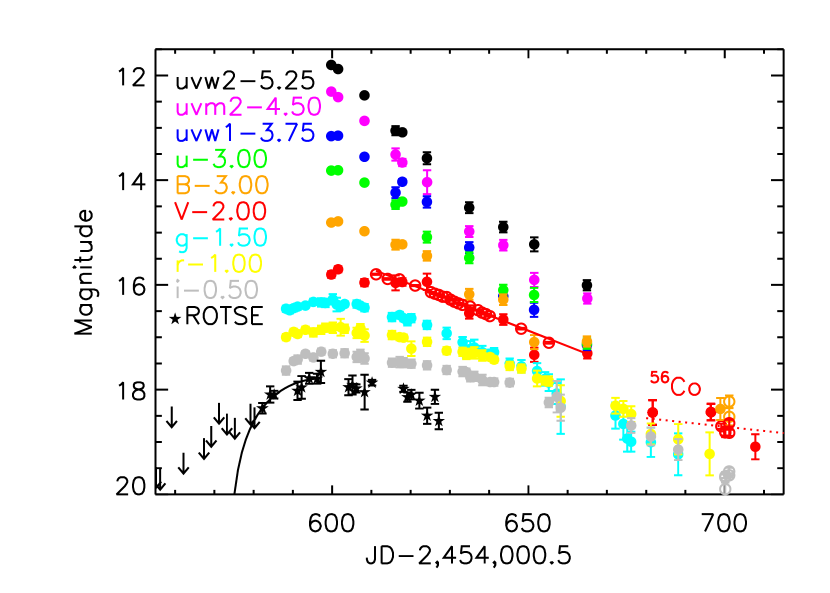
The optical light curve measured from all four optical telescopes is shown in Figure 1 and Table 1. Magnitudes reported in this paper have been corrected for a Galactic extinction of E()=0.012 mag (Schlegel et al., 1998). The ROTSE-IIIb and P60 data catch the rise of the source to its peak. We fit the rise of the unfiltered flux measured by ROTSE IIIb with a quadratic function (plotted with a black line in Figure 1), and estimate the time of explosion from the intercept with the time axis to be MJD 54,574 1. The error in the time of explosion reflects both the statistical error from the ROTSE-IIIb flux uncertainties and the systematic error from the shape of the function used for the fit. We measure the peak of the light curve from quadratic fits to the individual filter light curves from MJD 54,580 to 54,620, which yields a peak of MJD 54,602 , and corresponds to 23 1 days after the time of explosion in the rest frame of the SN.
2.2. Spectroscopy
Within days of the ROTSE discovery, we followed up the source with optical spectroscopy on 2008 May 1 and 8 with the 9.2m Hobberly Eberly Telescope (HET) and the Marcario Low-Resolution Spectrograph and on 2008 May 2 with P200 and the Double Beam Spectrograph (Yuan et al., 2008). The transient was tentatively classified as a quasar because the spectra showed a featureless blue continuum and one broad emission feature that was associated with Mg II 2798 at . We obtained further follow-up spectra on 2008 June 1 and 16 with the HET and on 2008 August 1 with P200. The identification of the redshift and type of the SN was ambiguous (Miller et al. 2008a; Gezari et al. 2008b; Miller et al. 2008b) until later spectra obtained on 2008 August 1 (by our group with P200) and 2008 August 3 (by Chornock et al. 2008 with the 10m Keck Low-Resolution Imager and Spectrograph), revealed broad Balmer emission lines, reported by Chornock et al. (2008) to be associated with a Type II SN at . Figure 2 shows the evolution of the spectra over time, and Table 2 gives the log of spectroscopic observations. In order to minimize uncertainties in the absolute flux calibration, the spectra are multiplied by a scaling factor so that their flux integrated over the -band filter matches the P60 -band photometry closest in time to the observation. We see no evidence of narrow absorption or emission lines superimposed on the SN spectrum indicating a contribution from the host galaxy.
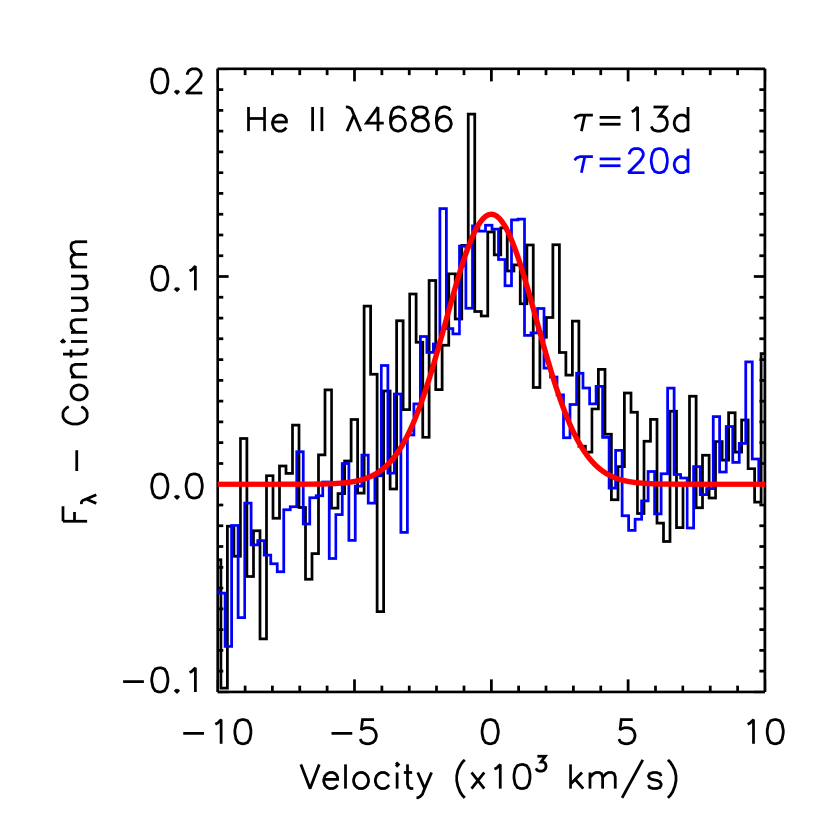
We measure the redshift of the SN to be from a Gaussian fit to the broad He II line in the 2008 May 1 and 8 spectra, with a full-width at half-maximum (FWHM) of 5500 km s-1. Detection of the high ionization line He II at 14 to 20 days after explosion in the SN rest frame requires high temperatures and ionization. This is similar to the case of Type II-P SN 2006bp for which He II was detected in the first few days after explosion, and was associated with outer layers of the SN ejecta that were flash ionized at shock breakout (Quimby et al., 2007b; Dessart et al., 2008).
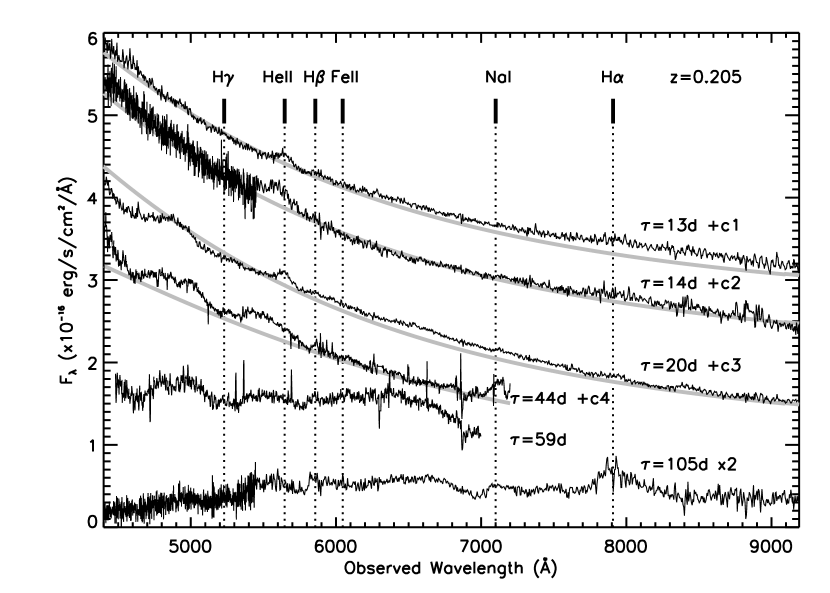
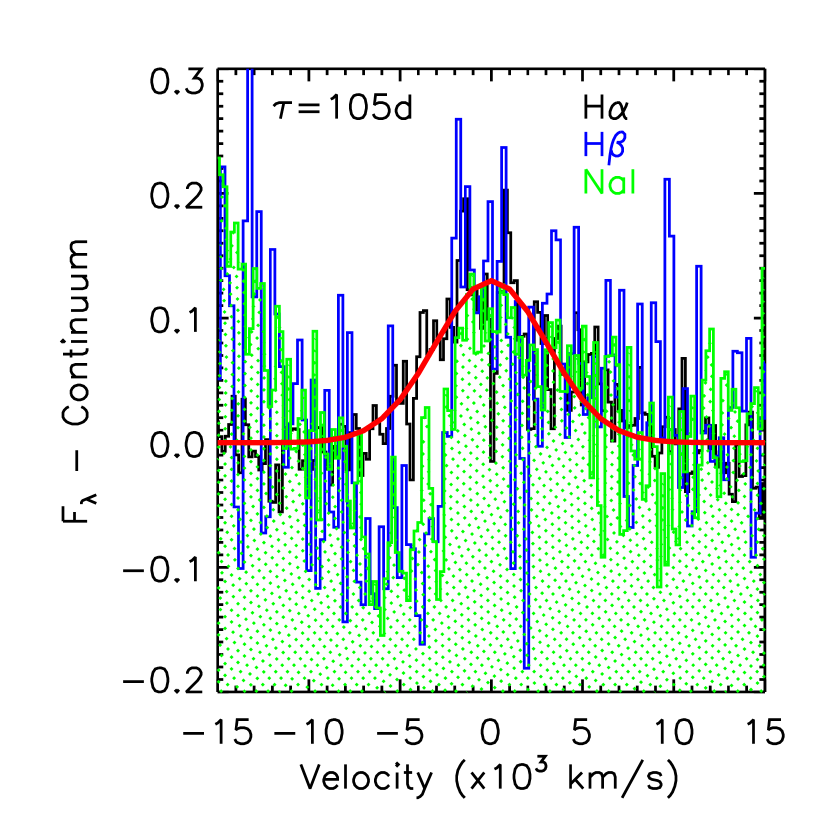
Strong Balmer lines and Na I did not appear until after more than rest-frame days after the explosion. The broad H line in the 2008 August 1 spectrum can be fitted with a single Gaussian with an FWHM = (1.02 km s-1. The spikes near the peak of H are residuals from a poor sky subtraction. The broad H flux is () erg s-1 cm-2, corresponding to a luminosity of erg s-1. The Na I and H lines have P Cygni line profiles with a blue-shifted absorption component with a minimum at a velocity of km s-1 and km s-1 respectively, and a blue absorption wing that extends out to km s-1. Figure 3 shows the broad emission lines, and their best fitting Gaussian profiles. The lack of a strong P Cygni absorption component in the H line and P Cygni profiles in the H and Na I lines is consistent with the bright Type II-L SNe 1979C and 1980K (Panagia et al. 1980; Branch et al. 1981; Uomoto & Kirshner 1986). The width of the H line is a measure of the expansion speed of the SN ejecta, while the absorption component of the P Cygni profile traces the outflow of the absorbing material in the line of sight. Both components indicate an SN blast wave velocity of 10,000 km s-1.
The error in the redshift from the Gaussian fit to the He II line does not reflect systematic errors that may be introduced if the He II line is blended or is not symmetric. The best-fitting SN II template in the Supernova Identification Code (SNID) database (Blondin & Tonry 2007) to the spectrum 105 days after explosion is SN II-L 1990K on day +53 (Cappellaro et al. 1995) at . A fit to all Type II-L SNe in the database gives the same best-fit result. If we restrict the fit to SN templates 1979C and 1980K (as is done by Miller et al. 2008c), a worse fit is found, with . The redshift measured from the best template fits is consistent with the redshift determined from the He II line, and so we use this redshift but change the error bars to reflect the uncertainties in the template fit, .
2.3. Host Galaxy
No host galaxy is detected in the pre-SN Sloan Digital Sky Survey (SDSS) Data Release 6 (DR6) images (Adelman-McCarthy et al. 2008), down to a limiting magnitude of . This constrains the host galaxy to be a dwarf galaxy with at . The closest galaxy detected by SDSS is located 83 North East of the SN, with and mag. At a redshift of , this angular separation corresponds to a projected separation of kpc, which is much larger than that would be expected if the galaxy were the SN host. During our 2008 August 1 spectrum, we placed the slit at a position angle so that this galaxy would fall in the slit, but we did not detect any emission lines from the galaxy that could be used to determine its redshift. The accuracy of the SN redshift could be greatly improved with future spectroscopic observations at the position of the SN, after the SN has faded significantly, when emission lines from the host galaxy that are now outshined by the SN may be detectable.
2.4. Swift Observations
We requested Target of Opportunity (ToO) observations with the Ultraviolet/Optical Telescope (UVOT; Roming et al. 2005) and X-Ray Telescope (XRT; Burrows et al. 2005) on board the Swift observatory (Gehrels et al. 2004) on 2008 May 14, with continued monitoring through 2008 September 2. The spectral energy distribution (SED) of the source on 2008 May 14 was well described by a blackbody with K for . The corresponding bolometric luminosity of erg s-1, in combination with the lack of X-ray emission indicative of persistent quasar activity, suggested that the source may have been a flare from the accretion of a tidally disrupted star around a central black hole of M⊙(Gezari & Halpern 2008). This interpretation was soon ruled out, however, by the rapidly cooling temperature of the emission seen in the later Swift observations, and the subsequent appearance of SN-like broad features as the spectra evolved (Miller et al. 2008a; Gezari et al. 2008b).
No X-ray source was detected in any of the individual XRT epochs. The count rate in a 23 extraction radius for the accumulated exposure time of 50.27 ks is counts s-1, and places a 3 upper limit to the 0.3-10 keV flux, using the standard energy conversion factor, of erg s-1 cm-2 s-1, which corresponds to a luminosity at of erg s-1, using a luminosity distance for of Mpc (= 70 km s-1 Mpc-1, =0.30 and =0.70).
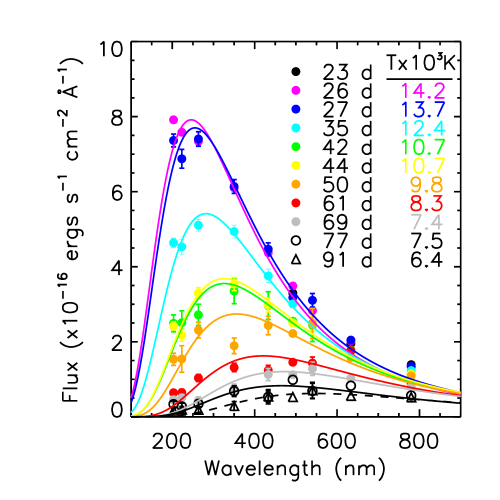
The UVOT magnitudes were measured with a 3 aperture, and an aperture correction based on an average point-spread function (PSF). We convert the magnitudes into flux densities using the count rate to flux conversions determined for the Pickle standard stars (Poole et al. 2008). The UVOT nm), nm), nm), nm), nm), and nm) band magnitudes are plotted in Figure 1 and listed in Table 3. In Figure 4 we show the SED of the SN over time from 200 to 800 nm measured by UVOT in combination with optical data points from the P60 data closest in time to the UVOT observations. The UVOT and bands are interchangeable with the Johnson and system, but the band has a bluer response than the Johnson band, and we make this distinction throughout the paper.
We fit the SEDs over time with a blackbody at , and fit temperatures starting days after explosion with 14,000 K, cooling down to 6400 K at days, with the corresponding blackbody radii expanding from cm to cm. These radii are times larger than a standard red supergiant photosphere, and mostly likely correspond to the radius of the expanding SN blast wave. We see evidence of an excess above of a pure blackbody in the band at early times ( observed days after explosion), that may be the effect of strong FeIV and FeIII features in that region, seen in the spectra of SN II-P 2006bp at similar photospheric temperatures (Dessart et al. 2008).
3. Results
3.1. Comparison with Type II SNe
The high signal-to-noise (S/N) MDM 1.3m -band observations, with mag , measure a linear decay from 9 to 53 d after the peak of 2.95 mag (100 days)-1, or 3.55 mag (100 days)-1 in the SN rest frame. This decay rate is just above the transition of the average decay-rates in the first 100 days after maximum from Type II-plateau (II-P) to Type II-linear (II-L) classes of SNe defined by Patat et al. (1994) to be 3.5 mag (100 days)-1 in the band (at the band is close to the rest-frame band). This classification is nonexclusive, however, since Patat et al. (1994) point out that there is a continuum in rates between the plateau and linear subclasses. Type II-L SNe are on average brighter than Type II-P SNe, and II-L SNe appear to have a bimodal distribution of absolute peak magnitudes, with a subclass of bright II-Ls with (Richardson et al., 2002). Yet, even the bright II-L SNe are still 3 mag fainter than the peak magnitude of SNe 2008es.
The Swift and MDM -band observations show evidence of a flattening of the optical light curve rest-frame days after maximum, with a slope that is consistent with the 56Co decay rate of 0.98 mag (100 days)-1 (shown with a dotted line in Figure 1, stretched in time to match the time dilation of SN 2008es). The estimated luminosity at the time of the MDM -band data point at 104 days after explosion in the SN rest frame, is erg s-1 (a factor of 3 below the luminosity on day 75 in the SN rest frame), and using the expression, M⊙ erg s-1 (Sutherland & Wheeler, 1984), implies an upper limit to the initial 56Ni mass of M⊙, which is close to the upper end of the range masses measured for Type II SNe (e.g., 0.3 M⊙for SN 1992am; Schmidt et al. 1994).
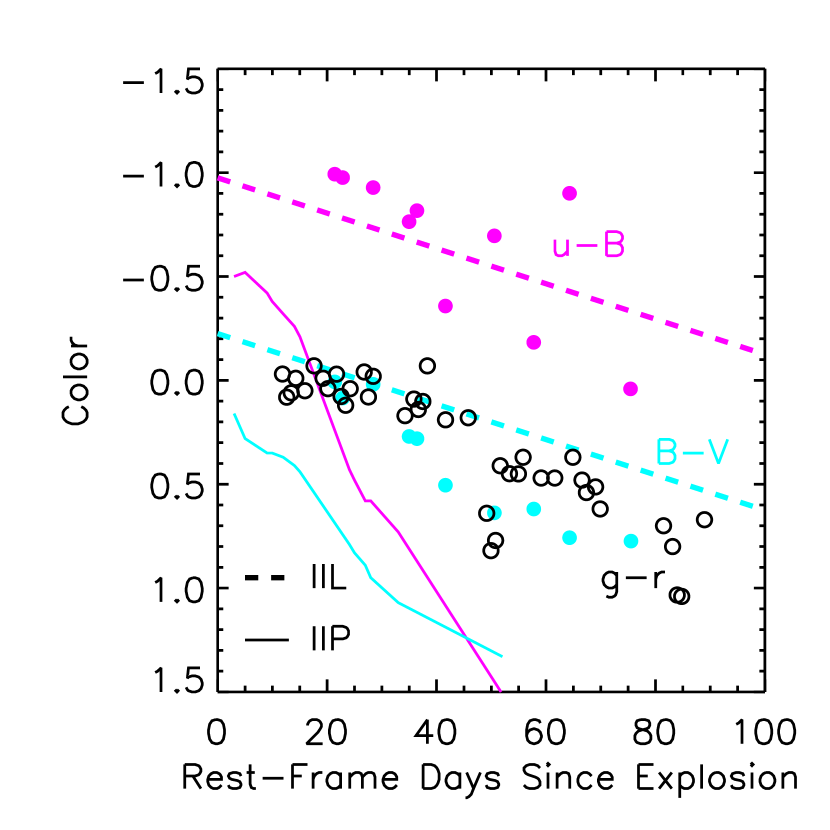
In Figure 5, we compare the , , and colors of SN 2008es over time to the evolution of the and colors of SN II-L 1979C which have a linear slope of mag (100 days)-1 (Panagia et al. 1980). The -correction at the redshift of SN 2008es makes the color close to rest-frame . We also show the and light curves of SN II-P 2006bp measured by Swift (Immler et al. 2007). All curves are shown in days since explosion in the SN rest frame. The light curve of SN 2008es has a much slower evolution of the color than seen in prototypical Type II-P SN 2006bp, and is in closer agreement with the colors and linear slopes of prototypical bright Type II-L SN 1979C.
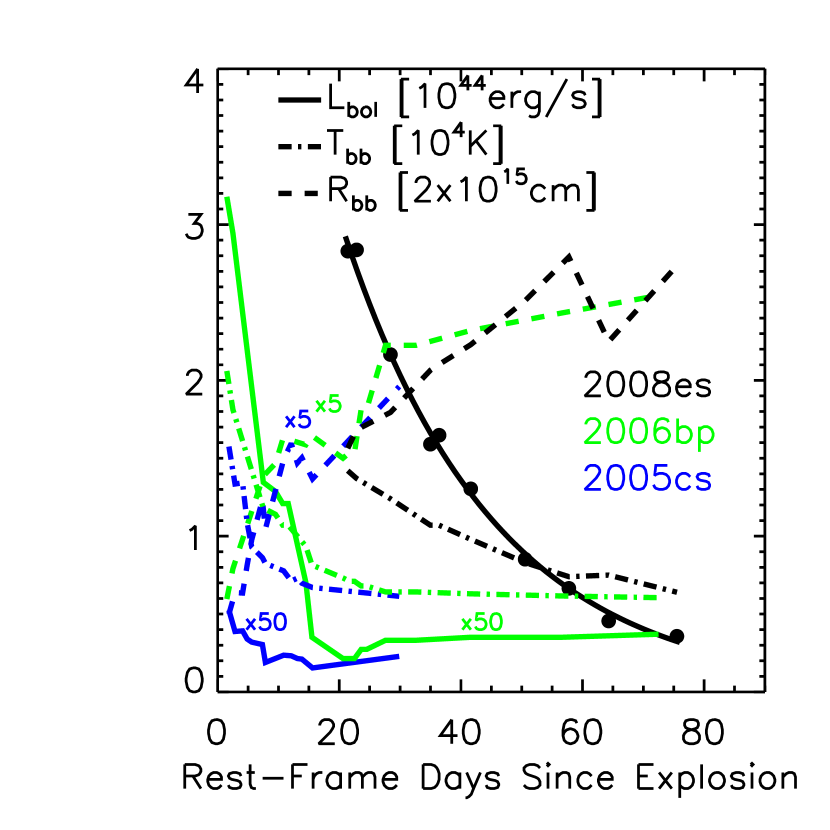
We estimate the bolometric luminosity of SN 2008es over time (as shown in Figure 6) using the blackbody curve fits shown in Figure 4. The luminosity during the optical peak, 23 days after the explosion in the SN rest frame, is erg s-1, and decays exponentially as erg s-1, where erg s-1, , and is the rest-frame days since explosion. We estimate the total energy radiated by integrating under the curve from day 21 to 75 in the SN rest frame to get erg, a value comparable to the radiated energy of the extreme SN 2006gy (Ofek et al. 2007; Smith et al. 2007) which emitted erg s-1 in the first two months. These radiated energies, so close to the total kinetic energy produced in a core-collapse explosion (typically in the range of erg), require an efficient conversion of the kinetic energy of the SN ejecta into radiation.
Figure 6 shows the evolution of the bolometric luminosity of SN 2008es in comparison to two Type II-P SNe with detailed non-LTE modeling of their photometry and spectra by Dessart et al. (2008): SNe 2005cs and 2006bp. The luminosity curves have been scaled by a factor of 50 for comparison with SN 2008es. The behavior of SN 2008es is markedly different than the SNe II-P, with a factor of 50 greater luminosity at 23 days after explosion compared to the peak luminosity of SN 2006bp that occurs a couple of days after explosion, and with a much slower decline in luminosity over 75 days in comparison to days in SNe 2005cs and 2006bp. Figure 6 also shows and for SN 2008es in comparison to the Type II-P SNe 2005cs and 2006bp, with the radii of the Type II-P SNe scaled up by a factor of 5 for comparison. In contrast to SN 2008es which has K at 23 days after explosion, the photospheric temperatures of the Type II-P SNe have already cooled to 6000 K by day 20, and their photospheric radii are times smaller. It is clear that there is a different mechanism powering the long-lived, and extremely luminous emission from SN 2008es.
3.2. Interaction with CSM
Given the estimate of the expansion speed, , from the broad H line of 10,000 km s-1, the radius of the ejecta at the time of the peak of the optical light curve, days after explosion in the SN rest frame, is expected to be cm, which is in good agreement with the radius of the blackbody fit at that time ( cm). If the luminosity during the optical maximum is powered by interaction with the CSM, this requires a density of order cm-3, where is the mean mass per particle (2.1 g for H+He) and we use cm. This implies an enclosed mass within of M⊙, and corresponds to a mass-loss rate of /10 km s-1) M⊙yr-1, where is the velocity of the stellar wind ( km s-1 for a red supergiant progenitor).
We can place an upper limit on the progenitor’s mass-loss rate if we assume that X-ray emission is produced by the interaction of the SN shock with the ambient CSM. In the forward shock, a H+He plasma will be heated to K (Chevalier & Fransson 2003), where is the ejecta density parameter (in the range of ) and is the shock velocity in km s-1, and will produce an X-ray luminosity of erg s-1 (Immler et al. 2002), where is the stellar wind speed in units of 10 km s-1, is the time since explosion in days, is the progenitor’s mass-loss rate in units of 10-6 M⊙yr-1, and is the cooling function for an optically thin heated plasma, where is the free-free Gaunt factor, and is the temperature in units of K. Using the width of the broad H line to estimate , and using , the upper limit on keV implies that M⊙yr-1. This upper limit to the mass-loss rate is still a factor of below what is required to power the observed peak bolometric luminosity purely by interaction with the CSM.
3.3. Comparison with Models
The -band light curve and colors of bright SN II-L 1979C were successfully modeled by Blinnikov & Bartunov (1993) with a red supergiant progenitor with an extended structure ( R⊙), a small hydrogen envelope mass ( M⊙), and a dense superwind with a mass-loss rate of M⊙yr-1. In this model, the large peak luminosity of SN 1979C () is produced by the dense stellar wind that reprocesses the UV photons produced at shock breakout, and can be boosted up to by increasing the mass-loss rate to M⊙yr-1. Their model predicts a steep drop in luminosity 50 days after explosion, when the recombination (in the diffusion regime) reaches the silicon core. After this point, the light curve has an extended tail powered by radioactive decay and/or emission from the shock propagating into the CSM. These predictions are consistent with the sharp drop and subsequent 56Co decay slope tentatively detected in the -band light curve of SN 2008es. The Blinnikov & Bartunov (1993) model also explains the absence of the absorption component in H, which is due to the fact that at late stages the temperature inside the dense envelope is lower than the shock wave temperature.
Young et al. (2005) find these values for the radius and superwind unrealistic, and prefer a model in which the bright luminosity at the early phase of the SN light curve is the result of an optical afterglow from a GRB jet interacting with the progenitor’s hydrogen envelope. The main problem with this model is that the optical afterglow emission produced from the external shocks created by the interaction of the relativistic jet with the H envelope will emit nonthermal synchotron radiation, which is in direct contradiction with the cooling blackbody SED of SN 2008es.
Another possibility, favored by Miller et al. (2008c), is that the luminosity is powered by the interaction of the SN blast wave with a massive circumstellar shell that was ejected in an episodic eruption (Smith & McCray 2007). Similarly, the luminosity could be powered by an interaction between such shells (Woosley et al. 2007). Both of these models produce their luminosity via the dense shell that decelerates the blast wave, and converts the bulk kinetic energy into radiation through shocks. The intermediate-width (a few thousand km s-1) P Cygni lines produced from the dense postshock gas, and the slow escape of radiation due to photon diffusion of the thermal energy through the opaque shell in these models with massive shells are not consistent with the broad, symmetric H line emission, and relatively fast rise time of SN 2008es.
If the bolometric luminosity of SN 2008es was powered solely by thermalization of gamma rays from radioactive cobalt decay, then the luminosity at would require 25 M⊙ of 56Ni to be synthesized in the explosion. This is 3 orders of magnitude larger than that typically produced in Type II SNe, and much larger than the ejecta mass which is expected to be less than 5 M⊙ to avoid a plateau from H recombination in the optical light curve. Although it is possible for such a large amount of 56Ni to be produced by an extremely massive progenitor star ( M⊙) that underwent a pair-instability supernova (Ober et al. 1983), we already find evidence for a transition to a radioactive heating-dominated light curve at late times, which suggests that the light curve was not dominated by radioactive decay near the peak. Furthermore, the calculations of Scannapieco et al. (2005) predict a long, slow rise to maximum, and slow expansion speeds of km s-1, which is neither consistent with the 23 days rise to maximum nor the 10,000 km s-1 expansion speed seen in SN 2008es.
Given the contradictions with the more exotic scenarios discussed above, the extreme luminosity of Type II-L SN 2008es seems most likely to be on the bright end of a range of luminosities and light curves possible with variations of progenitor star H envelope and stellar wind parameters presented in the models by Blinnikov & Bartunov (1993). However, even the largest red supergiant stars have radii R⊙(Levesque et al. 2005), thus a progenitor star with the extreme extended structure assumed by Blinnikov & Bartunov (1993) is problematic. Type II-L SN light curves with peak magnitudes of were reproduced by Swartz et al. (1991) for core-collapse models with more realistic envelope radii (1200 R⊙). More detailed modeling is needed to determine if the required parameters for SN 2008es are consistent with stellar evolution.

4. Conclusion
The overluminous SN 2008es ( is the second most luminous SN observed, and in the same league as the extreme SNe 2005ap, 2006gy, and 2006tf, which had peak visual magnitudes of , , and , respectively. In Figure 7, we compare the absolute -band light curves of the 4 SNe (all discovered by the ROTSE-IIIb telescope) in rest-frame days since the time of explosion. SN 2006gy and 2006tf are classified spectroscopically as Type IIn SNe because of their narrow peaked P Cygni Balmer lines (Ofek et al. 2007; Smith et al. 2008), although with deviations from the smooth profiles typical of SNe IIn in SN 2006gy (Smith et al. 2007). The time of explosion for SN 2005ap is estimated by Quimby et al. (2007a) to be weeks before maximum. The time of explosion for SN 2006tf is poorly constrained (Smith et al. 2008), so for comparison we assume that it takes the same time to reach the peak as SN 2008es.
Of the SNe in the same luminosity class, the light curve of SN 2008es is most like SN 2005ap, the most luminous SN ever observed (Quimby et al., 2007a). Interestingly, SN 2005ap also has a dwarf galaxy host, with . However, SN 2005ap does differ from SN 2008es in the fact that it demonstrated absorption features at early times, as well as P Cygni absorption in its broad H profile. This is not consistent with the spectra of bright II-L SNe which have decreasing P Cygni absorption with increasing luminosity (Patat et al. 1994). The extended envelope/wind model is problematic for SN 2005ap, since it would be hard to produce early absorption features without corresponding emission. The extreme luminosity and linear decay of SN 2005ap were attributed instead to a collision of the SN ejecta with a dense circumstellar shell, a GRB explosion buried in a H envelope, or a pair-instability eruption powered by radioactive decay (Quimby et al., 2007a).
The peak luminosity, linear decay, and spectroscopic features of SN 2008es place it in a subclass of ultra-bright Type II-L SNe. The light curve and SED of SN 2008es, measured in detail from the UV through the optical, point toward a core-collapse explosion of a nonstandard progenitor star with a super wind and extended envelope. Wide-field optical synoptic surveys such as the ROTSE-III Supernova Verification Project, Pan-STARRS, and LSST will continue to explore the large parameter space of core-collapse explosions, and increase our understanding of the effects of variations in progenitor star properties and environments.
Note Added in Proof: More recent -band observations from Swift, as well as measurements from the MDM 2.4m, reveal that the slope of the light curve is steeper than the decay rate of 56Co up to 145 rest-frame days after maximum. Therefore, radioactive decay must not yet be the dominant source of the luminosity from the SN, and the inferred upper limit on the initial 56Ni mass is securely within the range of normal Type II SNe (Hamuy 2003).
References
- Adelman-McCarthy et al. (2008) Adelman-McCarthy, J. K., et al. 2008, ApJS, 175, 297
- Akerlof et al. (2003) Akerlof, C. W., et al. 2003, PASP, 115, 132
- Barbon et al. (1979) Barbon, R., Ciatti, F., & Rosino, L. 1979, A&A, 72, 287
- Blinnikov & Bartunov (1993) Blinnikov, S. I. & Bartunov, O. S. 1993, A&A, 273, 106
- Blondin & Tonry (2007) Blondin, S., & Tonry, J. L. 2007, ApJ, 666, 1024
- Branch et al. (1981) Branch, D., Falk, S. W., Uomoto, A. K., Wills, B. J., McCall, M. L., & Rybski, P. 1981, ApJ, 244, 780
- Burrows et al. (2005) Burrows, D. N., et al. 2005, Space Sci. Rev., 120, 165
- Cappellaro et al. (1995) Cappellaro, E., Danziger, I. J., della Valle, M., Gouiffes, C., & Turatto, M. 1995, A&A, 293, 723
- Cenko et al. (2006) Cenko, S. B., et al. 2006, PASP, 118, 1396
- Chevalier & Fransson (2003) Chevalier, R. A. & Fransson, C. 2003, in Supernovae and Gamma-Ray Bursters, ed. K. W. Weiler (Berlin: Springer), 171
- Chornock et al. (2008) Chornock, R., Miller, A. A., Bloom, J. S., & Perley, D. A. 2008, ATel, 1644, 1
- Dessart et al. (2008) Dessart, L., et al. 2008, ApJ, 675, 644
- Falk & Arnett (1977) Falk, S. W., & Arnett, W. D. 1977, ApJS, 33, 515
- Gezari et al. (2008a) Gezari, S., et al. 2008a, ApJ, 683, L131
- Gezari et al. (2008b) Gezari, S., et al. 2008b, ATel, 1578, 1
- Gezari & Halpern (2008) Gezari, S. & Halpern, J. P. 2008, ATel, 1524, 1
- Gehrels et al. (2004) Gehrels, N., et al. 2004, ApJ, 611, 1005
- Hamuy (2003) Hamuy, M. 2003, ApJ, 582, 905
- Hamuy et al. (1998) Hamuy, M., Suntzeff, N. B., Gonzalez, R., & Martin, G. 1988, AJ, 95, 63
- Immler et al. (2002) Immler, S., Wilson, A. S., & Terashima, Y. 2002, ApJ, 573, L27
- Immler et al. (2007) Immler, S., et al. 2007, ApJ, 665, 435
- Landolt (1992) Landolt, A. U. 1992, AJ, 104, 340
- Levesque et al. (2005) Levesque, E. M., Massey, P., Olsen, K. A. G., Plez, B., Josselin, E., Maeder, A., & Meynet, G. 2005, ApJ, 628, L973
- Litvinova & Nadyozhin (1983) Litvinova, I. Iu., & Nadyozhin, D. K. 1983, Ap&SS, 89, 89
- Miller et al. (2008a) Miller, A. A., et al. 2008a, ATel, 1576, 1
- Miller et al. (2008b) Miller, A. A., et al. 2008b, ATel, 1593, 1
- Miller et al. (2008c) Miller, A. A., et al. 2008c, ApJ, in press (arXiv:0808.2193)
- Ober et al. (1983) Ober, W. W., El Eid, M. F., & Fricke, K. J. 1983, A&A, 119, 61
- Ofek et al. (2007) Ofek, E. O., et al. 2007, ApJ, 659, 43
- Panagia et al. (1980) Panagia, N., et al. 1980, MNRAS, 192, 861
- Patat et al. (1994) Patat, F., Barbon, R., Cappallero, E., & Turatto, M. 1994, A&A, 282, 731
- Poole et al. (2008) Poole, T. S., et al. 2008, MNRAS, 383, 627
- Quimby et al. (2007a) Quimby, R. M., Aldering, G., J. C. Wheeler, Höflich, P., Akerlof, C. W., & Rykoff, E. S. 2007a, ApJ, 668, L99
- Quimby et al. (2007b) Quimby, R. M., Wheeler, J. C., Höflich, P., Akerlof, C. W., Brown, P. J., & Rykoff, E. S. 2007b, /apj, 666, 1093
- Richardson et al. (2002) Richardson, D., Branch, D., Casebeer, D., Millard, J., Thomas, R. C., & Baron, E. 2002, AJ, 123, 745
- Richmond et al. (1994) Richmond, M. W., et al. 1994, AJ, 107, 1022
- Roming et al. (2005) Roming, P. W. A., et al. 2005, Space Sci. Rev., 120, 95
- Scannapieco et al. (2005) Scannapieco, E., Madau, P., Woosley, S. E., Heger, A., & Ferrara, A. 2005, ApJ, 633, 1031
- Schawinski et al. (2008) Schawinski, K., et al. 2008, Science, 321, 223
- Schlegel et al. (1998) Schlegel, D. J., Finkbeiner, D. P., & Davis, M. 1998, ApJ, 500, 525
- Schmidt et al. (1993) Schmidt, B. P., et al. 1993, Nature, 364, 600
- Schmidt et al. (1994) Schmidt, B.P., et al. 1994, AJ, 107, 1444
- Smith & McCray (2007) Smith, N. & McCray, R. 2007, ApJ, 671, L17
- Smith et al. (2007) Smith, N., et al. 2007, ApJ, 666, 116
- Smith et al. (2008) Smith, N., et al. 2008, ApJ, 686, 467
- Sutherland & Wheeler (1984) Sutherland, P. G. & Wheeler, J. C. 1984, ApJ, 280, 282
- Swartz et al. (1991) Swartz, D. A., Wheeler, J. C., & Harkness, R. P. 1991, ApJ, 374, 266
- Turatto et al. (1993) Turatto, M., et al. 1993, MNRAS, 262, 128
- Uomoto & Kirshner (1986) Uomoto, A., & Kirshner, R. P. 1986, ApJ, 308, 685
- Woosley et al. (2000) Woosley, S. E., Blinnikov, S., & Heger, A. 2007, Nature, 450, 390
- Young & Branch (1989) Young, T. R. & Branch, D. 1989, ApJ, 342, L79
- Young et al. (2005) Young, T. R., Smith, D., & Johnson, T. A. 2005, ApJ, 625, L90
- Yuan et al. (2008) Yuan, F., Quimby, R., McKay, T., Chamarro, D., Sisson, M. D., Akerlof, C., & Wheeler, J. C. 2008, ATel, 1515, 1
| Telescope/Band | MJDaaDays in JD-2,400,000.5 | MagnitudebbROTSE-IIIb upper limits shown in parentheses. P60, MDM, and P200 magnitudes corrected for a Galactic extinction of E()=0.012 mag (Schlegel et al. 1998). | Error |
|---|---|---|---|
| ROTSE-IIIb | 54555.1 | (19.48) | |
| 54556.2 | (19.51) | ||
| 54559.1 | (18.32) | ||
| 54562.1 | (19.21) | ||
| 54567.4 | (18.93) | ||
| 54569.2 | (18.69) | ||
| 54571.2 | (18.25) | ||
| 54573.2 | (18.46) | ||
| 54575.2 | (18.54) | ||
| 54579.2 | (18.27) | ||
| 54580.2 | (18.34) | ||
| 54582.2 | 18.36 | 0.10 | |
| 54584.2 | 18.09 | 0.16 | |
| 54585.2 | 18.10 | 0.07 | |
| 54591.2 | 18.02 | 0.18 | |
| 54592.2 | 17.96 | 0.22 | |
| 54594.2 | 17.78 | 0.10 | |
| 54596.2 | 17.79 | 0.09 | |
| 54597.1 | 17.66 | 0.21 | |
| 54604.2 | 17.95 | 0.15 | |
| 54605.2 | 17.91 | 0.18 | |
| 54606.2 | 17.98 | 0.08 | |
| 54608.3 | 18.05 | 0.33 | |
| 54610.2 | 17.87 | 0.05 | |
| 54618.2 | 17.98 | 0.06 | |
| 54619.2 | 18.14 | 0.09 | |
| 54620.2 | 18.09 | 0.09 | |
| 54622.2 | 18.21 | 0.15 | |
| 54624.2 | 18.50 | 0.16 | |
| 54626.2 | 18.14 | 0.14 | |
| 54627.2 | 18.60 | 0.16 | |
| P60/ | 54588.3 | 17.95 | 0.06 |
| 54589.2 | 17.98 | 0.06 | |
| 54590.2 | 17.94 | 0.06 | |
| 54591.2 | 17.91 | 0.06 | |
| 54593.2 | 17.89 | 0.04 | |
| 54595.2 | 17.82 | 0.06 | |
| 54597.2 | 17.83 | 0.08 | |
| 54598.3 | 17.84 | 0.08 | |
| 54600.2 | 17.77 | 0.10 | |
| 54601.2 | 17.87 | 0.13 | |
| 54602.2 | 17.91 | 0.05 | |
| 54603.2 | 17.86 | 0.05 | |
| 54606.3 | 17.86 | 0.07 | |
| 54607.2 | 17.89 | 0.05 | |
| 54608.2 | 17.93 | 0.07 | |
| 54615.2 | 18.11 | 0.08 | |
| 54617.2 | 18.07 | 0.06 | |
| 54618.2 | 18.13 | 0.06 | |
| 54619.2 | 18.19 | 0.08 | |
| 54620.2 | 18.13 | 0.08 | |
| 54624.2 | 18.26 | 0.08 | |
| 54629.2 | 18.42 | 0.11 | |
| 54633.2 | 18.59 | 0.10 | |
| 54634.2 | 18.77 | 0.12 | |
| 54635.2 | 18.72 | 0.15 | |
| 54636.2 | 18.69 | 0.15 | |
| 54638.2 | 18.78 | 0.12 | |
| 54640.2 | 18.81 | 0.08 | |
| 54641.2 | 18.78 | 0.08 | |
| 54645.2 | 19.00 | 0.10 | |
| 54648.2 | 19.05 | 0.12 | |
| 54652.2 | 19.14 | 0.15 | |
| 54654.2 | 19.29 | 0.13 | |
| 54655.2 | 19.36 | 0.16 | |
| 54657.2 | 19.57 | 0.20 | |
| 54658.2 | 19.82 | 0.52 | |
| 54672.2 | 19.99 | 0.25 | |
| 54674.2 | 20.15 | 0.30 | |
| 54675.2 | 20.43 | 0.25 | |
| 54676.2 | 20.49 | 0.19 | |
| 54681.2 | 20.50 | 0.28 | |
| 54688.2 | 20.73 | 0.40 | |
| P60/ | 54588.3 | 18.00 | 0.06 |
| 54590.2 | 17.90 | 0.06 | |
| 54591.2 | 17.94 | 0.06 | |
| 54593.2 | 17.86 | 0.06 | |
| 54595.2 | 17.91 | 0.08 | |
| 54597.2 | 17.86 | 0.08 | |
| 54598.3 | 17.82 | 0.08 | |
| 54600.2 | 17.82 | 0.10 | |
| 54602.2 | 17.81 | 0.16 | |
| 54603.2 | 17.84 | 0.08 | |
| 54606.3 | 17.92 | 0.10 | |
| 54607.2 | 17.83 | 0.08 | |
| 54608.2 | 17.97 | 0.12 | |
| 54615.2 | 17.96 | 0.08 | |
| 54617.2 | 18.00 | 0.06 | |
| 54618.2 | 18.01 | 0.06 | |
| 54620.2 | 18.22 | 0.14 | |
| 54624.2 | 18.09 | 0.08 | |
| 54629.2 | 18.26 | 0.07 | |
| 54633.2 | 18.28 | 0.08 | |
| 54634.2 | 18.33 | 0.09 | |
| 54635.2 | 18.30 | 0.08 | |
| 54636.2 | 18.30 | 0.11 | |
| 54638.3 | 18.35 | 0.10 | |
| 54640.2 | 18.38 | 0.06 | |
| 54641.3 | 18.43 | 0.06 | |
| 54645.2 | 18.55 | 0.08 | |
| 54648.2 | 18.60 | 0.08 | |
| 54652.2 | 18.79 | 0.15 | |
| 54654.2 | 18.83 | 0.08 | |
| 54655.2 | 18.84 | 0.09 | |
| 54658.2 | 19.22 | 0.30 | |
| 54672.2 | 19.31 | 0.15 | |
| 54674.2 | 19.37 | 0.15 | |
| 54676.2 | 19.47 | 0.15 | |
| 54681.2 | 19.85 | 0.20 | |
| 54688.2 | 19.95 | 0.29 | |
| 54696.2 | 20.23 | 0.41 | |
| P60/ | 54588.3 | 18.13 | 0.08 |
| 54590.2 | 17.95 | 0.06 | |
| 54591.2 | 17.92 | 0.08 | |
| 54593.2 | 17.81 | 0.05 | |
| 54595.2 | 17.88 | 0.06 | |
| 54597.2 | 17.77 | 0.06 | |
| 54600.2 | 17.81 | 0.07 | |
| 54603.2 | 17.80 | 0.08 | |
| 54606.3 | 17.87 | 0.10 | |
| 54607.2 | 17.82 | 0.09 | |
| 54608.2 | 17.90 | 0.10 | |
| 54615.3 | 17.98 | 0.08 | |
| 54617.2 | 17.97 | 0.10 | |
| 54618.2 | 17.98 | 0.09 | |
| 54620.2 | 18.00 | 0.08 | |
| 54624.2 | 18.03 | 0.08 | |
| 54629.2 | 18.12 | 0.08 | |
| 54633.2 | 18.15 | 0.09 | |
| 54634.2 | 18.16 | 0.07 | |
| 54635.2 | 18.26 | 0.08 | |
| 54636.2 | 18.24 | 0.09 | |
| 54638.3 | 18.31 | 0.10 | |
| 54640.2 | 18.35 | 0.06 | |
| 54641.3 | 18.35 | 0.07 | |
| 54645.2 | 18.36 | 0.07 | |
| 54645.2 | 18.36 | 0.07 | |
| 54655.2 | 18.74 | 0.09 | |
| 54657.2 | 18.63 | 0.30 | |
| 54658.2 | 18.84 | 0.25 | |
| 54676.2 | 19.18 | 0.14 | |
| 54681.2 | 19.39 | 0.17 | |
| 54688.2 | 19.64 | 0.20 | |
| MDM/ | 54611.2 | 17.80 | 0.01 |
| 54614.1 | 17.89 | 0.02 | |
| 54617.1 | 17.89 | 0.01 | |
| 54621.1 | 18.01 | 0.01 | |
| 54625.2 | 18.14 | 0.01 | |
| 54626.2 | 18.17 | 0.01 | |
| 54627.2 | 18.19 | 0.01 | |
| 54628.2 | 18.23 | 0.01 | |
| 54629.2 | 18.23 | 0.01 | |
| 54630.2 | 18.28 | 0.01 | |
| 54631.2 | 18.32 | 0.03 | |
| 54632.2 | 18.35 | 0.01 | |
| 54633.2 | 18.38 | 0.01 | |
| 54635.2 | 18.41 | 0.02 | |
| 54637.2 | 18.48 | 0.01 | |
| 54638.2 | 18.53 | 0.01 | |
| 54639.2 | 18.56 | 0.01 | |
| 54640.2 | 18.60 | 0.01 | |
| 54648.2 | 18.84 | 0.02 | |
| 54655.2 | 19.10 | 0.02 | |
| 54699.1 | 20.70 | 0.05 | |
| P200/ | 54701.2 | 21.23 | 0.12 |
| 54701.2 | 21.52 | 0.16 | |
| P200/ | 54700.1 | 20.81 | 0.10 |
| 54700.2 | 20.82 | 0.06 | |
| 54701.2 | 20.64 | 0.06 | |
| 54701.2 | 20.82 | 0.06 | |
| P200/ | 54700.1 | 20.40 | 0.16 |
| 54700.1 | 20.17 | 0.10 | |
| 54700.2 | 20.15 | 0.03 | |
| 54701.1 | 20.06 | 0.07 | |
| 54701.1 | 20.14 | 0.04 |
| MJDaaDays in JD-2,400,000.5 | Telescope/Instrument | Exposure Time (s) | GrismbbValues for the blue and red side of P200/DBSP are labeled (b) and (r). | Slit | Resolving PowerbbValues for the blue and red side of P200/DBSP are labeled (b) and (r). |
|---|---|---|---|---|---|
| 54586.8 | HET/LRS | 2x600 | 300 l/mm | 20 | 300 |
| 54587.8 | P200/DBSP | 2x1200 | 600/4000 (b), 158/7500 (r) | 10 | 1800 (b), 700 (r) |
| 54593.8 | HET/LRS | 2x450 | 300 l/mm | 20 | 300 |
| 54618.2 | HET/LRS | 3x900 | 600 l/mm | 20 | 650 |
| 54632.2 | HET/LRS | 3x900 | 600 l/mm | 20 | 650 |
| 54678.7 | P200/DBSP | 2x1500 | 600/4000 (b), 158/7500 (r) | 10 | 1800 (b), 700 (r) |
| Band | MJDaaDays in JD-2,400,000.5 | MagnitudebbMagnitudes corrected for a Galactic extinction of E()=0.012 mag (Schlegel et al. 1998). | Error |
|---|---|---|---|
| 54599.8 | 17.05 | 0.03 | |
| 54601.5 | 17.13 | 0.03 | |
| 54608.2 | 17.63 | 0.03 | |
| 54616.1 | 18.30 | 0.09 | |
| 54617.9 | 18.34 | 0.05 | |
| 54624.1 | 18.83 | 0.11 | |
| 54634.9 | 19.77 | 0.10 | |
| 54643.6 | 20.15 | 0.14 | |
| 54651.5 | 20.48 | 0.20 | |
| 54664.9 | 21.26 | 0.29 | |
| 54599.8 | 16.81 | 0.04 | |
| 54601.5 | 16.91 | 0.04 | |
| 54608.2 | 17.37 | 0.04 | |
| 54616.2 | 18.01 | 0.12 | |
| 54617.9 | 18.16 | 0.07 | |
| 54624.2 | 18.54 | 0.23 | |
| 54634.9 | 19.48 | 0.13 | |
| 54643.6 | 19.74 | 0.16 | |
| 54651.5 | 20.40 | 0.27 | |
| 54665.0 | 20.76 | 0.30 | |
| 54599.8 | 16.91 | 0.04 | |
| 54601.5 | 16.90 | 0.03 | |
| 54608.2 | 17.30 | 0.04 | |
| 54616.1 | 17.99 | 0.10 | |
| 54617.9 | 17.78 | 0.05 | |
| 54624.1 | 18.16 | 0.11 | |
| 54634.9 | 19.04 | 0.10 | |
| 54643.6 | 19.97 | 0.21 | |
| 54651.4 | 20.23 | 0.28 | |
| 54664.9 | 20.90 | 0.40 | |
| 54599.8 | 16.82 | 0.03 | |
| 54601.5 | 16.81 | 0.03 | |
| 54608.2 | 17.05 | 0.03 | |
| 54616.1 | 17.47 | 0.08 | |
| 54617.9 | 17.41 | 0.04 | |
| 54624.1 | 18.09 | 0.10 | |
| 54634.9 | 18.48 | 0.08 | |
| 54643.6 | 19.10 | 0.13 | |
| 54651.4 | 19.19 | 0.16 | |
| 54664.9 | 20.12 | 0.31 | |
| 54599.8 | 17.81 | 0.04 | |
| 54601.5 | 17.79 | 0.04 | |
| 54608.2 | 17.97 | 0.04 | |
| 54616.1 | 18.23 | 0.09 | |
| 54617.9 | 18.23 | 0.05 | |
| 54624.1 | 18.45 | 0.09 | |
| 54634.9 | 19.18 | 0.08 | |
| 54643.6 | 19.28 | 0.11 | |
| 54651.5 | 20.09 | 0.26 | |
| 54664.9 | 20.08 | 0.20 | |
| 54698.9 | 21.37 | 0.21 | |
| 54599.8 | 17.80 | 0.06 | |
| 54601.5 | 17.70 | 0.06 | |
| 54608.2 | 17.96 | 0.07 | |
| 54616.2 | 17.96 | 0.14 | |
| 54617.9 | 17.94 | 0.07 | |
| 54624.2 | 17.94 | 0.16 | |
| 54634.9 | 18.54 | 0.10 | |
| 54643.6 | 18.66 | 0.12 | |
| 54651.5 | 19.33 | 0.23 | |
| 54665.0 | 19.31 | 0.23 | |
| 54681.6 | 20.44 | 0.24 | |
| 54696.5 | 20.43 | 0.16 | |
| 54710.8 | 21.08 | 0.21 |