11email: leticia@iac.es 22institutetext: NASA Ames Research Center, MS 245-6, Moffett Field, CA 94035, USA 33institutetext: SETI Institute, 515 N. Whisman Road, Mountain View, CA 94043, USA 44institutetext: Department of Physics and Astronomy, The University of Western Ontario, London, ON N6A 3K7, Canada 55institutetext: NASA Ames Research Center, MS 245-3, Moffett Field, CA 94035, USA
A mid-infrared study of H ii regions in the Magellanic
Clouds:
N88 A and N160 A
Abstract
Aims. To show the importance of high-spatial resolution observations of H ii regions when compared with observations obtained with larger apertures such as ISO, we present mid-infrared spectra of two Magellanic Cloud H ii regions, N88 A and N160 A.
Methods. We obtained mid-infrared ( m), long-slit spectra with TIMMI2 on the ESO 3.6 m telescope. These are combined with archival spectra obtained with the Infrared Spectrograph (IRS) onboard the Spitzer Space Telescope, and are compared with the low-spatial resolution ISO-SWS data. An inventory of the spectra in terms of atomic fine-structure lines and molecular bands is presented.
Results. Concerning N88 A, an isolated H ii region with no adjacent infrared sources, the observations indicate that the line fluxes observed by ISO-SWS and Spitzer-IRS come exclusively from the compact H ii region of about 3″ in diameter. This is not the case for N160 A, which has a more complex morphology. We have spectroscopically isolated for the first time the individual contributions of the three components of N160 A, two high-excitation blobs, A1 and A2, and the young stellar object N160 A-IR. In addition, extended [S iv] emission is observed with TIMMI2 and is most likely associated with the central star cluster located between A1 and A2. We show the value of these high-spatial resolution data in determining source characteristics, such as the degree of ionization of each high-excitation blob or the bolometric luminosity of the YSO. This luminosity () is about one order of magnitude lower than previously estimated. For each high-excitation blob, we also determine the electron density and the elemental abundances of Ne, S, and Ar.
Key Words.:
infrared: ISM – ISM: lines and bands – ISM: dust, extinction – ISM: H ii region – ISM: individual objects: N88A – ISM: individual objects: N160A1 Introduction
High-Excitation Blobs (HEBs) are compact H ii regions that constitute a rare class of ionized nebulae in the Magellanic Clouds (e.g. Heydari-Malayeri et al., 2007, and references therein). These objects are tightly linked to the early stages of massive star formation, when the stars disrupt their natal molecular clouds. They are considered to be the first step in the evolution from an ultracompact H ii region towards more extended structures. Their main characteristics are: high excitation, small size ( pc), high density, and higher extinction than the typical H ii regions in the Magellanic Clouds. So far, only 6 members have been discovered in the Large Magellanic Cloud (LMC) and 3 in the Small Magellanic Cloud (SMC). Most of these HEBs have a counterpart observed in radio (Indebetouw et al., 2004; Martín-Hernández et al., 2005).
Infrared spectroscopy is one of the best ways to determine the characteristics of H ii regions. The overall mid-infrared (MIR) spectra of H ii regions (e.g. Peeters et al., 2002b) are dominated by atomic fine-structure lines that originate in the ionized gas, a strong rising continuum due to thermal emission of dust and strong, broad emission features at 3.3, 6.2, 7.7, 8.6, 11.2 and 12.7 m, attributed to emission by Polycyclic Aromatic Hydrocarbon (PAH) molecules (e.g Allamandola et al., 1989).
The comparison of ISO-SWS spectra of H ii regions in the Magellanic Clouds (which also include a few HEBs) and in our Galaxy shows a clear segregation in PAH ratios between the sources of different type of environment, i.e. from the Milky Way to the LMC and to the SMC (Vermeij et al., 2002b). This is most certainly due to the different environment encountered in the Magellanic Clouds, in particular, its low metal content. This study, nevertheless, is based upon observations made with the large ISO aperture (between 14″ and 33″), where other contributions besides that of the H ii region itself are likely to exist.
| Source | RA (h m s) | Dec ( ) | Date | Standard | Flux (mJy) | |
|---|---|---|---|---|---|---|
| (J2000.0) | star | N1 | N10.4 | |||
| N88A | 01 24 07.9 | 73 09 04 | 2003-11-14 | HD4815 | – | |
| N160 A1 | 05 39 43.3 | 69 38 54 | 2003-11-17 | HD39523 | – | |
| N160 A2 | 05 39 45.9 | 69 38 39 | 2003-11-17 | HD39523 | – | |
| N160A-IR | 05 39 43.9 | 69 38 34 | 2003-11-14 | HD39523 | – | |
(a) The image was calibrated using the spectrum since we did not image the standard star in this filter. Slit losses of up to 50% are considered in the uncertainty. (b) The uncertainty (%) accounts for variations in the transparency of the atmosphere and the absolute flux calibration error of the standard star. (c) Upper limits are defined as the flux of a point source with a peak flux three times the image noise.
| Source | RA (h m s) | Dec ( ) | AORKEY(a) | |
| (J2000.0) | ||||
| IRAC | ||||
| N88 A | 4383488 | |||
| N160 A | 12546816 | |||
| IRS | SH/LH | SL/LL | ||
| N88 A | 1 24 08.10 | 73 09 05.00 | 4384000 | |
| N160 A2 | 5 39 46.10 | 69 38 36.00 | 12606208 | 8242944 |
| 12902556 | 8568832 | |||
| 13048576 | 8579328 | |||
| 13162752 | 11812352 | |||
| 13358336 | 12003584 | |||
| 13529088 | 12130048 | |||
| 15672064 | 15672064 | |||
| 16295936 | 16295936 | |||
| 16702976 | 16702976 | |||
| MIPS | ||||
| N160 A | 14381312 | |||
(a) AORKEY which uniquely identifies each Spitzer observation.
MIR spectra of H ii regions give also access to various elements, e.g. Ar, S and Ne, in two different ionization stages. Ratios of fine-structure lines such as [Ar iii]/[Ar ii] 9.0/7.0, [S iv]/[S iii] 10.5/18.7 and [Ne iii]/[Ne ii] 15.5/12.8 m probe the ionizing stellar spectrum between 27.6 and 41 eV and are widely used to constrain the properties of the ionizing stars in H ii regions. Again, the use of large apertures is limited since the contributions from neighboring sources cannot be disentangled.
High-spatial resolution observations are thus essential to provide accurate measurements of the line (and PAH) fluxes emitted by the object itself. In this sense, the study of H ii regions in the Magellanic Clouds, and specially of HEBs due to their compactness, might serve as a stepping stone to understand H ii regions in other galaxies, where their emission is confined into one beam. H ii regions in the Magellanic Clouds are close enough that we can still resolve their individual components. Hence, we can disentangle their contribution to the overall spectrum and assess how much the properties of the H ii region depend on aperture size. This is actually difficult to do for H ii regions in our Galaxy where the surrounding ionized gas, because of its low density, is usually too diffuse and extended to be well sampled.
In this paper, we study in detail the spectral morphology of two well distinct regions, N88 A and N160 A, at high-spatial resolution using TIMMI2 and the Infrared Spectrograph (IRS) onboard the Spitzer Space Telescope. These spectra are subsequently compared with findings (and conclusions) based upon large aperture data obtained with ISO-SWS. N88 A, located in the SMC, is a compact HEB which is among the brightest objects in the Magellanic Clouds (e.g. Heydari-Malayeri et al., 1999). N160 A, located in the LMC, is a particularly interesting region since it harbors two HEBs named A1 and A2 (Heydari-Malayeri & Testor, 1986) and a massive Young Stellar Object (YSO; Epchtein et al., 1984; Henning et al., 1998), called N160 A-IR. For N160 A, we have spectroscopically isolated for the first time the individual contributions of the two HEBs and the YSO. The images in the near- and mid-infrared of Henning et al. (1998) clearly separate this YSO from the neighboring sources, but the spectrum published by these authors, obtained with ISO, is dominated by emission from the surrounding ionized gas.
The core of this paper is structured as follows. Section 2 presents the observations and data reduction. Section 3 describes the general morphology of N88 A and N160 A. Results are presented in Sect. 4, which includes a description of the MIR spectra, a comparison between observations obtained with different apertures, an estimate of the physical conditions of the ionized gas (in terms of electron density and elemental abundances) and, finally, the modeling of the Spectral Energy Distribution (SED) of the YSO in N160 A. The main conclusions are summarized in Sect. 5.
| Source | RA (h m s) | Dec ( ) | Date | TDT(a) | AOT |
|---|---|---|---|---|---|
| (J2000.0) | |||||
| N88 A | 01 24 08.15 | 73 09 03.2 | 1997-09-08 | 66300110 | 01(b) |
| N160 A2 | 05 39 46.12 | 69 38 36.6 | 1997-08-05 | 62804104 | 01(b) |
| N160 A-IR | 05 39 43.74 | 69 38 30.4 | 1997-08-01 | 62401303 | 01(c) |
| N160 A1 | 05 39 43.27 | 69 38 51.4 | 1996-07-10 | 23600925 | 02 |
(a) Target Dedicated Time (TDT) which uniquely identifies each ISO observation. (b) Speed 2. (c) Speed 3.
2 Observations and data reduction
2.1 TIMMI2
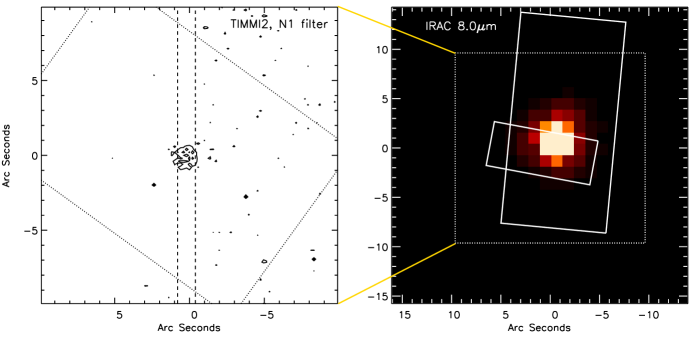
The -band imaging and spectroscopic observations were made with the Thermal Infrared MultiMode Instrument (TIMMI2) at the ESO 3.6 m telescope. A journal of these observations is presented in Table 1. The camera uses a pixel Raytheon Si:As array. In imaging, we selected the 02 pixel scale providing a total field of view of . For long-slit spectroscopy, we used the 10 m low-resolution grism which ranges from 7.5 to 13.9 m and has a spectral resolving power . The slit used was 1270″, with a pixel scale of 045. It was oriented along P.A.° covering the brightest nebular spots of N88 A (cf. Fig. 1) and N160 A (cf. Fig. 2). The three slits covering N160 A are denominated, from west to east, s1, s2 and s3. They were selected to cover, respectively, N160 A1, N160 A-IR and N160 A2. The infrared seeing during our observations varied between 16 and 19, measured from the full-width-at-half-maximum (FWHM) of the standard star spectra.
In order to correct for background emission from the sky, the observations were performed using a standard chopping/nodding technique. For N88 A, we used chop and nod amplitudes of 15″ for imaging, and of 10″ for spectroscopy. To image N160 A, we used an amplitude of 30″; for spectroscopy, we used 20″ in the case of slit s3, and 30″ in the case of slits s1 and s2.
The data processing included the removal of bad frames and the co-addition of all chopping and nodding pairs. This procedure is applied to both the target and the calibration standard star. We propagated the uncertainty for each pixel, dominated by variations of the sky transparency, along each step of the processing.
The -band imaging of the standard stars was performed in the same filter as the target and used for photometric flux conversion from photon count rates (ADU/s) into astronomical units (Jy). The MIR flux densities of the targets in the resulting images are given in Table 1. N88 A was observed in the N1 filter (red and blue cuts are 7.79 and 9.46 m, respectively), and N160 A in the N10.4 filter (9.46 and 11.21 m, respectively). Astrometry was performed by comparing with radio maps (cf. Indebetouw et al., 2004; Martín-Hernández et al., 2005) and by matching the positions of stars in common in our images and in the 2MASS survey catalogue. The final (contour) images are shown in the left panels of Figs. 1 and 2.
The spectra of the standard stars were used for atmospheric corrections and for flux calibration. To minimize residuals of the sky line correction, we observed the standard star and the target at similar airmasses. In addition, we applied a flux correction provided by the TIMMI2 instrument team that takes into account the differential extinction between the target and the standard star. The synthetic calibrated spectra for these standard stars are given by Cohen et al. (1999). We note that, close to the blue and red cut-off frequencies of the grating, the terrestrial background varies strongly with ambient conditions and atmospheric corrections are more difficult. The same holds for wavelength regions of strong terrestrial lines near 9.58 m, 11.73 m and 12.55 m. Finally, wavelength calibration is straight forward since a table with the pixel-to-wavelength correspondence is provided by the TIMMI2 team.
2.2 Spitzer
N88 A and N160 A were also observed with the IRAC instrument (Fazio et al., 2004), the MIPS instrument (Rieke et al., 2004), and the IRS instrument (Houck et al., 2004) onboard the Spitzer Space Telescope (Werner et al., 2004). From the Spitzer archive, we obtained the IRAC pbcd data associated with pipeline version S14, the MIPS pbcd data associated with pipeline version S16, and the IRS Short-High (SH), Long-High (LH), Short-Low (SL) and Long-Low (LL) bcd data associated with pipeline version S15 (see Table 2). Some observations, although available, were not considered here. The LL spectrum of N160 A2, for instance, is not used since the LL wavelength region is covered already by the SH/LH modes, which also have a higher spatial resolution. In addition, the LL (1st order) spectrum of N160 A-IR and the 24 m MIPS map of N160 A were not considered due to saturation problems.
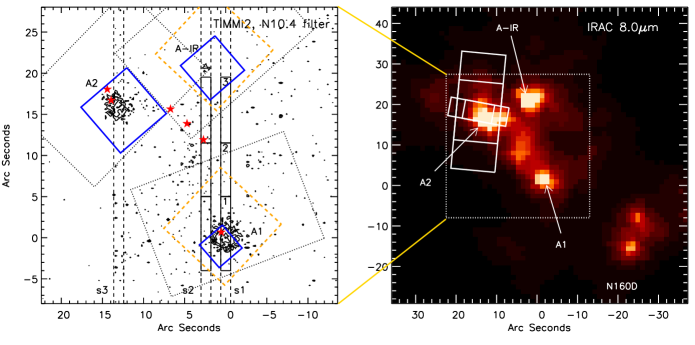
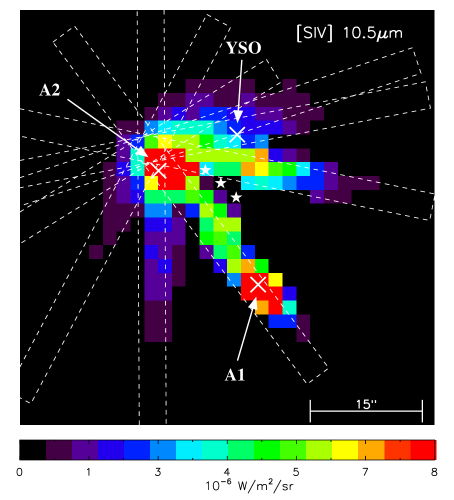
IRAC images of N88 A and N160 A are shown in the right panels of Figs. 1 and 2. The IRS SH and LH apertures centered on N88 A (only nod 1) are indicated in the right panel of Fig. 1. Here, only the spectrum of nod 1 is used because of the better overlap between the different orders. N160 A2 was used as a calibrator for IRS and therefore, it was observed multiple times using the same pointing (see Table 2). The orientation of each slit depends on the observing date/time. The right panel of Fig. 2, for instance, shows the slit of one specific SH and LH observation centered on N160 A2, i.e. AORKEY = 15672064. The other slits are rotated with respect to this one. IRS SL and LL spectra of N160 A2 were also obtained through multiple slits. This and the large slit size allowed us to create spectral maps using CUBISM –see e.g. Fig. 7, where a [S iv] 10.5 m line flux map has been created using this software– and, consequently, to extract a spectrum for each individual component. These extraction apertures are shown in the left panel of Fig. 2. Full-slit aperture extraction was performed for the SH and LH observations. The aperture sizes are listed in Table 4.
Additional processing was applied to the IRS bcd data. Rogue pixels and bad pixels identified in the bmask were replaced with IRSCLEAN. This program obtains the new flux values by deriving profiles for a group of rows above and below the bad pixel (i.e. neighboring wavelengths), predicting the profile for the bad pixel’s row, and scaling that profile by the good pixels in the bad pixel’s row. Residual bad data were manually removed from the obtained spectra. Note that background subtraction has not been applied. The resulting SH and LH spectra have a resolving power of 600. The SL and LL spectra, on the other hand, have a resolving power ranging from 60 to 128. They are shown in Figs. 3, 4 and 5.
Given that N160 A2 is extended, different slit orientations result in flux level variations up to 20% in the resulting individual SH and LH spectra (because of the full-slit aperture extraction). For the final line fluxes reported in Table 4, we consider the mean of the fluxes in all positions. Uncertainties take into account these variations from slit to slit.
In addition, in all SH 2-dimensional (2d) bcd images of N160 A2, there are between 1 and 4 pixels in the [Ne iii] 15.5 m fine-structure line that only have 1 useable (i.e. non-saturated) plane in the raw data making it impossible to obtain a reliable flux for the considered pixel. These (saturated) pixels are corrected for by IRSCLEAN, which operates on the 2d bcd images. However, the accuracy of the corrected flux decreases with the increasing number of bad pixels. Nevertheless, when comparing the [Ne iii] 15.5 m line flux of N160 A2 for all SH observations, no correlation is found with the amount of pixels that have 1 single useable plane, and all line fluxes fall within of the mean value, similar to the range in fluxes found for the other fine-structure lines. This suggests that the variations we see in the [Ne iii] line flux are most likely due to the different slit orientations (as mentioned previously). The [Ne iii] 15.5 m line flux should anyway be considered with caution.
2.3 ISO-SWS
N88 A and N160 A were observed with the Short Wavelength Spectrometer (SWS, de Graauw et al., 1996) onboard the Infrared Space Observatory (ISO, Kessler et al., 1996) in the AOT 01 and AOT 02 modes with a resolving power () ranging from 350 to 1500 (see Table 3). The AOT 01 mode covers the full SWS wavelength range from 2.3 to 45 m, while the AOT 02 mode consists of separate line scans. The AOT 01 data were processed with IA3, the SWS Interactive Analysis package using calibration files and procedures equivalent with pipeline version 10.1. A detailed account of the reduction can be found in Peeters et al. (2002b). For the AOT 02 observations, we refer to Vermeij et al. (2002a) and Vermeij & van der Hulst (2002). The ISO spectra of N160 A2 and the YSO N160 A-IR are plotted in Fig. 5. Note that the ISO-SWS observation centered on A1 was made in AOT 02 mode and consists only of separate line scans; hence, this spectrum is not shown.
3 Source characteristics
3.1 N88 A
N88 A is among the brightest objects in the Magellanic Clouds and is part of the large H ii complex N88 (Henize 1956; other designation is DEM 161, Davies et al. 1976), located east of the main body of the SMC. It is a compact (about 3″ in diameter) and high excitation H ii region (cf. Heydari-Malayeri et al., 1999), unusual among SMC H ii regions because it contains much dust (e.g. Testor & Pakull, 1985; Kurt et al., 1999). The interstellar reddening towards N88 A, as derived from the Balmer decrement in the visible, is on average mag (cf. Heydari-Malayeri et al., 1999; Testor et al., 2005), unexpectedly high for an H ii region in the metal poor SMC. Hence, Heydari-Malayeri et al. (1999) describe N88 A as a HEB, a very young H ii region which is hatching from its natal molecular cloud and is heavily affected by absorbing dust associated with the cloud.
N88 A has a complex and inhomogeneous morphology (cf. Heydari-Malayeri et al., 1999). An absorption lane crosses the nebula from north to south and here the extinction rises to more than 3.5 mag. West of this dusty structure lies the brightest part of N88 A, a small core of 03 in diameter. A sharp edge is visible on the north-west and several lower excitation arc-shaped features and filaments seem to emerge from the main body of the source. Its radio continuum emission (cf. Indebetouw et al., 2004) agrees fairly well with the global optical morphology, although it appears to be slightly offset to the west of the H emission. These authors note, however, that this offset could be due to the ″ pointing uncertainty of HST.
Heydari-Malayeri et al. (1999) also show that the bright H core of N88 A contains at least two stars (#1 and #2), and a third fainter one is located to the east, marginally detected and thus more embedded. These authors suggest that this faint star might be the exciting star. Testor et al. (2003) derived a spectral type of O6–O8 V for the ionizing star. This spectral type classification is strengthened by the nebular near-infrared spectrum obtained by Testor et al. (2005), where the ratio of the 2.11 m He i to Br is consistent with an ionizing source of spectral type earlier than O7 V (see table 3 of Hanson et al., 2002).
Figure 1 shows the TIMMI2 (N1 filter) and Spitzer-IRAC (8 m) images of N88 A. On top, we show the TIMMI2 slit, and the Spitzer-IRS and ISO-SWS larger apertures.
3.2 N160 A
N160 (Henize 1956; other designations are DEM 284, Davies et al. 1976, and MC 76, McGee & Milton 1966) is a giant H ii complex lying about 30′ south of 30 Doradus. The complex is formed by two main regions 35 apart (Heydari-Malayeri & Testor, 1986). The brighter western region comprises components A (NGC 2080) and D (NGC 2077), while the eastern region is formed by components B (NGC 2085) and C (IC 2145). N160 is linked with the OB star association LH 103 (Lucke & Hodge, 1970).
N160A is the brightest component of N160. It is a particularly interesting region since it harbors two HEBs (called A1 and A2, and discovered by Heydari-Malayeri & Testor, 1986) and a young stellar object (named N160 A-IR). This YSO was discovered using near- and mid-infrared photometry by Epchtein et al. (1984) and has been further observed in the infrared by Henning et al. (1998). A water maser has been found at the interface between the molecular cloud and the H ii region providing strong evidence that feedback from massive stars is triggering subsequent star formation (Oliveira et al., 2006).
HST observations of N160 A (Heydari-Malayeri et al., 2002) reveal a bright nebula of about 35″ by 25″. The compact H ii region A1, which is the brightest part of N160 A, shows a tiny cavity of some 23 across which might be the result of the strong wind of a bright star found towards the center of the blob. This star must be a massive O type since it has carved the cavity and produces the highest [O iii]/H ratio in the whole region. The other HEB, A2, is 3″ in diameter, has a patchy appearance marked by the presence of several thin absorption lanes and contains about dozen rather faint stars. Three bright cluster stars are also identified within the nebula along with the two blobs A1 and A2. These three stars seem to contribute to the ionization of N160 A. The visual magnitude of the brightest member of this central cluster agrees with an O6.5V star.
The A1 and A2 blobs lie in very dust rich areas of the region. In the case of A1, dust is mainly located behind the southern border of the cavity where the mean value of the H/H Balmer decrement gives an extinction mag. The northern compact H ii region A2 is more affected by dust, with a mean extinction mag (cf. Heydari-Malayeri et al., 2002).
The radio continuum emission observed towards N160 A reveals an extended structure coincident with the optical nebula where the two HEBs A1 and A2 stand out as two strong radio peaks (cf. Indebetouw et al., 2004; Martín-Hernández et al., 2005). As expected from its youth, the YSO does not have associated radio continuum emission.
Figure 2 shows the TIMMI2 (N10.4 filter) and Spitzer-IRAC (8 m) images of N160 A. The YSO is not registered by the TIMMI2 image but it appears as a very bright source in the IRAC one. The larger field of view of the Spitzer-IRAC image also registers the western N160 D region. The TIMMI2 slits, and the Spitzer-IRS and ISO-SWS apertures are indicated.
4 Results
4.1 The MIR spectrum
We present here the high-spatial resolution spectroscopy data obtained with TIMMI2 and Spitzer, which will be compared with ISO observations.
A variety of fine-structure lines and broad-band dust features fall within the ground-based -band spectroscopic range (8–13 m) of TIMMI2. The most relevant lines are [Ar iii] at 9.0 m, [S iv] at 10.5 m and [Ne ii] at 12.8 m. These lines require hard radiation with energies between and 35 eV, and the most likely explanation for their excitation mechanism is photoionization by hot stars. Spitzer-IRS and ISO-SWS cover a wider wavelength range, including lines such as [Ar ii] at 7 m, [Ne iii] at 15.5 and 36 m, and [S iii] at 18.7 and 33.5 m.
In terms of molecular features, the MIR spectra of many H ii regions are dominated by the well known PAH emission features at 3.3, 6.0, 6.2, 7.7, 8.6, 11.0, 11.2 and 12.7 m. Two silicate bands centered around 9.7 m and 18 m can also be present.
The TIMMI2, Spitzer-IRS and ISO-SWS line fluxes, and the upper limits of the non-detected lines, are listed in Table 4. The PAH band fluxes are reported in Table 5.
4.1.1 N88 A
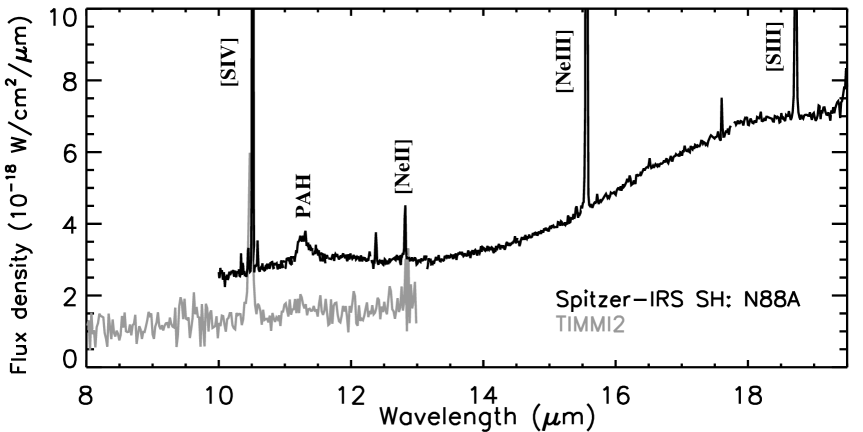
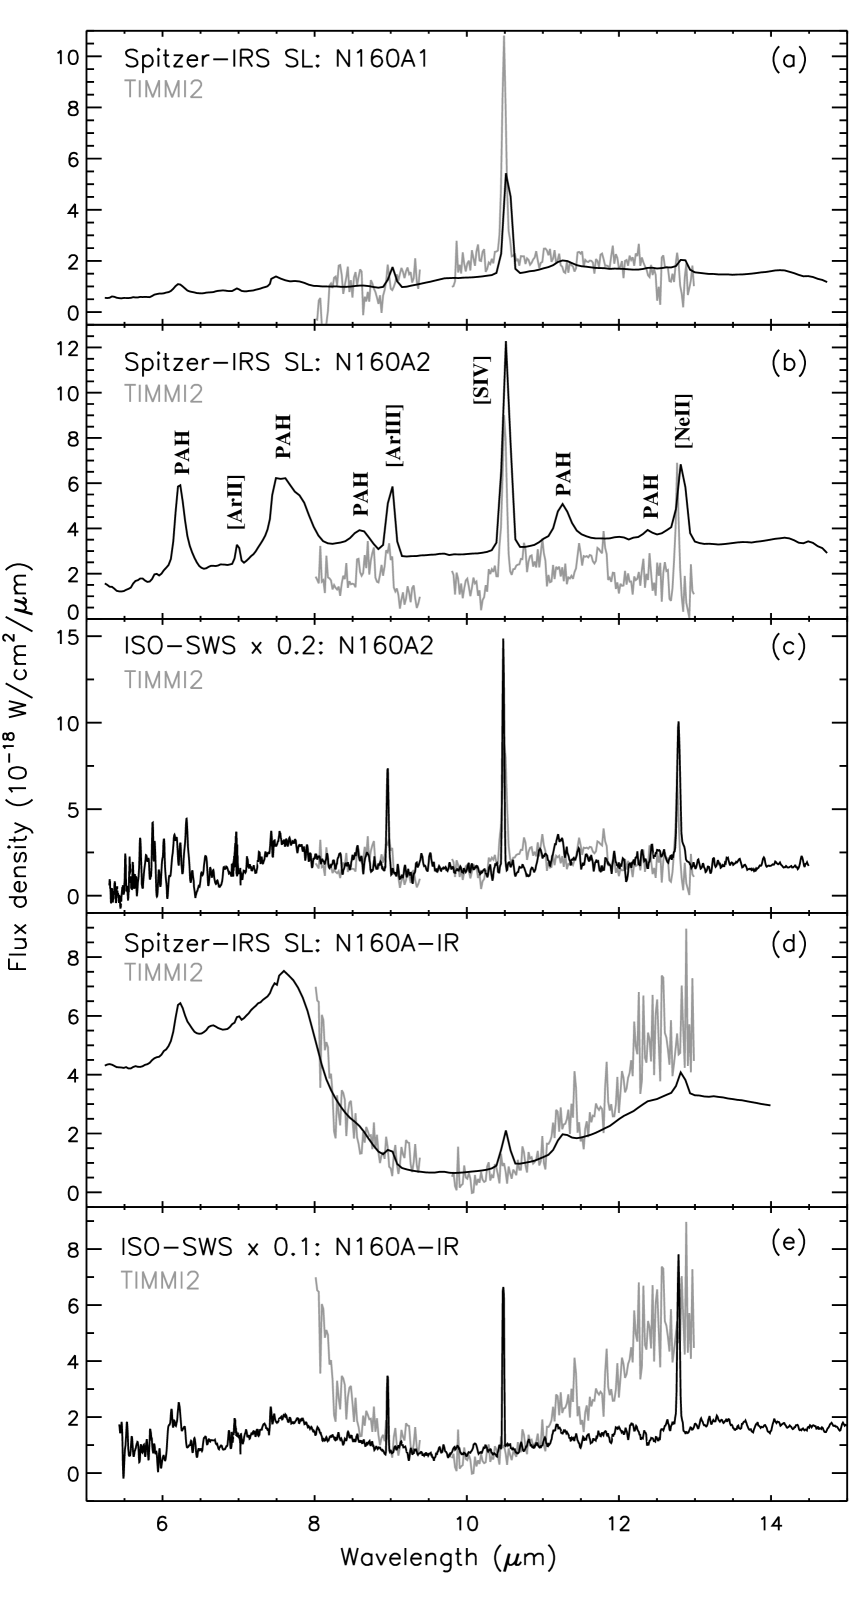
Figure 3 shows the TIMMI2 and Spitzer-IRS SH spectra of N88 A. The spectral appearance of the ISO-SWS spectrum matches that of the Spitzer-IRS spectrum and therefore, we do not show it.
N88 A is resolved by TIMMI2 with a FWHM along the spatial direction of 30 (see Sect. 2.1), higher than the TIMMI2 slit width of 12. Hence, slit losses are expected. Assuming that the source is Gaussian and that the slit is perfectly centered on the source peak, the slit might be registering about 40% of the total emission of N88 A. Assuming this slit loss, the total [S iv] line flux associated with N88 A would be W cm-2, in good agreement with the fluxes measured by Spitzer-IRS and ISO-SWS. The same holds for the dust continuum flux. This indicates that, in spite of its larger aperture, the fluxes observed by Spitzer-IRS, and even ISO-SWS, come exclusively from the compact source N88 A. This is expected since N88 A is an isolated object with no known, adjacent infrared sources. Thus, it can be said that Spitzer observations do not spatially resolve N88 A.
It is interesting to note the lack of PAH emission features in the TIMMI2 spectrum. The Spitzer-IRS spectrum, on the contrary, clearly exhibits a 11.2 m PAH band. Other PAH bands at e.g. 11.0 and 12.8 m, and the PAH emission between 15–20 m, are however not present in this Spitzer spectrum. In addition, hydrogen recombination lines at 11.3 and 12.4 m are detected.
4.1.2 N160 A
The HEBs A1 and A2
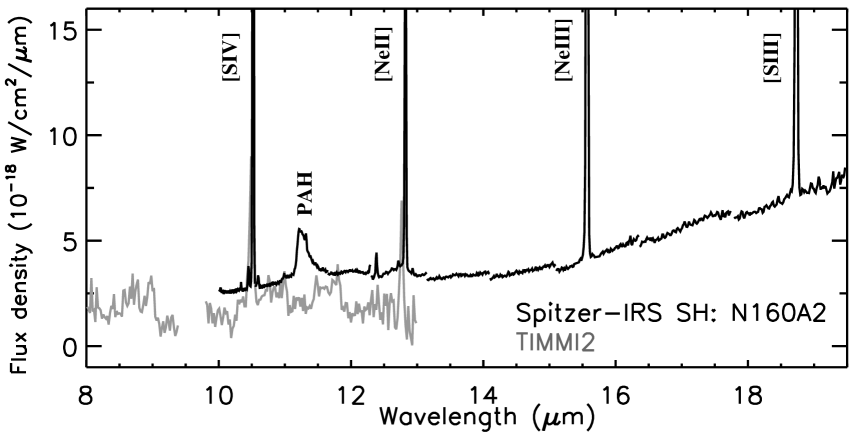
As it can be seen in the top three panels of Fig. 5 (and in Fig. 4), the spectra of A1 and A2 are the typical spectra found in H ii regions, characterized, as discussed above, by emission from fine-structure lines and PAHs on top of a dust continuum.
| Line/ratio | (m) | N88 A | N160 A1 | N160 A2 | N160 A-IR | Instrument | Aperture (″) | Notes |
| [Ar ii] | 7.0 | Spitzer-IRS (SL) | ||||||
| ISO-SWS | 1, 2 | |||||||
| [Ar iii] | 9.0 | TIMMI2 | ||||||
| Spitzer-IRS (SL) | ||||||||
| ISO-SWS | 1, 2 | |||||||
| [S iv] | 10.5 | TIMMI2 | ||||||
| Spitzer-IRS (SL) | ||||||||
| Spitzer-IRS (SH) | ||||||||
| ISO-SWS | 1, 2 | |||||||
| [Ne ii] | 12.8 | TIMMI2 | ||||||
| Spitzer-IRS (SL) | ||||||||
| Spitzer-IRS (SH) | ||||||||
| ISO-SWS | 1, 2 | |||||||
| [Ne iii] | 15.5 | Spitzer-IRS (SH) | ||||||
| Spitzer-IRS (LL) | ||||||||
| ISO-SWS | 1, 2 | |||||||
| [S iii] | 18.7 | Spitzer-IRS (SH) | ||||||
| Spitzer-IRS (LL) | ||||||||
| ISO-SWS | 1, 2 | |||||||
| [S iii] | 33.5 | Spitzer-IRS (LL) | ||||||
| Spitzer-IRS (LH) | ||||||||
| ISO-SWS | 1,2 | |||||||
| [Ne iii] | 36.0 | Spitzer-IRS (LH) | ||||||
| ISO-SWS | 1, 2 | |||||||
| [Ne iii]/[Ne ii] | 15.5/12.8 | Spitzer-IRS (SH) | ||||||
| ISO-SWS | ||||||||
| [S iv]/[Ne ii] | 10.5/12.8 | TIMMI2 | ||||||
| Spitzer-IRS (SL) | ||||||||
| Spitzer-IRS (SH) | ||||||||
| ISO-SWS |
(a) (N88 A)=45, (N160 A1)=47, (N160 A2)=80 and (N160 A-IR)=35. (b) This line flux might be uncertain, see Sect. 2.2. (c) (N160 A1)=37, (N160 A2)=74 and (N160 A-IR)=55. Notes–(1) The AOT 02 ISO-SWS line fluxes of N160 A1 have been published by Vermeij et al. (2002a). For N88 A and N160 A2, we use instead the line fluxes we have directly measured from the AOT 01 ISO-SWS spectra centered on these sources. (2) The full ISO-SWS spectrum centered at the position of N160 A-IR has been published by Henning et al. (1998).
Both sources are resolved by TIMMI2, with a FWHM along the spatial direction (see Sect. 2.1) higher than the TIMMI2 slit width. Again, slit losses are expected, in particular for A2 with a FWHM of 53. In principle, one could expect that the TIMMI2 slit is registering about 40% of the total emission in the case of A1, and only 25% in the case of A2, assuming that the sources are Gaussian. However, the TIMMI2 and the Spitzer-IRS spectra of these two sources match very well (see panels a and b of Fig. 5) suggesting that slit losses are not very significant, at least not for the dust continuum emission. A comparison with the scaled down ISO-SWS spectrum of N160 A2 is shown in the middel panel of Fig. 5. The large difference in the flux level of the continuum between the TIMMI2 and the ISO-SWS spectra reflects the effect of the much larger ISO-SWS aperture, and the extensiveness and complexity of the source and its surroundings.
Aperture differences are also evident in the line fluxes measured by each instrument (see Table 4). In the case of A1, for instance, the [S iv] line fluxes measured by TIMMI2 and Spitzer agree with each other, but they only account for 20% of the [S iv] line flux measured by ISO. For A2, the [S iv] line flux measured by Spitzer is in between those obtained with TIMMI2 and ISO, which clearly reflects the effect of the extended emission associated to this whole area. In particular, the [S iv] line flux measured by TIMMI2 accounts for approximately 40% of the [S iv] line flux measured by Spitzer. This percentage is higher than the expected 25% (see above) and hence, we are confident that the smaller aperture of Spitzer-IRS (i.e. 4711″) is indeed tracing most of the ionized gas associated with A2.
When looking at the [Ne iii]/[Ne ii] 15.2/12.8 m line ratios measured for N160 A (see again Table 4), aperture effects are also evident. Note, for instance, how this ratio (and also the ground-based [S iv]/[Ne ii] 10.5/12.8 m ratio) changes depending on the position and/or aperture. Basically, these ratios tend to decrease with aperture size. This has a clear impact if one wants to use this ratio as a diagnostic for the effective temperature of the central ionizing star or stars. The [Ne iii]/[Ne ii] line ratio is highly sensitive to the effective temperature of the ionizing star (see e.g. Mokiem et al., 2004; Morisset et al., 2004), and an incorrect line ratio could lead to a wrong interpretation in terms of the stellar content. When sampling a single H ii region, the use of pencil beam spectra might give a –sometimes– wrong impression of the ionization characteristics of the central star. Essentially, the low ionization stage of an ion is undersampled for lines of sight towards the center of the region, and the other way around for lines of sight away from the center. In this sense, it is much better to use observations that encompass the whole H ii region. However, N160 A is not a single H ii region. It harbors two HEBs (each containing at least one massive O star) and the main ionizing stars (from which the hottest could be an O6.5 V) appear to be part of a central cluster which extends over several arcseconds. This cluster is located between A1 and A2 (see the left panel of Fig. 2). The ionization structure of N160 A is, therefore, highly complex. The variations we see in the [Ne iii]/[Ne ii] (and [S iv]/[Ne ii]) line ratio, with the highest value found close to the HEBs, suggest that the two HEBs are ionized by very hot stars, while the extended emission is ionized by cooler stars that are likely located in the central cluster. These two HEBs could be ionized, in fact, by hot O4–O5 V stars, as estimated from their 4.8 GHz radio continuum emission (Martín-Hernández et al., 2005).
Finally, N160 A1 exhibits PAH emission bands at 6.0, 6.2, 6.8, 7.7, 8.6, 11.2 and 12.7 m (see panel a of Fig. 5). It has a remarkably strong 6.0 m band which starts already near 5.83 m. The 6.2/11.2 and 7.7/11.2 band ratios (see Table 5) are slightly lower than those of N160 A2, but similar to those found towards LMC H ii regions (Vermeij et al., 2002b). In addition, the band profiles of the main PAH bands belong to class A and are, therefore, consistent with the typical PAH characteristics found in H ii regions (Peeters et al., 2002a). The top of the 7.7 m complex, however, is fairly sharp and emission seems to be lacking from the 7.8 m component. This could possibly be due to the less reliable fluxes at the order edges and to mismatches between the different orders of Spitzer-IRS SL (one order overlap falls exactly at the position of the 7.7 m complex).
N160 A2, on the other hand, exhibits PAH emission bands at 5.75, 6.0, 6.2, 7.7, 8.6, 11.0, 11.2 and 12.7 m (see panel b of Fig. 5). The profiles of the main PAH bands (at 6.2, 7.7, 8.6 and 11.2 m) belong to class A. As for the fine-structure lines, aperture effects are apparent. The PAH band fluxes measured by Spitzer are considerably smaller than the ISO ones. In particular, they only account for about 24% and 15% of the, respectively, 7.7 and 11.2 m PAH fluxes measured by ISO. This percentage is roughly similar to the corresponding aperture ratio, suggesting that the PAH emission is very homogeneous. In addition, there exists a significant difference in the 7.7/(11.0+11.2) band ratio between the Spitzer and the ISO data. Given that the 7.7 and 11.2 m emission is dominated by PAH cations and neutrals respectively, this suggests a higher neutral to cation ratio in the larger ISO-SWS aperture. In general, the 7.7/(11.0+11.2) band ratio is similar to those found in LMC H ii regions by Vermeij et al. (2002b), and is on the lower half of the range observed towards Galactic H ii regions (Hony et al., 2001). The 12.7/11.2 band ratio, on the contrary, is more similar to the ratios observed towards Galactic intermediate mass star-forming regions and Planetary Nebulae than towards Galactic H ii regions. This suggests the presence of more compact, smooth-edged PAHs towards N160 A2. However, a much more detailed study of the CH out-of-plane bending modes in Magellanic Cloud H ii regions is warranted.
The extended emission
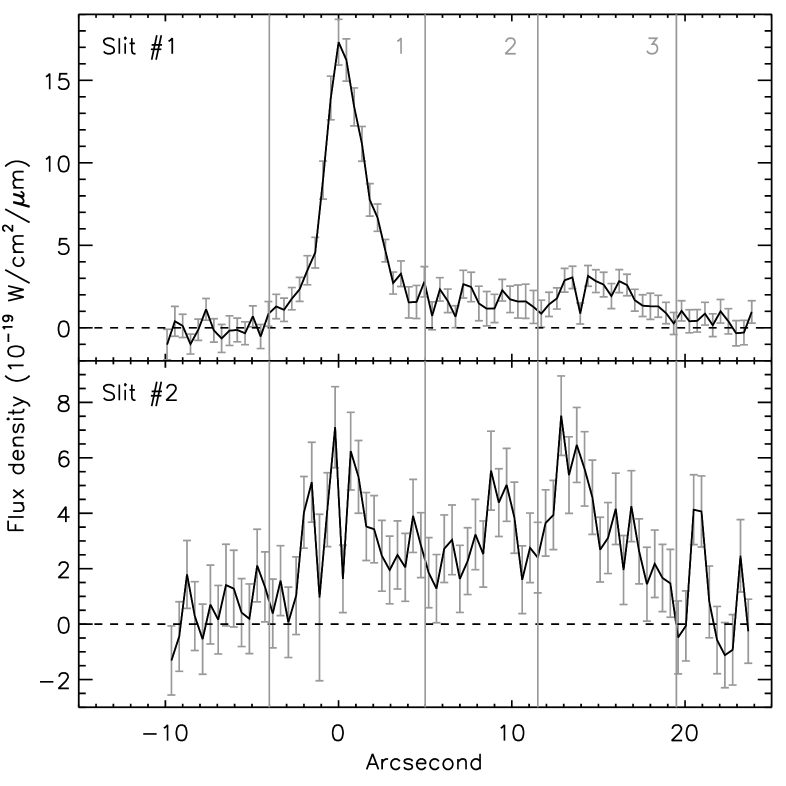
TIMMI2 slits s1 and s2 registered faint and extended [S iv] emission. Extended emission from other atomic lines was not detected with TIMMI2. Figure 6 shows the variation of the [S iv] line peak flux across these slits from south to north. This emission practically extends across the 20″ of separation between the YSO and A1, and is most likely associated with the central star cluster located between A1 and A2. This cluster extends over an area and its brightest component, if it were a main sequence star, could be, as mentioned in Sect. 3.2, an O6.5 V.
A more complete map of this extended [S iv] line emission is shown in Fig. 7. This map has been created using the multiple Spitzer-IRS SL observations that are available. It is clear that the [S iv] emission is stronger at the positions of the A1 and A2 components, while it is practically null at the position of the YSO. It is also evident that there exists an extended component towards the west and south-west.
The YSO N160 A-IR
The spectrum of N160 A-IR, shown in the lower two panels of Fig. 5, is dominated by a deep silicate absorption, indicative of the high extinction (around 70 mag, see Sect. 4.3) existent towards this object. The TIMMI2 spectrum lacks emission from fine-structure lines. Once again, the overall agreement between the TIMMI2 and Spitzer observations is striking, in particular in the case of the continuum emission/absorption. On the other hand, it is clear that the dominant contribution to the ISO-SWS aperture is the ionized gas surrounding the YSO. Even for the smaller Spitzer-IRS SL aperture (5555), a contribution of the surrounding ionized gas is present in the form of fine-structure lines. In the case of the TIMMI2 observations, one might expect slit losses of about 50%. However, the TIMMI2 spectrum agrees remarkably well with the photometry of Epchtein et al. (1984) obtained through a 10″ aperture (see Fig. 8).
| Source | 6.0+6.2 | 7.7 | 8.6 | 11.0+11.2 | 12.7 | Instrument |
| N88 A | – | – | – | 0+15(a) | – | IRS-SH |
| N160 A1 | 11 | 22 | 1.4 | 12 | y | IRS-SL |
| N160 A2 | 77 | 165 | 18 | 45 | – | IRS-SL |
| – | – | – | 5+39 | 14 | IRS-SH | |
| y | 693 | y | 60+233 | y | ISO-SWS |
y means that the band is present but it is very weak. (a) No 11.0 m band present. Notes–Integration limits are [7.07,8.2] and [8.2, 8.83] for the 7.7 and 8.6 m PAH bands, respectively. The integration limits for the 11.0+11.2 m bands are [10.85, 11.6].
| N 88A | N160 A1 | N160 A2 | |
|---|---|---|---|
| Ne/H | |||
| () | (a) | (a) | (a) |
| 2.1 (c) | 6.33 (b) | 4.48 (b) | |
| 2.2 (d) | |||
| S/H | |||
| () | (a) | (a) | (a) |
| 3.2 (c) | (b) | (b) | |
| 2.2 (d) | |||
| Ar/H | – | ||
| () | (a) | (a) |
In addition to the silicate absorption bands at 9.7 and 18 m, the Spitzer spectrum shows PAH emission at 6.2, 7.7 and 11.2 m, and even marginally at 8.6 m (see panel d of Fig. 5).
4.2 Physical conditions and abundance calculations
The electron density can be determined from the ratio of two atomic fine-structure lines of the same ionic species when they are emitted from levels with nearly the same excitation energy (e.g. Rubin et al., 1994). This ratio is sensitive to gas densities approximately in between the critical densities of each line. High density gas can be probed using line ratios such as [S iii] 33.5/18.7 and [Ne iii] 36.0/15.5 m. On the other hand, ionic abundances can be determined from the measured strengths of the fine-structure and H i recombination lines (e.g. Rubin et al., 1988).
We will now determine the physical conditions of the ionized gas (in terms of electron density and elemental abundances) in N88 A, N160 A1 and N160 A2. The final abundances of Ne, S and Ar are listed in Table 6, where they are compared with previous optical and infrared determinations.
4.2.1 N88 A
We use directly the line fluxes measured by Spitzer-IRS. De-reddening is not an issue because of the low extinction at these wavelengths. Note that the extinction in e.g. the near-infrared is only 2% of the attenuation suffered in the optical (which is around 1.5) when applying the SMC extinction law obtained by Gordon et al. (2003).
Assuming an electron temperature of 14 000 K for N88 A (e.g. Kurt et al., 1999; Vermeij & van der Hulst, 2002; Testor et al., 2003), the observed [S iii] 33.5/18.7 line ratio gives an electron density of cm-3. This density is comparable to the one obtained by Vermeij & van der Hulst (2002) using ISO-SWS (2200 cm-3), and to the rms electron density (3500 cm-3) derived from radio continuum observations (Indebetouw et al. 2004 measured a flux density of 91 mJy at 6 cm) using Eq. A.2.5 of Panagia & Walmsley (1978) and a source diameter of 3″ (see Sect. 2.1). The observed [Ne iii] 36.0/15.5 ratio, on the other hand, indicates a density cm-3.
In the calculation of ionic abundances, we use the H line flux ( erg s-1 cm-2) predicted directly from radio continuum observations. It is estimated using Eq. 10 of Martín-Hernández et al. (2005). When this H line flux is compared with the line flux measured by Heydari-Malayeri et al. (1999), we get a visible extinction which is in agreement with the values obtained by previous authors (see Sect. 3.1). We also assume an electron density of 3500 cm-3. This density is lower than the critical densities of the lines involved in the calculations and hence, is not a decisive factor. We obtain Ne+/H, Ne++/H, S++/H and S+3/H, where the uncertainties are given within brackets.
The total Ne abundance can be determined by adding the contributions of Ne+ and Ne++. The final Ne/H we estimate agrees well with the optical measurements. It is, however, higher than the abundance obtained by Vermeij & van der Hulst (2002), but these authors only give the contribution of Ne++ since they could not determine the ionic abundance of Ne+.
In the case of S, adding the contributions of S++ and S3+ only accounts for 50% of the expected sulphur abundance, i.e. about 0.2 times the solar S abundance (where we use the solar S abundance given by Asplund et al., 2005). Testor et al. (2003) estimate a S++/H+ abundance only 30% higher than the value we calculate and an insignificantly low S+/H+. It might then be inferred that 50% of the S abundance must be in the form of S+4, which needs energies around 47 eV in order to be produced. In fact, the optical estimates, which use ionization correction factors to account for unobserved ions, give higher S abundances.
4.2.2 N160 A1
We use directly the line fluxes measured by Spitzer-IRS (SL and LL modes). For an electron temperature of 10 000 K (Heydari-Malayeri & Testor, 1986; Vermeij & van der Hulst, 2002), the observed [S iii] 33.5/18.7 line ratio gives an electron density of cm-3, similar to the density estimated by Vermeij & van der Hulst (2002) using ISO-SWS (around 450 cm-3), but somewhat lower than the rms electron density of 2550 cm-3. This rms electron density is derived from radio continuum observations assuming a source diameter of 31 (see Sect. 2.1) and using the 6 cm flux density measured by Indebetouw et al. (2004).
In the calculation of ionic abundances, we use the H line flux predicted directly from radio continuum observations, and assume an electron density of 2550 cm-3 –this density is again lower than the critical densities of the lines involved in the calculations. This H line flux ( erg s-1 cm-2) is similar to the de-reddened H line flux estimated by Heydari-Malayeri et al. (2002). For Ne we obtain Ne+/H and Ne++/H. For S, S++/H and S+3/H. And finally, for Ar, Ar+/H and Ar++/H.
The abundances of Ne, S and Ar are given in Table 6. The abundances of Ne and S agree well with the optical and infrared estimates. The Ar abundance we obtain, however, is about 3 times lower than the one estimated by Vermeij & van der Hulst (2002) using ISO-SWS. ISO presented a clear advantage over other instruments when estimating elemental abundances: fine-structure lines and strong H i emission lines (e.g. Br and Br at 4.05 and 2.62 m, respectively) were observed using roughly the same aperture. Since in the estimate of ionic abundances we are assuming that the volume occupied by both ionic gases (i.e. H+ and X+i, where X is a given element) is the same, aperture mismatches clearly have an effect on the results. This effect is more pronounced in the case of Ar+, probably because this ion has a lower ionization potential (27.6 eV) than others such as S++ (34.8 eV) and Ne+ (41.0 eV). The volume occupied by Ar+ is thus largely extended, and we are likely underestimating the [Ar ii] 7.0 m line flux.
4.2.3 N160 A2
As it has been done previously, we use directly the line fluxes measured by Spitzer-IRS. In particular, we use those measured in the SH mode, which cover a wider wavelength range and, when there is an overlap, agree very well with the line fluxes measured in the SL mode. Assuming an electron temperature of 10 000 K (e.g. Heydari-Malayeri & Testor, 1986), the observed [S iii] 33.5/18.7 line ratio gives a much lower electron density ( cm-3) than the rms electron density derived from the 6 cm continuum observations, i.e. 1850 cm-3, estimated by using the 130 mJy measured by Indebetouw et al. (2004) and a source diameter of 53 (see Sect. 2.1). We believe this is because of the different apertures through which both [S iii] lines are observed (see Table 4); we might perfectly be overestimating the [S iii] 33.5 m line flux associated with A2. The observed [Ne iii] 36.0/15.5 indicates a density cm-3.
In the calculation of ionic abundances, we use the H line flux ( erg s-1 cm-2) predicted directly from radio continuum observations. When compared with the H line flux measured by Heydari-Malayeri et al. (2002), we get a visible extinction around 2.5, slightly higher than the mean estimation given by these authors (, see Sect. 3.2). We also assume an electron density of 1850 cm-3. This density is again lower than the critical densities of the lines involved in the calculations. We obtain Ne+/H, Ne++/H, S++/H and S+3/H. We can as well estimate the Ar+ and Ar++ ionic abundances using the [Ar ii] and [Ar iii] line fluxes measured by Spitzer-IRS in the SL mode. We obtain Ar+/H and Ar++/H.
The abundances of Ne, S and Ar are given in Table 6. The Ne abundance agrees well with the optical and infrared estimates. In the case of S, adding the contributions of S++ and S3+ only accounts for 50% of the expected sulphur abundance, similarly to what we find for N88 A. Heydari-Malayeri & Testor (1986) estimate a S++/H+ abundance only 15% higher than the value we calculate, and an extremely low S+/H+ abundance (about ). On the other hand, for this region the S+3/H+ is sufficiently low that one does not expect a significant contribution in the form of S+4. Adding the contribution of S+, the total S/H abundance we obtain is , about 0.3 times the sulphur solar abundance (Asplund et al., 2005), instead of the canonical 0.5 value. This abundance is in between the lower and upper limits determined by Heydari-Malayeri & Testor (1986). It is, however, slightly lower than the S abundance obtained by Vermeij & van der Hulst (2002).
A larger discrepancy is found in the case of Ar. The Ar abundance we obtain is about 2 times lower than the one estimated by Vermeij & van der Hulst (2002) using ISO-SWS. As mentioned previously for N160 A1 in Sect. 4.2.2, aperture mismatches are probably the cause of this difference.
| Flux density | Band | Reference | ||
| (m) | (m) | (mJy) | ||
| 1.25 | 0.30 | 0.08 | 1 | |
| 1.65 | 0.30 | 0.24 | 1 | |
| 2.15 | 0.32 | 1.10.2 | 1 | |
| 3.56 | 0.75 | 502 | IRAC-3.6 m | 2 |
| 3.76 | 0.70 | 809 | 3 | |
| 4.52 | 1.01 | 1903 | IRAC-4.5 m | 2 |
| 4.69 | 0.68 | 26725 | 3 | |
| 5.73 | 1.42 | 5476 | IRAC-5.8 m | 2 |
| 7.91 | 2.93 | 85222 | IRAC-8.0 m | 2 |
| 8.38 | 0.96 | 845272 | 3 | |
| 9.69 | 1.50 | 437241 | 3 | |
| 11.88 | 6.53 | 123 | IRAS-12 m | 4 |
| 12.85 | 1.38 | 3027558 | 3 | |
| 18.06 | 4.12 | 60811680 | 3 | |
| 23.80 | 9.12 | 113 | IRAS-25 m | 4 |
| 50 | 20 | 230 | KAO | 5 |
| 60.85 | 25.89 | 623 | IRAS-60 m | 4 |
| 71 | 19 | MIPS-70 m | 2 | |
| 100 | 50 | 300 | KAO | 5 |
| 102.44 | 39.55 | 791 | IRAS-60 m | 4 |
| 1.3d3 | 19914 | SEST | 1 |
4.3 The spectral energy distribution of the massive YSO N160A-IR
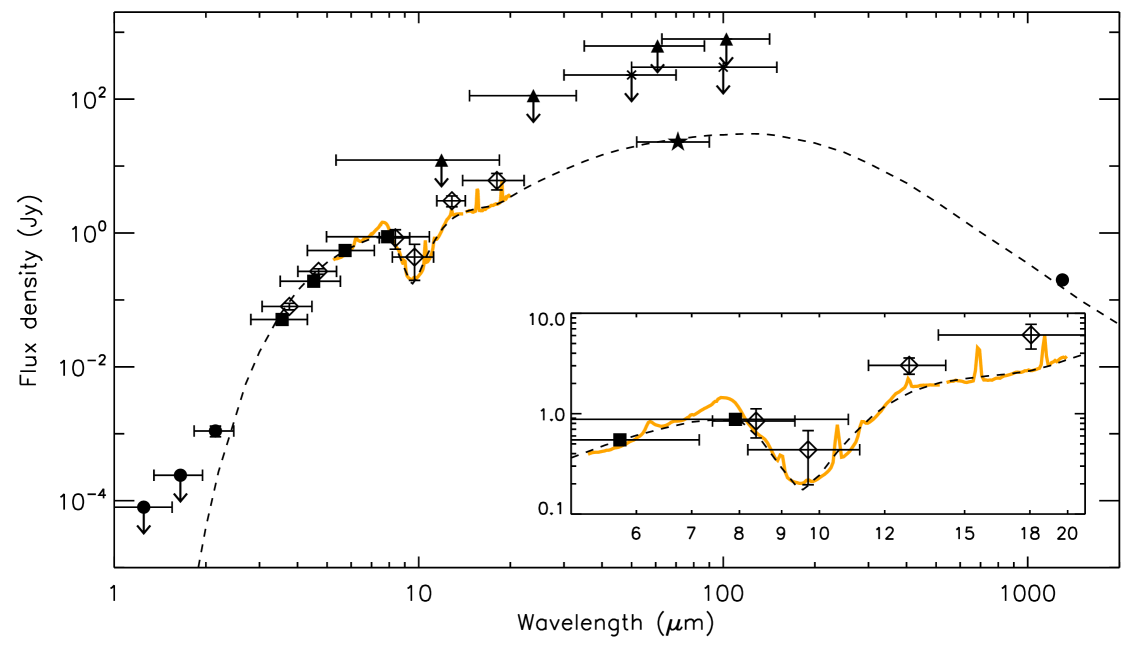
Table 7 compiles all the available photometry for N160 A-IR, where no color corrections are applied. The IRAC photometry has been obtained using an aperture of 72. For MIPS, we use a 16″ aperture (note that the pixel scale is 4″ pixel-1) centered on the position of the YSO. The photometry of Epchtein et al. (1984) was obtained using apertures of 33 for the and bands, and 10″ for the , and bands. Far-infrared KAO flux densities are integrated over 1′ and hence are taken as upper limits. We also take IRAS values as upper limits. The beam width of SEST at 1.3 mm is 22″. The photometry is plotted, together with the Spitzer-IRS SL and LL (2nd order) spectra, in Fig. 8. The LL spectrum (2nd order), which is observed in a 10″ aperture, was scaled down by a factor of 1.6 to the level of the SL spectrum, observed in a smaller aperture of 55. The 5-20 m photometry agrees well with the observed spectra.
The SED of N160 A-IR has been reproduced with the dust radiative transfer model dusty (Ivezić et al., 1999) as an attempt at deriving approximate quantitative information about this YSO. For dusty we just have to specify the normalized spectrum of the central star, the dust composition mix and its radial distribution. The code computes the dust temperature radial distribution and the emerging radiation field. The dust composition can be chosen from a variety of grain types, but we decided to use the standard composition (Weingartner & Draine, 2001), i.e. silicate and graphite from Draine & Lee (1984), and amorphous carbon from Hanner (1988). The relative proportion of each component is a free parameter. A more detailed spectrum than the one we have is necessary to investigate the presence of other types of grains. We can, however, assess the presence or absence of silicate, graphite and amorphous carbon from the SED plotted in Fig. 8. The depth of the absorption at 9.7 m, for instance, is very sensitive to the relative proportion of silicate. In the absence of silicate, graphite will be responsible for most of the emission below 9 m, while amorphous carbon will mostly emit between 20 and 100 m (Plante & Sauvage, 2002).
We placed a blackbody with an effective temperature of 50 000 K in the center of a spherically symmetric dust cloud. The result is hardly dependent on the exact value of this temperature within a reasonable range. The geometry of the massive YSO, on the other hand, is almost certainly not spherically symmetric, but the present data are unable to constrain more detailed geometries. We also assume a standard MNR grain size distribution (Mathis et al., 1977).
The best model fit (dashed line in Fig. 8) uses a mixture with silicates (50%), graphite (30%) and amorphous carbon grains (20%), and a single power law of the form for the radial profile of the density in the dust cloud. The observations are reproduced with an mag. The dust cloud extends from an inner radius of a few hundred () AU, at which the dust temperature reaches 590 K, to an outer radius of about 1 pc (but note that the observable size of the source will depend on the selected wavelength). The observed SED is well reproduced, specially the silicate feature at 9.7 m. This model gives an optical depth of the 9.7 m silicate of 4.29, and a ratio of the fluxes at 9.7 and 18 m of .
The absolute bolometric luminosity of the central source is the simplest parameter to derive from the model. We obtain a bolometric luminosity of . It is derived by scaling the model SED to fit the 1.3 mm data point, and using a value for the distance to the LMC of 50 kpc (Storm et al., 2004). This luminosity suggests a central star of spectral type O6 V and about (Martins et al., 2005). The fit by Henning et al. (1998) derived a higher bolometric luminosity (), but their SED was scaled up to the ISO-SWS spectrum centered on the YSO, whose continuum flux level is about 10 times higher than that observed by TIMMI2 and Spitzer-IRS (see panel e of Fig. 5).
5 Conclusions
We have presented MIR spectra of two Magellanic Cloud H ii regions: N88 A in the SMC and N160 A in the LMC. N88 A is a compact (″ in diameter) nebula, but N160 A is comprised of 3 bright components: two high-excitation blobs, A1 and A2, and a young stellar object, N160 A-IR. These spectra have been obtained with TIMMI2 on the ESO 3.6 m telescope and the Infrared Spectrograph (IRS) onboard the Spitzer Space Telescope. With these high-spatial resolution data, we have been able to separate for the first time, and from a spectroscopic point of view, the three components of N160 A.
The spectra show a wide variety in terms of continuum, lines and molecular bands strength. N88 A, N160 A1 and N160 A2 show a rising dust continuum, PAH bands and strong fine-structure lines. These spectra are typical of H ii regions. On the contrary, the YSO present in N160 A shows a strong dust continuum with deep silicate absorption.
The influence of spatial resolution is investigated by means of comparing these TIMMI2 and Spitzer-IRS spectra with ISO-SWS observations. Observations of N88 A indicate that the fluxes observed by ISO-SWS and Spitzer-IRS come, in spite of their large apertures, exclusively from the compact 3″ source. We derived a [S iii] electron density of 2275 cm-3, and elemental abundances of for Ne, and of for S.
Concerning N160 A1 and N160 A2, aperture effects are readily observed. In this respect, it is worthwhile to note the large differences observed in, for example, the [Ne iii]/[Ne ii] line ratio, given that this ratio is generally used as a diagnostic for the effective temperature of the central ionizing star(s). This ratio tends to decrease with aperture size, which reflects the complexity of the ionization structure of N160 A. The variations seen in the [Ne iii]/[Ne ii] line ratio, with the highest value found close to the HEBs, suggest that the two HEBs are ionized by very hot stars, while the extended emission is ionized by cooler stars probably located in the central cluster. This central cluster is situated between A1 and A2, and extends over several arcseconds.
For A1, we derived a [S iii] electron density of 780 cm-3 and elemental abundances of for Ne, of for S and of for Ar. For A2, we derived elemental abundances of for Ne, of for S and of for Ar. In the case of A2, the derivation of the electron density using the [S iii] lines suffers from aperture mismatches. We also observed weak and extended [S iv] emission with TIMMI2, which is most likely related to the central stellar cluster located between A1 and A2. The PAH emission bands in both A1 and A2 show intensity ratios and band profiles typical of Magellanic Cloud H ii regions.
Finally, we modeled the spectral energy distribution of the YSO N160 A-IR with the dust radiative transfer model dusty. The best model has a mixture of silicates (50%), graphite (30%) and amorphous carbon grains (20%) with a single power law dependence of the density with radius proportional to , where is the radius. This corresponds to a visual magnitude of 7010 mag and a 9.7 m optical silicate depth of 4.3. A bolometric luminosity of was derived, suggesting a central star of spectral type O6 V and about . This luminosity is about 10 times lower than the previous estimate of Henning et al. (1998).
Acknowledgements.
This work is based on observations obtained at the European Southern Observatory, La Silla, Chile (ID 72.C-0600) and observations made with the Spitzer Space Telescope, which is operated by the Jet Propulsion Laboratory, California Institute of Technology under a contract with NASA. It is also based on observations with ISO, an ESA project with instruments funded by ESA Member States (especially the PI countries: France, Germany, the Netherlands and the United Kingdom) and with the participation of ISAS and NASA. During this work, NLMH has been supported by a Juan de la Cierva fellowship from the Spanish Ministerio de Ciencia y Tecnología (MCyT). This work has also been partially funded by the Spanish MCyT under project AYA2004-07466.References
- Allamandola et al. (1989) Allamandola, L. J., Tielens, A. G. G. M., & Barker, J. R. 1989, ApJS, 71, 733
- Asplund et al. (2005) Asplund, M., Grevesse, N., & Sauval, A. J. 2005, in Astronomical Society of the Pacific Conference Series, Vol. 336, Cosmic Abundances as Records of Stellar Evolution and Nucleosynthesis, ed. T. G. Barnes, III & F. N. Bash, 25–+
- Cohen et al. (1999) Cohen, M., Walker, R. G., Carter, B., et al. 1999, ApJ, 117, 1864
- Davies et al. (1976) Davies, R. D., Elliott, K. H., & Meaburn, J. 1976, Royal Astronomical Society, Memoirs, 81, 89
- de Graauw et al. (1996) de Graauw, T., Haser, L. N., Beintema, D. A., et al. 1996, A&A, 315, L49
- Draine & Lee (1984) Draine, B. T. & Lee, H. M. 1984, ApJ, 285, 89
- Epchtein et al. (1984) Epchtein, N., Braz, M. A., & Sevre, F. 1984, A&A, 140, 67
- Fazio et al. (2004) Fazio, G. G., Hora, J. L., Allen, L. E., et al. 2004, ApJS, 154, 10
- Gordon et al. (2003) Gordon, K. D., Clayton, G. C., Misselt, K. A., Landolt, A. U., & Wolff, M. J. 2003, ApJ, 594, 279
- Hanner (1988) Hanner, M. 1988, Grain optical properties, Tech. rep., Workshop held at Ithaca
- Hanson et al. (2002) Hanson, M. M., Luhman, K. L., & Rieke, G. H. 2002, ApJS, 138, 35
- Henize (1956) Henize, K. G. 1956, ApJS, 2, 315
- Henning et al. (1998) Henning, T., Klein, R., Chan, S. J., et al. 1998, A&A, 338, L51
- Heydari-Malayeri et al. (2002) Heydari-Malayeri, M., Charmandaris, V., Deharveng, L., et al. 2002, A&A, 381, 941
- Heydari-Malayeri et al. (1999) Heydari-Malayeri, M., Charmandaris, V., Deharveng, L., Rosa, M. R., & Zinnecker, H. 1999, A&A, 347, 841
- Heydari-Malayeri et al. (2007) Heydari-Malayeri, M., Rosa, M. R., Charmandaris, V., et al. 2007, in Proceedings of the 41st ESLAB Symposium ”The Impact of HST on European Astronomy”, 29 May to 1 June 2007, ESTEC, Noordwijk, Netherlands; eds. Guido De Marchi and Duccio Macchetto
- Heydari-Malayeri & Testor (1986) Heydari-Malayeri, M. & Testor, G. 1986, A&A, 162, 180
- Hony et al. (2001) Hony, S., Van Kerckhoven, C., Peeters, E., et al. 2001, A&A, 370, 1030
- Houck et al. (2004) Houck, J. R., Roellig, T. L., van Cleve, J., et al. 2004, ApJS, 154, 18
- Indebetouw et al. (2004) Indebetouw, R., Johnson, K. E., & Conti, P. 2004, AJ, 128, 2206
- Ivezić et al. (1999) Ivezić, v., Nenkova, M., & Elitzur, M. 1999, User Manual for DUSTY, University of Kentucky Report
- Kessler et al. (1996) Kessler, M. F., Steinz, J. A., Anderegg, M. E., et al. 1996, A&A, 315, L27
- Kurt et al. (1999) Kurt, C. M., Dufour, R. J., Garnett, D. R., et al. 1999, ApJ, 518, 246
- Lucke & Hodge (1970) Lucke, P. B. & Hodge, P. W. 1970, AJ, 75, 171
- Martín-Hernández et al. (2005) Martín-Hernández, N. L., Vermeij, R., & van der Hulst, J. M. 2005, A&A, 433, 205
- Martins et al. (2005) Martins, F., Schaerer, D., & Hillier, D. J. 2005, A&A, 436, 1049
- Mathis et al. (1977) Mathis, J. S., Rumpl, W., & Nordsieck, K. H. 1977, ApJ, 217, 425
- McGee & Milton (1966) McGee, R. X. & Milton, J. A. 1966, Australian Journal of Physics, 19, 343
- Mokiem et al. (2004) Mokiem, M. R., Martín-Hernández, N. L., Lenorzer, A., de Koter, A., & Tielens, A. G. G. M. 2004, A&A, 419, 319
- Morisset et al. (2004) Morisset, C., Schaerer, D., Bouret, J.-C., & Martins, F. 2004, A&A, 415, 577
- Oliveira et al. (2006) Oliveira, J. M., van Loon, J. T., Stanimirović, S., & Zijlstra, A. A. 2006, MNRAS, 372, 1509
- Panagia & Walmsley (1978) Panagia, N. & Walmsley, C. M. 1978, A&A, 70, 411
- Peeters et al. (2002a) Peeters, E., Hony, S., Van Kerckhoven, C., et al. 2002a, A&A, 390, 1089
- Peeters et al. (2002b) Peeters, E., Martín-Hernández, N. L., Damour, F., et al. 2002b, A&A, 381, 571
- Plante & Sauvage (2002) Plante, S. & Sauvage, M. 2002, AJ, 124, 1995
- Rieke et al. (2004) Rieke, G. H., Young, E. T., Engelbracht, C. W., et al. 2004, ApJS, 154, 25
- Rubin et al. (1988) Rubin, R. H., Simpson, J. P., Erickson, E. F., & Haas, M. R. 1988, ApJ, 327, 377
- Rubin et al. (1994) Rubin, R. H., Simpson, J. P., Lord, S. D., et al. 1994, ApJ, 420, 772
- Storm et al. (2004) Storm, J., Carney, B. W., Gieren, W. P., et al. 2004, A&A, 415, 531
- Testor et al. (2003) Testor, G., Lemaire, J. L., & Field, D. 2003, A&A, 407, 905
- Testor et al. (2005) Testor, G., Lemaire, J. L., Field, D., & Callejo, G. 2005, A&A, 434, 497
- Testor & Pakull (1985) Testor, G. & Pakull, M. 1985, A&A, 145, 170
- Vermeij et al. (2002a) Vermeij, R., Damour, F., van der Hulst, J. M., & Baluteau, J.-P. 2002a, A&A, 390, 649
- Vermeij et al. (2002b) Vermeij, R., Peeters, E., Tielens, A. G. G. M., & van der Hulst, J. M. 2002b, A&A, 382, 1042
- Vermeij & van der Hulst (2002) Vermeij, R. & van der Hulst, J. M. 2002, A&A, 391, 1081
- Weingartner & Draine (2001) Weingartner, J. C. & Draine, B. T. 2001, ApJ, 548, 296
- Werner et al. (1978) Werner, M. W., Becklin, E. E., Gatley, I., et al. 1978, MNRAS, 184, 365
- Werner et al. (2004) Werner, M. W., Roellig, T. L., Low, F. J., et al. 2004, ApJS, 154, 1