Combined Chandra, XMM-Newton and Hubble Space Telescope observations of the Galactic globular cluster NGC 2808
Abstract
Aims. Using new Chandra X-ray observations and existing XMM-Newton X-ray and Hubble far ultraviolet observations, we aim to detect and identify the faint X-ray sources belonging to the Galactic globular cluster NGC 2808 in order to understand their role in the evolution of globular clusters.
Methods. We present a Chandra X-ray observation of the Galactic globular cluster NGC 2808. We classify the X-ray sources associated with the cluster by analysing their colours and variability. Previous observations with XMM-Newton and far ultraviolet observations with the Hubble Space Telescope are re-investigated to help identify the Chandra sources associated with the cluster. We compare our results to population synthesis models and observations of other Galactic globular clusters.
Results. We detect 113 sources, of which 16 fall inside the half-mass radius of NGC 2808 and are concentrated towards the cluster core. From statistical analysis, these 16 sources are very likely to be linked to the cluster. We detect short-term (1 day) variability in X-rays for 7 sources, of which 2 fall inside the half-mass radius, and long-term (28 months) variability for 10 further sources, of which 2 fall inside the half-mass radius. Ultraviolet counterparts are found for 8 Chandra sources in the core, of which 2 have good matching probabilities and have ultraviolet properties expected for cataclysmic variables. We find one likely neutron star-quiescent low-mass X-ray binary and 7 cataclysmic variable candidates in the core of NGC 2808. The other 8 sources are cataclysmic variable candidates, but some could possibly be active binaries or millisecond pulsars. We find a possible deficit of X-ray sources compared to 47 Tuc which could be related to the metallicity content and the complexity of the evolution of NGC 2808.
Key Words.:
Galaxy: globular clusters: individual: NGC 2808 – X-rays: general – Stars: binaries: close – Cataclysmic variables1 Introduction
Globular clusters (GCs) are old, gravitationally bound stellar systems which can have extremely high stellar densities, especially in their core regions. In such an environment, dynamical interactions between the cluster members are inevitable, leading to a variety of close binary (CB) systems and other exotic stellar objects. The observed overabundance of neutron star (NS) low-mass X-ray binaries (LMXBs) in GCs relative to the Galactic field was explained by the dynamical processes occurring in the dense cores of GCs (Fabian et al. 1975). In contrast, evolution of a primordial binary into an LMXB in a GC is considered to be much less likely (Verbunt & Hut 1987). Observations also support the fact that quiescent LMXBs (qLMXBs) in GCs scale with the cluster encounter rate (Gendre et al. 2003a; Pooley et al. 2003), implying that qLMXBs are formed through dynamical processes in the dense cores. As white dwarfs (WDs) are far more common than NSs, we would then also expect many more close binaries containing an accreting WD primary, i.e. cataclysmic variables (CVs).
The dynamically-formed CBs are expected to be found in the cores of GCs, where the stellar densities are at a maximum. The less dense regions outside the cores might be populated by CBs that evolved from primordial binaries (e.g. Davies 1997) which are unlikely to survive in the dense core region. Hurley et al. (2007) found that the combined effects of new binary creation and mass segregation exceed the destruction of primordial binaries in the central region of GCs, leading to a marked increase of the binary fraction in the central regions. Thus, we expect the majority of CBs, which are more massive than the mean stellar mass, to be located inside the half-mass radius. Outside the half-mass radius, the primordial binary fraction is well preserved (Hurley et al. 2007).
CBs are important for our understanding of GC evolution, since the binding energy of a few, very close binaries can rival that of a modest-sized GC (e.g. Elson et al. 1987; Hut et al. 1992, 2003, and references therein). In the core, binaries are subject to encounters and hard binaries become harder while transferring their energy to passing stars. Thus, CBs can significantly affect the dynamical evolution of the cluster. If there are only a few CBs, thermal processes dominate the cluster evolution, leading to core collapse followed by GC disruption on a timescale shorter than the mean age of GCs, estimated to be Gyr (Carretta et al. 2000). In contrast, the presence of many CBs leads to violent interactions, which heat the cluster, delay the core collapse, and promote its expansion. This depends critically on the number of CBs, which is still poorly known.
Finding and studying these systems has proven to be extremely difficult, since the spatial resolution and detection limits of most available telescopes are insufficient for their detection. Only with the improved sensitivity and imaging quality of XMM-Newton and Chandra in the X-ray (e.g. Webb et al. 2004, 2006; Heinke et al. 2003a, 2006) and HST in the ultraviolet (UV) to infrared (IR) wavebands (Grindlay et al. 2001; Albrow et al. 2001; Edmonds et al. 2003a, b; Knigge et al. 2002, 2003, and references therein) has it become possible to finally detect significant numbers of CB systems in GCs.
The 13 bright X-ray sources found in the 150 known Galactic GCs are LMXBs showing type I X-ray bursts (e.g. Lewin & Joss 1983), whereas the faint sources belonging to the clusters are qLMXBs, CVs, active binaries (ABs, generally RS CVn systems), or millisecond pulsars (MSPs). Multiwavelength studies can be used to identify the faint X-ray sources. For example, qLMXBs are usually identified by their soft blackbody-like or hydrogen atmosphere X-ray spectra (e.g. Gendre et al. 2003a, b), CVs can be confirmed by their blue, variable optical counterpart with hydrogen emission lines in their spectra (e.g. Webb et al. 2004), ABs by their main-sequence, variable optical counterparts (e.g. Edmonds et al. 2003a), and MSPs by their radio counterpart (e.g. Grindlay et al. 2001).
Here, we present an X-ray study of the massive () GC NGC 2808 (, -). This intermediate metallicity GC (, Walker 1999) lies at a distance of 9.6 kpc and is reddened by (Harris 1996). An absorption column of N is derived from the reddening with the relation computed by Predehl & Schmitt (1995). The cluster has a very dense and compact core (), a half-mass radius of , a tidal radius of , and a half-mass relaxation time of yrs (Harris 1996).
NGC 2808 has received considerable attention in the literature and has been observed in the optical in detail as this GC is one of the most extreme examples with an unusual horizontal branch (HB) morphology, as first noted by Harris (1974). It shows a bimodal HB and one of the longest blue HB tails, the so-called extreme HB (EHB), with prominent gaps between the red HB (RHB), blue HB (BHB) and EHB (see also Bedin et al. 2000; Carretta et al. 2006). Recently, Piotto et al. (2007) found that NGC 2808’s main sequence (MS) is separated into three branches, which might be associated with the complex HB morphology and abundance distribution, and might be due to successive rounds of star formation with different helium abundances. NGC 2808 is proposed as a good candidate to harbour an intermediate mass black hole (IMBH) in its core, due to its optical luminosity profile and EHB morphology (Miocchi 2007).
The core of NGC 2808 has been imaged with the Space Telescope Imaging Spectrograph (STIS) on board the Hubble Space Telescope (HST) in the far-UV (FUV) and the near-UV (NUV). Dieball et al. (2005) used the data set with an emphasis on the dynamically-formed stellar populations like CVs and blue stragglers (BSs) and young WDs. They found 40 WD, 60 BS and 60 CV candidates in the field of view that covers the core of the cluster. Two of the CV candidates are variable (FUV sources 222 and 397).
NGC 2808 has also been observed with XMM-Newton in Feb. 2005. Servillat et al. (2008) found 96 sources in the field of view (equivalent to the tidal radius), of which five fall inside the half-mass radius and are likely to be linked to the cluster. One qLMXB candidate and four CV candidates were discovered in the core of NGC 2808. However, several sources remained unresolved.
2 X-ray observations
NGC 2808 was observed with the Chandra X-ray Observatory and the Chandra Advanced CCD Imaging Spectrometer-Imager (ACIS-I) at its focus on 2007 June 19–21 (28 months after the XMM-Newton observation) for two distinct exposures of 46 and 11 kilo seconds (ks). The four front-illuminated ACIS-I chips were used as well as the front-illuminated ACIS-S2 chip and the back-illuminated ACIS-S3 chip at the edge of the field of view. The data were taken in faint, timed-exposure mode. The core of NGC 2808 falls inside the ACIS-I3 chip, where the highest resolution is achieved.
2.1 Data reduction
Data reduction was performed using the CIAO v3.4 software111http://cxc.harvard.edu/ciao (Fruscione et al. 2006) and the CALDB v3.4.0 set of calibration files (gain maps, quantum efficiency, quantum efficiency uniformity, effective area). We reprocessed the level 1 event files of both observations without including the pixel randomization that is added during standard processing. This method slightly improves the point-spread function (PSF). We removed cosmic-ray events which could be detected as spurious faint sources using the tool acis_detect_afterglow, and identified bad pixels with the tool acis_run_hotpix. The event lists were then filtered for grades, status, and good time intervals (GTIs), as it is done in the standard processing. We selected events within the energy range 0.3–10.0 keV, where good sensitivity is achieved.
The two observations are successive, the fields of view and the roll angles are similar, and the PSFs from one observation to another are also similar. Therefore the two epochs can be processed as a single observation. We thus reprojected the event list of the second observation to match the first observation, and merged the two event lists using the thread merge_all. We generated an exposure map of the field of view using the same thread. This led to 56.9 ks of clean observation (sum of GTIs).
2.2 Source detection
In order to obtain a list of source candidates, we employed the CIAO wavelet-based wavdetect tool for source detection in the field of view covered by the four ACIS-I chips. Two energy bands were used, the 0.3–10.0 keV band with all events which allows the detection of the faintest sources, and 0.5–6.0 keV with a higher signal to noise ratio which gives secure detections. We selected scales of 1.0, 1.4, 2.0, 2.8, 4.0, and 5.6 pixels. The scales were chosen to look for narrow PSF sources on-axis and ensure optimal separation, and larger PSF sources at the edge of the detectors, where the PSF is degraded. We selected a threshold probability of , designed to give one false source per pixels. This led to the detection of 88 source candidates of which may be false. Of these sources, eleven fall inside the half-mass radius of NGC 2808.
To this list, we added other source candidates in order to test their significance in further processing. We added 14 X-ray sources previously detected with XMM-Newton (Servillat et al. 2008). Seven of them fall on the two ACIS-S chips where we did not use wavdetect as the PSF is too large, and seven others were not detected by wavdetect on the ACIS-I chips and have possibly varied in flux. Several other faint sources can be picked out by eye, but are not identified by wavdetect, possibly because of crowding on-axis and lower signal to noise at the edge of the detector due to the vignetting. We thus added 22 source candidates, of which 10 are inside the half-mass radius of NGC 2808. In total we listed 124 source candidates.
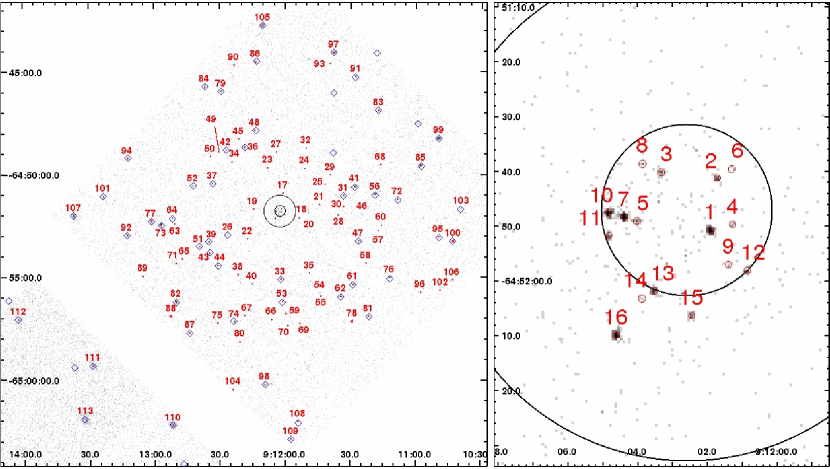
We then used ACIS Extract222http://www.astro.psu.edu/xray/docs/TARA/ae_users_guide.html (Broos et al. 2002) to refine the positions of the sources and to estimate the significance of each candiate source. We excluded sources with a probability of being a source lower than 99.99%. This probability is estimated from the number of source candidate counts compared to the surrounding background counts, taking into account Poisson statistics (Broos et al. 2002, §5.9.3). Our final list has 113 sources, of which 16 are located inside the half-mass radius of NGC 2808. All of these sources have more than four counts. They are numbered according to their offset from the center of NGC 2808. Their properties are listed in Table LABEL:tab:chandra_sources, and a source map is presented in Fig. 1. The core image is compared to the XMM-Newton image of Servillat et al. (2008) in Sect. 3.1. From the faintest sources detected, the limiting flux of the observation is , corresponding to a limiting luminosity of (at the distance of the cluster).
The position error reported in Table LABEL:tab:chandra_sources is used in this paper to look for matching XMM-Newton and HST FUV sources. One may estimate the absolute position error by adding in quadrature the pointing accuracy of Chandra (, error) and the spatial distortion error over the detectors (, error).
2.3 Members of NGC 2808
| Detection limit | Completeness limit | ||||
|---|---|---|---|---|---|
| Annulus | Expected | Detected | Expected | Detected | |
| 0′ – | 1.8′ | 20 | 12 | ||
| 1.8′ – | 3.8′ | 20 | 11 | ||
| 3.8′ – | 7.0′ | 43 | 30 | ||
| 0′ – | 0.76′ | 16 | 11 | ||
We estimated the number of background X-ray sources we expect to detect in our observation in order to deduce the number of sources likely to be linked to the cluster.
We divided the field of view into three annuli to account for vignetting, and to include in each region at least 20 detected sources. We used the – relation calculated by Hasinger et al. (2005) (see also Giacconi et al. 2001; Hasinger et al. 2001) to convert in each annulus our minimum detectable fluxes () into the number of background sources expected (). This relation was derived from a survey of soft X-ray active galactic nuclei (AGN) in the energy range 0.5–2.0 keV performed with both XMM-Newton and Chandra. We took into account two errors on the value read from the – diagram which were added in quadrature: the error on the Chandra flux estimate (see Table LABEL:tab:chandra_sources) converted to an error in while reading the – diagram, and the precision of the relation which includes Poisson noise (see error bars in Giacconi et al. 2001, their Fig. 3). For each annulus, we estimated the minimum detectable unabsorbed flux of a point source in the energy range 0.5–2.0 keV using WebPIMMS333http://heasarc.gsfc.nasa.gov/Tools/w3pimms.html v3.9b (Mukai 1993). We assumed for the source a power law model of photon index 1.5 (mean of the detected sources) and the absorption of the cluster. We assumed a minimum detectable count rate corresponding to two cases: the detection limit (the count rate of the faintest source in each annulus) and the completeness limit (twice the count rate of the faintest source). These values were corrected for the vignetting in each annulus using the exposure map. The estimates might be slightly overestimated for the detection limit as we have an incomplete sample of sources. The results are shown in Table 2.
An excess is clearly seen in the center. In the annulus 1.8–3.8′, an excess is seen if we assume the detection limit (Table 2), however, with the completeness limit this excess is not confirmed. In the last annulus, we detect the expected number of background sources within the errors. We performed the same estimation inside the half-mass radius of NGC 2808 and sources are expected. Therefore, the 16 sources inside the half-mass radius are very likely to be cluster sources, with perhaps one background source aligned fortuitously. As NGC 2808 has a low Galactic latitude (, Harris 1996), we may also expect foreground sources such as active stars or field CVs.
2.4 Spectral and variability analysis
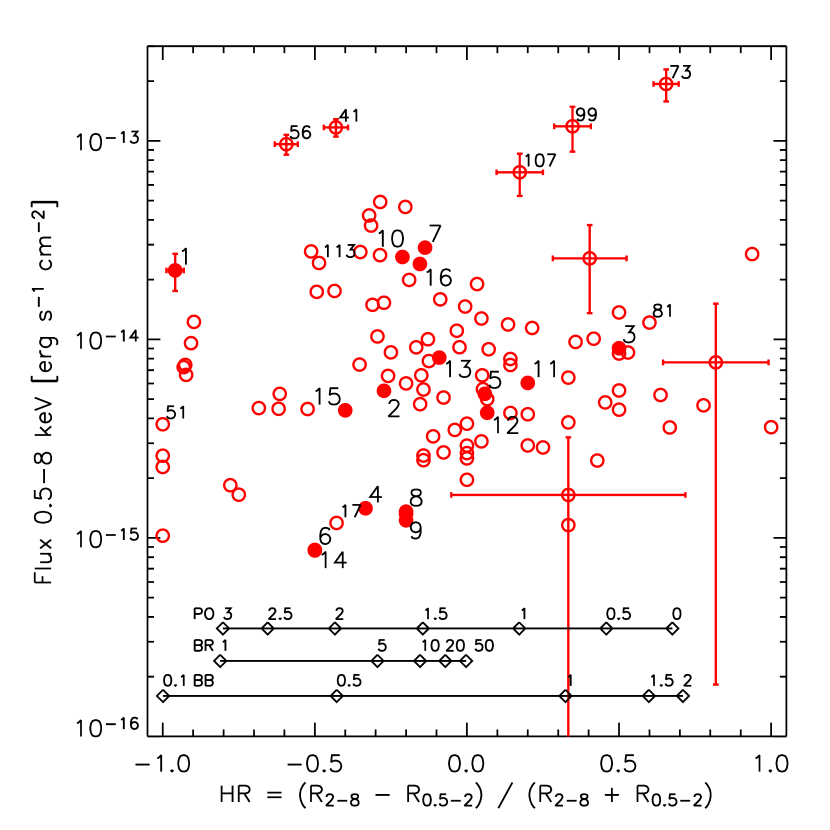
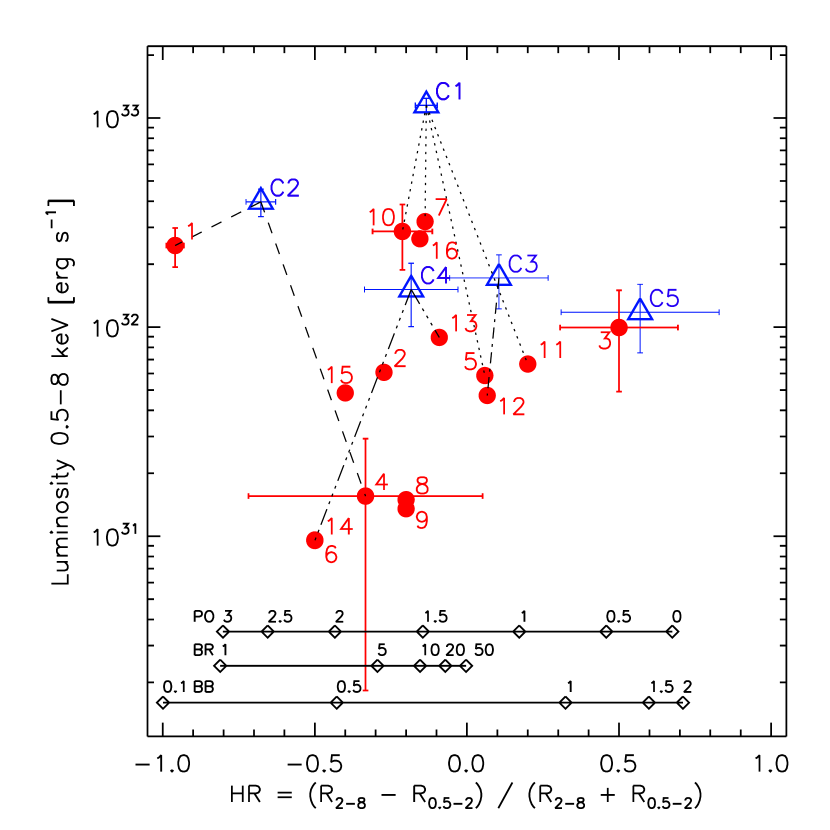
We used the ACIS Extract procedure ae_standard_extraction to extract spectra and lightcurves for each source. We estimated for each source an optimal extraction region to enclose 90% of the PSF, and estimated the background by selecting 100 surrounding counts outside source regions. None of the extraction regions overlap. The fluxes are then estimated from the count rates in several bands, and the 0.5–8 keV flux is derived. Hardness ratios (colours) are estimated from two energy bands, 0.5–2 and 2–8 keV. The response files of the detector were computed with ACIS Extract for each source using the CIAO tasks mkarf and mkacisrmf with the associated gain files. We performed a generic spectral fitting of the sources with a power law model and the absorption of the cluster using Xspec v12.2 (Arnaud 1996) through the procedure acis_extract (FIT_SPECTRA stage). The unabsorbed flux is estimated from the best fit of this model. All these results are reported in Table LABEL:tab:chandra_sources, and we show a colour-flux diagram of all the sources in Fig. 2.
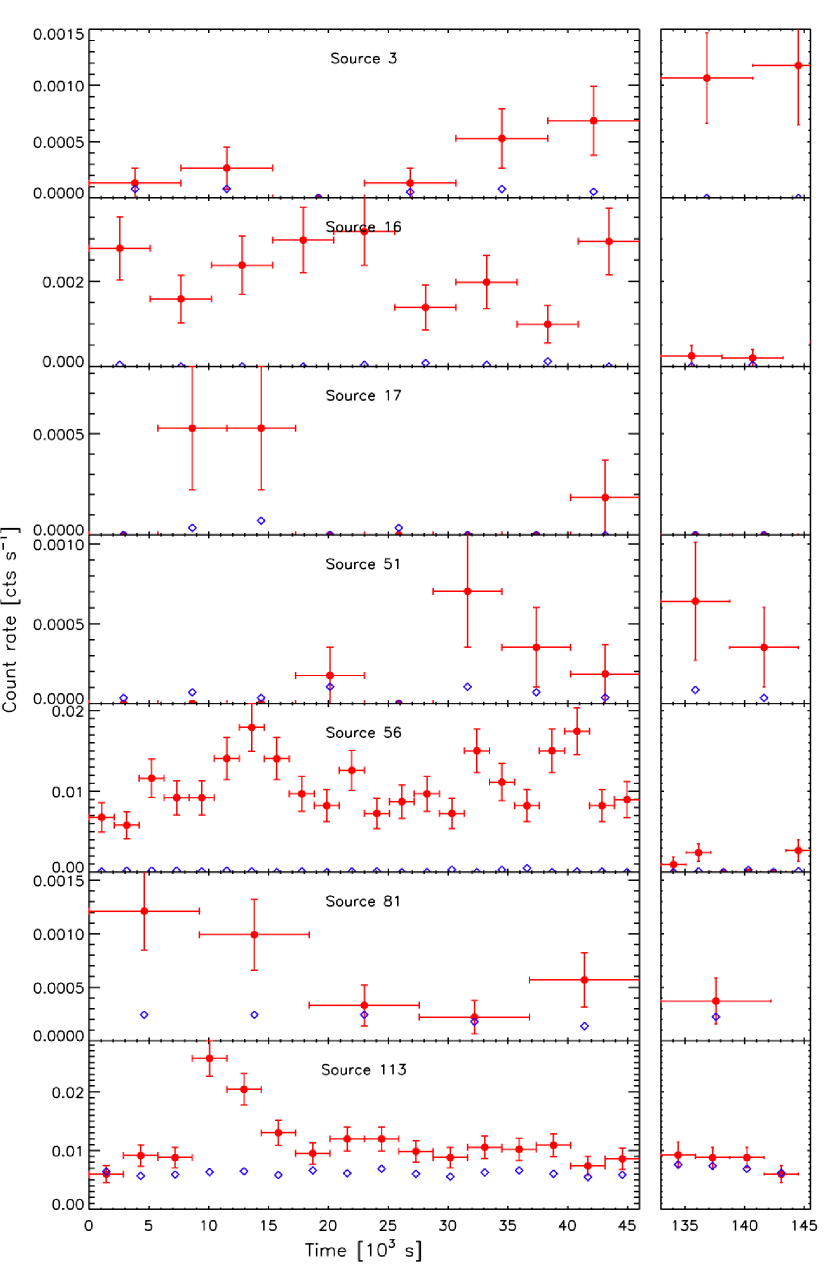
A Kolmogorov-Smirnov (KS) test was performed on the extracted and unbinned lightcurve in order to detect variable sources. Seven sources are found to have a KS probability of constancy lower than , of which two are located in the core of NGC 2808 (sources 3 and 16), and we confirmed the variability of these sources using Poisson statistics. We extracted their lightcurves and the background lightcurves in an annulus around the source with CIAO dmextract task. The binned lightcurves are shown in Fig. 3.
3 Comparison with XMM-Newton observations
The XMM-Newton X-ray observation of NGC 2808, performed on 2005 February (Servillat et al. 2008), was reprocessed in order to match our Chandra energy bands (0.5–2 and 2–8 keV). We used the XMM-Newton Science Analysis System444http://xmm.vilspa.esa.es/sas (SAS v7.1) and the most recent calibration data files. The data reduction is detailed in Servillat et al. (2008). The 96 detected sources in the XMM-Newton field of view were reprocessed with emldetect, without refining the position, in order to extract fluxes and hardness ratios. These values are reported in Table LABEL:tab:chandra_sources for the sources that are inside the Chandra field of view. We took into account the different sensitivities of the instruments in the energy bands used. Using a power law model of photon indices 0, 1, 2 or 3 and the absorption of the cluster, we converted with WebPIMMS a given flux into Chandra ACIS-I and XMM-Newton pn count rates, and compared the hardness ratios. The following conversion factors from XMM-Newton pn to Chandra ACIS-I count rates were deduced: C and C. The corrected hardness ratios for the different models used are found to match with a maximum error of , comparable to the errors on hardness ratios (see Table LABEL:tab:chandra_sources). Hereafter we refer to the corrected hardness ratios for XMM-Newton sources.
3.1 Inside the half-mass radius
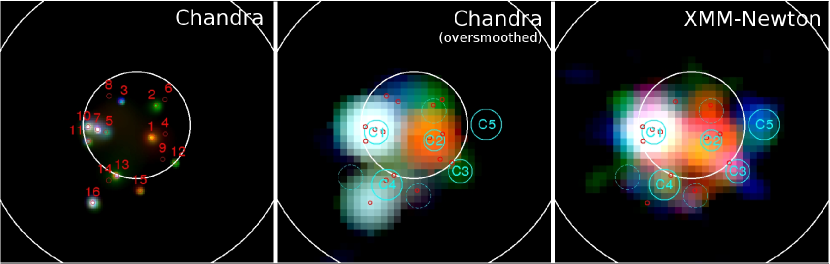
The better resolution of Chandra allowed us to resolve the core sources previously detected with XMM-Newton. At first, in order to compare these different observations, we degraded the Chandra image with a Gaussian filter to enlarge the PSF to the XMM-Newton PSF size. The result is presented in Fig. 4. We note that the images are in general very similar. XMM-Newton source C5 is clearly missing in the Chandra observation, and Chandra source 16 was not detected with XMM-Newton. We extracted a spectrum and generated response files at the position of Chandra source 16 in the XMM-Newton observation to estimate a flux detection limit for this source. We found that Chandra source 16 has varied by a factor of at least . XMM-Newton source C5 has also varied by a factor of at least .
We show a colour-luminosity diagram for Chandra core sources with corresponding XMM-Newton core sources in Fig. 5. We note that the observations are well correlated, taking into account the different resolutions. XMM-Newton source C1 is resolved into four Chandra sources (5, 7, 10 and 11) with consistent colours. XMM-Newton source C2 matches with Chandra source 1. This source appeared slightly harder than the Chandra source, probably because it is overlapped by XMM-Newton source C1 which is hard, as shown in Servillat et al. (2008). XMM-Newton source C3 is matching with Chandra source 12, and XMM-Newton source C4 has consistent parameters with Chandra source 13. We also note that Chandra sources 2 and 15 are related to detections in the XMM-Newton observation, and their fluxes are consistent with the detection limit of the latter observation (Servillat et al. 2008).
We extracted spectra and response files for XMM-Newton core sources C1, C3 and C4, and fitted with Xspec a power law with the absorption of the cluster, and a small contribution from close sources as the PSFs overlap. We also extracted a combined spectrum for Chandra sources 5, 7, 10 and 11, and spectra for Chandra sources 12 and 13, and performed a similar fitting. The results are presented in Table 3. XMM-Newton source C3 is more luminous than its matching Chandra source (12, variation).
| XMM ID | Flux | |
|---|---|---|
| C1 | ||
| C3 | ||
| C4 | ||
| Chandra ID | Flux | |
| 5, 7, 10, 11 | ||
| 12 | ||
| 13 |
3.2 Other sources
Overall, the sources are found to have consistent fluxes and colours in both observations (see Table LABEL:tab:chandra_sources). Chandra source 99 has faded by a factor 5 and has become harder. Chandra sources 31, 73 and 86 appear softer, and 109 and 111 harder than in the XMM-Newton observation ( variations).
For the seven XMM-Newton sources outside the half-mass radius and XMM-Newton source C5, that were not detected with Chandra, we estimated the count rate expected with Chandra. Then, we converted these count rates into counts according to the exposure map of our Chandra observation, i.e. correcting for the vignetting. We estimated a detection threshold by looking at the number of counts of the faintest source detected with the same vignetting. The results are given in Table 4. We conclude that XMM-Newton sources 34, 66 and C5 should have been detected, unless they have varied between XMM-Newton and Chandra observations. In particular, C5 must have varied by a factor of at least 5 in flux.
| XMM ID | XMM flux | XMM HR | Chip | Exp. | Thresh. |
|---|---|---|---|---|---|
| 34 | 1.31 0.44 | 0.39 0.13 | ACIS-I | 70 8 | 20 4 |
| 48 | 2.01 0.69 | 0.06 0.15 | ACIS-S | 115 10 | 150 12 |
| 65 | 1.04 0.47 | 0.93 0.14 | ACIS-S | 51 7 | 150 12 |
| 66 | 0.36 0.22 | 0.67 0.20 | ACIS-I | 21 4 | 6 2 |
| 69 | 0.66 0.35 | 0.30 0.25 | ACIS-I | 29 5 | 25 5 |
| 72 | 0.78 0.46 | 0.79 0.21 | ACIS-S | 74 8 | 150 12 |
| 84 | 0.27 0.28 | 0.38 1.45 | ACIS-I | 10 3 | 30 5 |
| C5 | 1.07 0.38 | 0.57 0.26 | ACIS-I | 28 5 | 4 2 |
4 Counterparts to the X-ray sources
4.1 Ultraviolet counterparts in the core
The core of NGC 2808 has been observed with the Space Telescope Imaging Spectrograph (STIS) on board the HST in January/February 2000 using the F25QTZ filter, centered at 159 nm in the FUV band, and the F25CN270 filter, centered at 270 nm in the NUV band. The mosaic of FUV images has a radius of and only covers the core region of NGC 2808.
We searched for FUV counterparts to our Chandra sources, using the FUV catalogue provided by Dieball et al. (2005). As a first step, we simply overplotted the Chandra positions on the FUV mosaic. Chandra source 7 and FUV source 222 have a close positional match with a distance of . This offset agrees with the absolute pointing error of Chandra ( error) and the additional HST absolute pointing accuracy of . FUV source 222 is the best CV candidate in the FUV catalogue, as it is a variable source located between the MS and WD cooling sequence in the FUV–NUV color-magnitude diagram (CMD), which is the expected location for CVs (Dieball et al. 2005). This source was expected to show X-ray emission, and we are confident that Chandra source 7 and FUV source 222 are the same object. The emission of Chandra source 7 is also consistent with CV emission (see §5). We therefore shifted the Chandra positions so that Chandra source 7 and FUV source 222 match exactly. No significant rotation of the field of view is expected (see for instance Edmonds et al. 2003a). This appears to be the most likely shift in order to align the FUV and X-ray images.
We searched for FUV counterparts within a maximum tolerance radius of of the corresponding Chandra source, assuming only detection errors. Note that the full width half maximum (FWHM) of the FUV PSF is , i.e. much smaller than the error circles for all Chandra sources (and in most cases smaller than the error circle, see Table LABEL:tab:chandra_sources). Therefore we adopted the larger Chandra error circles as the maximum matching radius.
| Ch. | FUV | NUV | FUV | Distance | Prob. | Prob. | ||||||
|---|---|---|---|---|---|---|---|---|---|---|---|---|
| ID | ID | [mag] | [flux] | / | [mag] | [flux] | / | [pixel] | [] | |||
| 4 | 400 | 19.7380.024 | 3.640.08 | 38 | 22.0420.118 | 0.550.06 | 253 | 20.43 | 0.505 | 1.74 | 32.65 | 60.53 |
| 4 | 392 | – | – | – | 21.7430.098 | 0.730.06 | 192 | 25.94 | 0.641 | 2.21 | 47.96 | |
| 7 | 222 | 20.8240.030 | 1.340.04 | 2168 | 20.9060.048 | 1.580.07 | 1839 | 0.00 | 0.000 | 0.00 | – | 5.26 |
| 8 | 111 | 17.4280.012 | 3.050.34 | 5 | 18.3740.015 | 16.230.22 | 8 | 31.25 | 0.772 | 2.42 | 40.82 | 50.00 |
| 9 | 476 | 19.5830.034 | 4.200.13 | 29 | 21.8810.161 | 0.640.10 | 187 | 31.94 | 0.789 | 2.47 | 53.06 | 73.68 |
| 9 | 457 | – | – | – | 21.6460.125 | 0.800.09 | 151 | 37.33 | 0.922 | 2.89 | 62.25 | |
| 10 | 182 | 18.3530.009 | 13.030.11 | 200 | 17.0390.008 | 55.510.41 | 47 | 6.07 | 0.150 | 2.17 | 5.10 | 2.63 |
| 11 | 252 | 17.0090.004 | 44.920.17 | 13 | 16.4000.006 | 100.000.55 | 6 | 16.14 | 0.399 | 2.57 | 6.12 | 18.42 |
| 12 | 492 | 18.2170.016 | 14.760.22 | 29 | 16.7830.019 | 70.271.22 | 6 | 17.91 | 0.443 | 2.47 | 20.41 | 34.21 |
| 14 | 446 | 24.1390.668 | 0.060.04 | 1425 | 22.9660.226 | 0.240.05 | 381 | 7.08 | 0.175 | 0.48 | 4.08 | 78.95 |
| Chandra ID | Optical ID | FUV ID | V | / | B | / | Distance | CMD | ||
|---|---|---|---|---|---|---|---|---|---|---|
| [mag] | [mag] | [pixel] | [] | |||||||
| 3 | 6881 | – | 18.445 | 224 | 18.600 | 56 | 2.521 | 0.116 | 0.74 | BS |
| 4 | 5315 | 400 | 17.947 | 22 | 18.122 | 6 | 10.949 | 0.504 | 1.72 | BS |
| 8 | 6805 | – | 15.481 | 2 | 15.491 | 1 | 16.890 | 0.777 | 2.41 | BHB |
| 8 | 13062 | – | 20.648 | 265 | 20.928 | 74 | 14.739 | 0.678 | 2.10 | MS |
| 8 | 7222 | – | 20.444 | 220 | 20.686 | 59 | 19.410 | 0.893 | 2.77 | MS |
| 9 | 3064 | 476 | 17.729 | 15 | 17.997 | 4 | 17.251 | 0.794 | 2.46 | BS |
| 11 | 2486 | 252 | 16.156 | 18 | 16.006 | 3 | 8.763 | 0.403 | 2.57 | BHB |
| 11 | 10872 | – | 21.260 | 1996 | 21.578 | 579 | 2.789 | 0.128 | 0.82 | MS |
| 11 | 2529 | – | 20.998 | 1568 | 21.308 | 452 | 3.593 | 0.165 | 1.06 | MS |
| 12 | 3165 | – | 18.543 | 117 | 18.563 | 25 | 9.697 | 0.446 | 2.47 | BS |
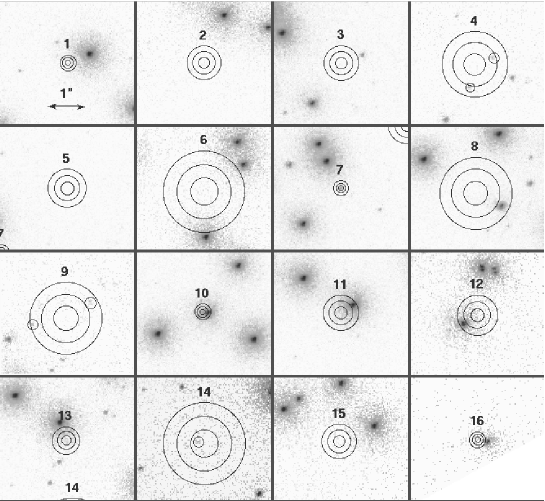
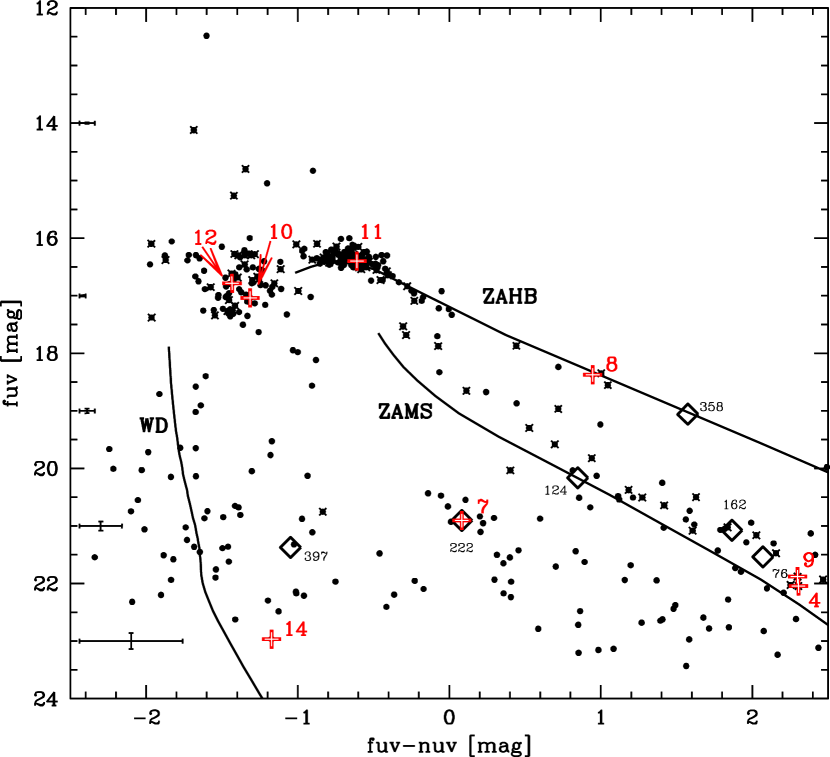
Fig. 6 shows close-ups on the FUV mosaic. In total, we found 10 possible FUV counterparts to 8 X-ray sources, which are listed in Table 5. Their location in the FUV–NUV CMD is indicated in Fig. 7. As can be seen from Fig. 6, the errors can be quite large for some Chandra sources. The probability of a false match between a Chandra and a FUV source correlates with the size of the Chandra error circle. In order to estimate the probability of such coincidental matches, we repeatedly shifted the set of Chandra sources by 90 STIS pixels or to the top and left and right. We only allowed for shifts that kept all Chandra sources within the FUV field of view, so that the statistics for all Chandra sources are the same. After each shift, we again checked for FUV counterparts to each Chandra source. The last two columns in Table 5 gives the probability that, just by chance, at least one FUV source can be found within the same distance as the FUV source that was found without a random shift, or within the three sigma error circle of that Chandra source.
We used a Monte-Carlo simulation to produce 1 000 fields with the detected number of UV and X-ray sources, and we deduced the number of matches expected by chance. Using , and error circles for the 16 Chandra sources, we found that , and matches may be spurious respectively. We thus expect matches to be real among the 10 UV counterparts. In addition to source 7, two other sources (10 and 14) have probabilities that imply that they may be associated with a FUV source (Table 5).
4.2 Optical counterparts
NGC 2808 was observed with the HST Wide Field Planetary Camera 2 (WFPC2) in the F439W and F555W bands, with the Planetary Camera (PC) centered on the cluster’s center. The field of view of the PC is . In order to check for possible optical counterparts to the 16 core X-ray sources, we used the optical catalogue presented by Piotto et al. (2002).
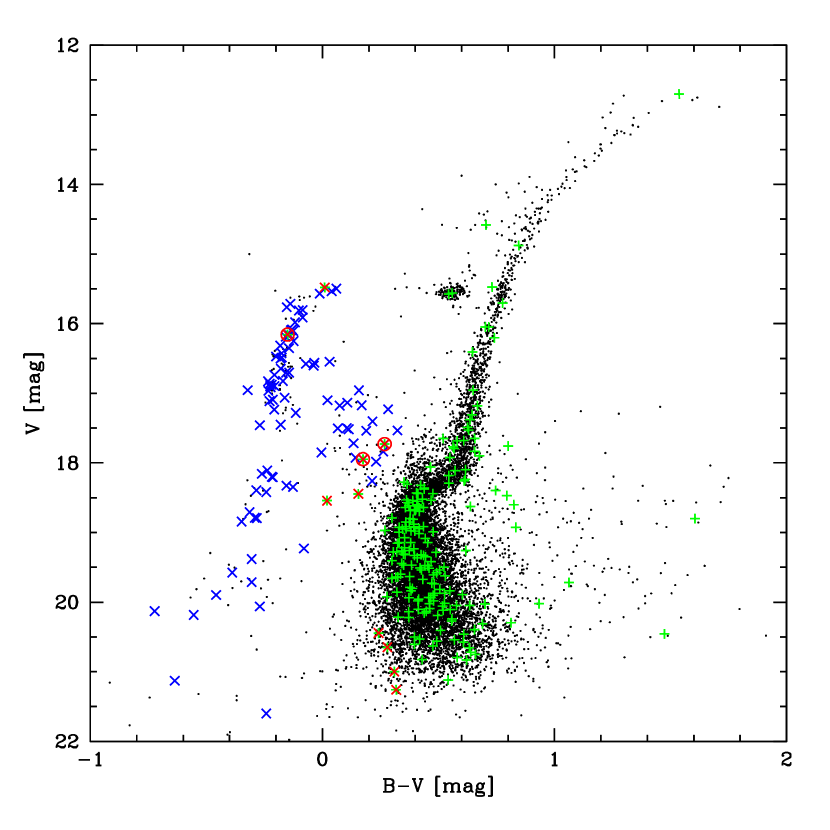
We searched for optical counterparts by transforming all the FUV coordinates, including the 16 shifted Chandra positions, to the PC cartesian system, using the geomap and geoxytran tasks running under IRAF555IRAF (Image Reduction and Analysis Facility) is distributed by the National Astronomy and Optical Observatory, which is operated by AURA, Inc., under cooperative agreement with the National Science Foundation. and the FUV–optical matches in the Dieball et al. (2005) catalogue as a database. We then looked for optical counterparts within a radius of the transformed Chandra errors. However, nearly all of these are either located on the MS, red giant branch or red HB. Two of the optical sources are on the BHB and four sources are in the optical BS region above the MS turn-off. There are four sources that are faint and blue with and mag. An optical counterpart to a CV is expected to be very blue. All the above mentioned optical sources are listed in Table 6 and a colour-magnitude diagram is presented in Fig. 8. Of these, four are optical counterparts to the FUV sources that might constitute possible matches to the Chandra sources, see Table 5.
4.3 Ultraviolet counterparts outside the core
NGC 2808 was observed with the XMM-Newton Optical Monitor (OM) using the UVM2 filter, centered at 231 nm in the UV band (Servillat et al. 2008). We reprocessed the data in the same way as Servillat et al. (2008), in order to use the latest version of the SAS (v7.1), and looked for UV counterparts to the Chandra sources. Because of the crowding of sources, we could not use this data inside the half-mass radius.
A bright source is seen in the field of view outside the crowded area of the core of NGC 2808, which is consistent with the star HD 79548 at RA2000 , Dec2000 64°51′03.28″. This star is an A0V star with magnitudes and , compatible with the UVM2 magnitude we found. We thus shifted the coordinates of the OM observation to match this source. After the shift, the number of possible matches significantly increased from 2 to 16. We used a Monte-Carlo simulation to deduce the number of matches expected by chance, and estimated that matches may be spurious (using error circles). This indicates that the nearly all of the matches are real. Moreover, a rotation of the field of view does not seem necessary.
We took into account the positional error of the Chandra sources, and the positional error of the UV sources. The 16 possible counterparts found outside the half-mass radius are listed in Table 7, nine of which are within the error circle. From the nine UV counterparts found for XMM-Newton sources (Servillat et al. 2008), eight are consistent with the Chandra sources. The XMM-Newton source 29 counterpart is ruled out as the corresponding Chandra source, 33, has a smaller error circle which does not match the proposed UV counterpart. Chandra source 36 has a UV counterpart and a matching XMM-Newton source, but the match between UV and XMM-Newton sources was not found (Servillat et al. 2008) because this UV source was not detected with the older version of the SAS. As they are found outside the half-mass radius of NGC 2808, these sources are likely to be background or foreground sources (see Sect. 5.7 and 5.8).
| ID | Distance | Offset | UVM2 | |
|---|---|---|---|---|
| 17 | 1.77″ | 2.17 | 0.89′ | 17.00 0.06 |
| 19 | 2.15″ | 2.64 | 1.30′ | 15.18 0.02 |
| 21 | 1.36″ | 1.71 | 1.95′ | 17.25 0.05 |
| 31∗ | 0.43″ | 0.54 | 3.19′ | 10.95 0.01 |
| 35 | 0.81″ | 0.94 | 3.36′ | 19.52 0.41 |
| 36∗ | 1.34″ | 1.52 | 3.53′ | 19.55 0.40 |
| 39∗ | 0.53″ | 0.66 | 3.77′ | 17.83 0.07 |
| 41∗ | 0.52″ | 0.65 | 3.86′ | 18.29 0.10 |
| 45 | 2.44″ | 2.83 | 4.02′ | 17.28 0.04 |
| 48∗ | 2.39″ | 2.85 | 4.10′ | 17.23 0.04 |
| 49 | 1.26″ | 1.23 | 4.14′ | 19.50 0.43 |
| 51∗ | 0.83″ | 0.96 | 4.29′ | 18.99 0.17 |
| 53∗ | 0.09″ | 0.12 | 4.42′ | 14.70 0.01 |
| 63 | 0.29″ | 0.33 | 5.15′ | 18.86 0.15 |
| 74∗ | 0.11″ | 0.13 | 5.82′ | 17.99 0.07 |
| 99∗ | 0.79″ | 0.96 | 8.53′ | 18.29 0.09 |
5 Discussion
In order to identify the X-ray sources linked to NGC 2808, we first discuss the properties of X-ray sources and their possible counterparts. The brightest sources with are likely to be qLMXBs if they are very soft and well fitted by hydrogen atmosphere model, with masses and radii consistent with a neutron star (Heinke et al. 2003b; Gendre et al. 2003b, a). They are likely to be CVs if they are harder, with keV (Baskill et al. 2005), or in this work a photon index less than 2. X-ray sources with lower luminosities are most likely either CVs, ABs or MSPs, although we note that there are also qLMXBs which have luminosities around (e.g. Heinke et al. 2005a). ABs and MSPs are in general expected to be soft (Dempsey et al. 1993; Bogdanov et al. 2006). The brightest AB observed in a GC reached (Heinke et al. 2005b). Their spectrum is generally well fitted by a two temperature model with mean K and K, and they have luminosities of (Dempsey et al. 1993). MSPs in GCs are well described by a thermal (blackbody or neutron star hydrogen atmosphere) spectrum with a temperature K, emission radius km, and luminosity (Bogdanov et al. 2006). Some of them show a significant or dominant non-thermal (power law) component, with spectral photon index , and are more luminous (Bogdanov et al. 2006). The brightest MSP observed in a GC reached (in M28, Becker et al. 2003).
In the UV, CVs are expected to be brighter than qLMXBs, ABs and MSPs, and are located between the MS and the WD cooling sequence in the CMD (e.g. Dieball et al. 2005). ABs, on the other hand, are expected to be redder than MS stars or on the MS (e.g. Edmonds et al. 2003a).
CVs can show high variability in X-rays on different timescales (e.g. Warner 1995). Large variations of a factor of 5–10, and timescales of hours to days are most commonly associated with dwarf nova outbursts (Baskill et al. 2005; Wheatley et al. 2003). However, such variation can also appear during the quiescent state of some CVs (Baskill et al. 2005). ABs show flaring activity. The decay time of a compact flare is ks, and for two-ribbon flares it reaches 5–20 ks (Poletto et al. 1988). The rise time is generally shorter than 2 ks (Poletto et al. 1988). Longer flares have been observed, with a noticeable decay (110 ks, Franciosini et al. 2001), and very exceptional flares can last several days (e.g. Kuerster & Schmitt 1996).
5.1 X-ray sources with a possible UV counterpart in the core
5.1.1 Chandra source 7: a CV
Chandra source 7 has X-ray colour and flux compatible with CV emission (see Table LABEL:tab:chandra_sources). Furthermore, its UV counterpart is located in the gap region between the MS and the WD cooling sequence in the FUV–NUV CMD (see Fig. 7). The X-ray/UV ratios are high for this source (see Table 5), similar to those observed for intermediate polars (see Sect. 5.5).
5.1.2 Chandra source 14: a possible CV
Chandra source 14 is fainter, with X-ray colour and flux compatible with CV, AB or MSP emission. Its possible UV counterpart is located in the CV region and the X-ray/UV ratios are compatible with the emission of CVs (see Sect. 5.5). The probability of finding by chance a FUV source within a error circle is high (%). However, the probability of finding a FUV source just by chance within a error circle of Chandra source 14 is 4% (see Table 5), therefore it seems likely that FUV source 446 is the true counterpart, making Chandra source 14 a good CV candidate. From simulations, the probability of having a FUV source which is also one of the CV candidates is 0.5% .
5.1.3 Chandra source 10: another CV?
Chandra source 10 has very similar X-ray parameters to Chandra source 7, a priori suggesting that this source also constitutes a CV (Fig. 2). Its possible UV counterpart is bright in FUV and NUV, and it is located in the faint part of the EHB region in the FUV–NUV CMD. Although field CVs in outburst can be as bright as this source in FUV (see Fig. 3 in Dieball et al. 2005), in this case the source would have to be in outburst for days, or during each FUV observation (2000 January 18 and 19, and February 16 and 20, Dieball et al. 2005), which is unlikely as CV outbursts are expected to be rare in GCs (Shara et al. 1996). It is also possible that its true UV counterpart is masked by the bright, close UV source.
5.1.4 Chandra source 11
The flux and colour of Chandra source 11 are consistent with a CV or an AB candidate. It possibly matches with a bright UV source, located in the BHB clump in the FUV–NUV CMD, and an optical source which also suggests that this source is a BHB star (Table 5). X-ray emission is not expected from such HB stars, and this source could constitute another kind of exotic binary. The matching distance between the X-ray and FUV coordinates is . It is possible that the UV source is simply a mismatch. One of the optical counterparts (#10872, Table 6) is blue, as expected for a CV.
5.1.5 Chandra source 12
Chandra source 12 has a similar flux and colour to Chandra source 11, consistent with the CV or AB hypothesis. Its luminosity also possibly varied between XMM-Newton and Chandra observations (). The possible UV counterpart is located in the EHB clump in the FUV–NUV CMD. However, the match to this FUV source is within , with a probability of that this match is a chance superposition. This might well be a mismatch and the true FUV counterpart was not detected in our FUV images. One of the possible optical counterparts is in the BS region (see Table 6 and Fig. 8).
5.1.6 Chandra source 8
Chandra source 8 can be either a CV, an AB, or a MSP candidates. It possibly matches with a bright FUV source, located on the HB sequence in the FUV–NUV CMD. This source is thus not expected to reach such a luminosity in X-rays and it could be a mismatch. We found two possible optical counterparts compatible with the expected emission of a CV (see Table 6 and Fig. 8).
5.1.7 Chandra sources 4 and 9
Chandra sources 4 and 9 are fainter X-ray sources, giving weak constraints about their nature. They are either CV, AB, or MSP candidates. Both Chandra sources 4 and 9 have two possible FUV counterparts. Of these, FUV sources 400 and 476 seem to be the likely counterparts to Chandra source 4 and 9, respectively, as they are closer (Table 5). These FUV sources are located at the faint end of the BS sequence. The discrimination between BS and CV candidates is difficult, and both populations might well overlap in the FUV–NUV CMD. Thus, it is possible that X-ray sources 4 and 9 are CVs, or they might be X-ray emitting BSs. Such an object was found in 47 Tuc by Knigge et al. (2006). They suggested that this exotic object is a detached binary consisting of a BS primary with an X-ray-active MS companion whose formation would involve at least three stars. Edmonds et al. (2003a) and Heinke et al. (2005b) also identified such objects in 47 Tuc. The coincidence probability of these sources is high (Table 5) and they could be mismatches.
5.2 X-ray sources without a UV counterpart in the core
5.2.1 Chandra source 1: a qLMXB candidate
Chandra source 1 corresponds to XMM-Newton source C2, which was presented as a qLMXB candidate by Servillat et al. (2008). The Chandra flux and colour of this source also support the idea that it is a qLMXB. Moreover, the spectrum of Chandra source 1 is well fitted with a hydrogen atmosphere model with parameters consistent with a neutron star. No hard tail is detected in the spectrum, as in general in GC qLMXBs (Heinke et al. 2003c). The upper limit is (% of the total flux), assuming a power law model with photon index 1–1.5 (Campana et al. 1998), and 1 photon detected in the band 2–8 keV. Servillat et al. (2008) estimated that qLMXBs are expected in the core of NGC 2808, using the empirical correlation between the number of qLMXBs and the star encounter rate. We found no evidence in our Chandra observation for other qLMXB candidates.
5.2.2 Chandra source 16: a variable CV
Chandra source 16 is a variable X-ray source. This variability is observed on different time scales: during the first Chandra observation (few hours), between the two Chandra observations (1 day), and between XMM-Newton and Chandra observations (28 months). Its flux, colour and variability in X-rays suggest it could be a CV, possibly showing the signature of a CV outburst in X-rays (e.g. Baskill et al. 2005). An AB interpretation is less probable as even in long flares, the decay of the flare would be detectable over the first 45 ks of Chandra observation (as in Franciosini et al. 2001, for a 110 ks flare).
5.2.3 Chandra source 3: possible CV
Chandra source 3 is very hard and shows short-term variability. The lightcurve indicates a count increase by a factor between the beginning of the first Chandra observation and the second Chandra observation (Fig. 3). The rise time is longer than 10 ks (end of first Chandra observation, Fig. 3), exceptional for an AB flare (e.g. Poletto et al. 1988). This kind of fluctuation would be more typical of a CV, and it is possibly the signature of a CV outburst in X-rays (e.g. Baskill et al. 2005). We note that a possible optical counterpart falls in the BS region in Fig. 8, however it could be a mismatch.
5.2.4 XMM-Newton source C5
XMM-Newton source C5, which was not detected during our Chandra observation, was hard, and is variable over 28 months. The flux varied by a factor of at least 5 over this period. From its flux and colour, it could be a variable CV or an AB which showed a flare. No variability was detected from this source during the XMM-Newton observation of ks with the pn detector (Servillat et al. 2008). Such a long flare would be exceptional for an AB, although it cannot be excluded (e.g. Kuerster & Schmitt 1996). CVs routinely show fluctuations in X-rays, some of them being associated with CV outbursts (e.g. Baskill et al. 2005).
5.2.5 Chandra source 17
We note that Chandra source 17, which is close to the half-mass radius of NGC 2808, has colours and fluxes consistent with those of a CV, an AB or a MSP. It shows variability that is possibly consistent with a CV fluctuation or an AB flare, as it lasted ks (Fig. 3). This source could therefore be linked to the cluster, and could be a CV or an AB. If it is a CV, its offset from the core would make it a primordial CV candidate (Hurley et al. 2007).
5.2.6 Other Chandra core sources
From their luminosities and colours, Chandra sources 2, 5, 13, 15 are consistent with the CV or AB hypothesis. Similar X-ray sources are identified as CVs or ABs by Heinke et al. (2005b) in 47 Tuc. However, we did not find FUV counterparts, nor detected variability, and we cannot confirm their nature. Chandra source 6 is fainter, and is consistent with being a CV, an AB, or even a bright MSP candidate.
5.3 Variable sources in the core
Several authors have claimed that there is a lack of CV outbursts in GCs (e.g. Shara et al. 1996; Edmonds et al. 2003b; Dobrotka et al. 2006). To explain this deficit, it was proposed that most GC CVs are moderately magnetic with low accretion rates, systems for which very few outbursts are expected (Grindlay 1999; Ivanova et al. 2006; Dobrotka et al. 2006).
Shara et al. (1996) looked for dwarf nova outbursts in 47 Tuc using HST observations for a cumulative time of ks. They found only one outburst and showed that they should have detected at least 12 from simulations, implying a lack of outbursts from GC CVs. Outbursts of GC CVs have also been observed in UV for two magnetic CVs in NGC 6397 (Shara et al. 2005). The cumulative time of their observation was ks. Our X-ray observations lasted (XMM-Newton and Chandra), and could therefore lead to the detection of dwarf nova outburst signatures.
An optical outburst of a dwarf nova can be linked to an increase of X-ray emission (factor ), followed by a drop (factor ) due to the variation of thickness of the boundary layer at different accretion rates (Wheatley et al. 2003; Warner 1995). However, X-ray fluctuations of CVs are also detected during the quiescent state (Baskill et al. 2005).
Our observation indicates that some sources in the core show such fluctuations in X-rays. Chandra sources 3, 16 and XMM-Newton source C5 are likely to be CVs that possibly showed signatures of outbursts in X-rays. Simultaneous X-ray and UV (or optical) observations should be performed for several GCs to confirm these possible dwarf nova outbursts and assess the rate of outbursts in GCs.
5.4 Expected X-ray sources linked to NGC 2808
Assuming a completeness in the detection of sources at a luminosity of , we can estimate the number of expected X-ray sources in NGC 2808.
To estimate the number of expected X-ray sources in NGC 2808, we use a general approach based on the correlations given by Pooley & Hut (2006), where they used the results of observations of 22 GCs with Chandra. Taking into account the specific encounter frequency of NGC 2808, as defined in Pooley & Hut (2006), and our completeness limit, we expect X-ray sources in NGC 2808. The error is extrapolated from the error in Pooley & Hut (2006). Of these sources, qLMXBs are expected, and CVs with a luminosity greater than (corresponding to populations I and II respectively, as defined in Pooley & Hut 2006). However, we detected only 11 sources in the half-mass radius of NGC 2808 and above the completeness limit.
Looking only at CVs, we can compare our results to the population synthesis simulation performed by Ivanova et al. (2006). They estimated the number of CVs and detectable CVs expected in a GC similar to NGC 2808 (their standard model): same core density, relaxation time and metallicity, but velocity dispersion and escape velocity somewhat lower in their model. Their simulation lead to 209 CVs formed after 10 Gyr, of which 47 have a luminosity higher than . The number of detectable CVs seems stable over an interval of ages of 7–14 Gyr with a standard deviation of . We can adapt this result to our completeness limit by applying a factor (obtained from the number of sources detected in 47 Tuc with the corresponding limiting luminosities in Heinke et al. 2005b). This leads to detectable CVs predicted for our observation. We detected 8 (and possibly up to 15) CV candidates, which seems less than the predicted number of CVs from simulations. In the same way, Knigge et al. (2008) found that there are only a few CVs among the bright FUV sources located between the MS and WD cooling sequence in 47 Tuc, indicating a possible deficit of CVs compared to what is expected. If this is true, our understanding of CV formation and evolution in GCs might have to be revised.
We compared our results to the observation of 47 Tuc (Heinke et al. 2005b). 47 Tuc is similar in mass, density and concentration to NGC 2808 (Harris 1996). The specific encounter frequency of NGC 2808 is comparable to that of 47 Tuc. NGC 2808 has an intermediate metallicity ( corresponding to , Yi et al. 2001, Table 2), while 47 Tuc has a higher metallicity (, or ). About X-ray sources above our completeness limit (the error corresponds to the error on the luminosity in Heinke et al. 2005b) were detected in the half-mass radius of 47 Tuc, of which: 2–5 qLMXBs, 16–19 CVs, 4–5 ABs, and 1 MSP.
M80, has been observed with Chandra (Heinke et al. 2003a). Its metallicity is lower (, or ), and its mass, density and concentration are close to NGC 2808 values (Harris 1996). A total of sources were detected above a similar luminosity threshold to our observation, of which 2 are qLMXB candidates, and 5 possible CVs. This is similar to our number of detections in NGC 2808.
The possible deficit of X-ray sources could therefore be linked to specific parameters of NGC 2808. Metallicity seems to be a key parameter that could highly affect the number of X-ray sources in GCs at a given age. Due to the lower opacity, metal poor stars are generally hotter and more compact. This could lead to the formation of WDs with different properties, and will also determine if, when and how mass transfer occurs in binaries (de Mink et al. 2007). NGC 2808, 47 Tuc and M80 have very different metallicities, which could explain the differences in the number of detectable X-ray sources. In the same way, Kundu et al. (2007) found that metal-rich extragalactic GCs host three times as many LMXBs than metal-poor ones.
NGC 2808 presents unusual features in the optical: an extended BHB with clumps (Bedin et al. 2000), several MS corresponding to different star populations (Piotto et al. 2007), and abundances anomalies in HB stars (Pace et al. 2006). All these particular features are linked in some way to the metallicity of the stars. Piotto et al. (2007) proposed that several populations of stars were formed successively, increasing the helium and metal content of the cluster material at each round. The possible deficit of X-ray sources we observed is possibly linked to this specific evolution of NGC 2808 which modified its metallicity content.
5.5 X-ray and UV emission from CVs
Knigge et al. (2008) showed that no more than half of the objects lying in the CV region in the FUV-NUV diagram of 47 Tuc are confirmed as CVs. If the types of object in the gap in NGC 2808 have similar proportions as in 47 Tuc, then we expect that of the CV candidates detected (Dieball et al. 2005) will ultimately turn out to be CVs. With Chandra, we obtained at most 15 CV candidates. If we take into account only significant matches, we found two UV counterparts that have UV properties clearly compatible with the CV hypothesis (Chandra sources 7 and 14).
Even if we take into account the incompleteness of our observations, it seems that X-ray and UV emission from CVs are decorrelated, as the brightest X-ray sources in NGC 2808 are generally not the brightest FUV sources. The four CVs confirmed in FUV by Knigge et al. (2002) in 47 Tuc also have very different X-ray to FUV ratios, strengthening this idea. For instance, AKO 9 is brighter than V1 in FUV (magnitudes and respectively, Knigge et al. 2002), but fainter in X-rays ( and respectively, Heinke et al. 2005b).
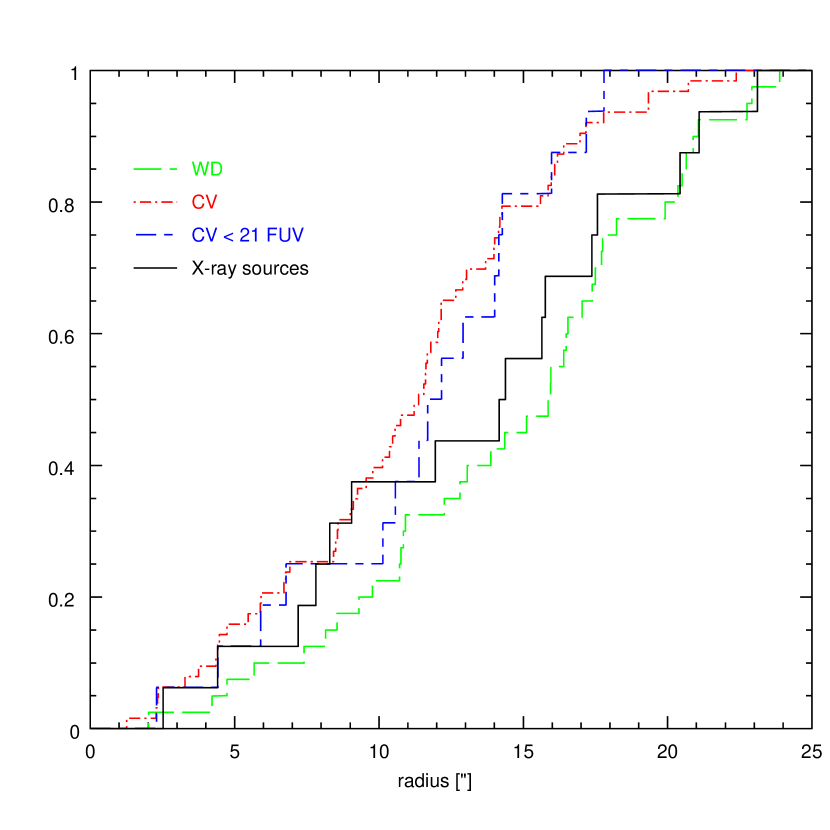
The cumulative radial profiles of the X-ray population and the FUV CV candidates are shown in Fig. 9. The spatial distributions do not appear to be significantly different with a KS test. As there is a mass segregation effect in the cluster, this would indicate that the mean mass of the systems is not a dominant parameter to explain the different properties of these populations.
UV and X-ray photons come from different processes. The UV emission is mainly due to the accretion disk (non-magnetic CVs, Godon et al. 2008), accretion curtains (intermediate polars) or accretion streams (polars), and possibly the hot spot. In systems with low accretion rates or in magnetic CVs, the WD also contributes to the UV emission (Mateo & Szkody 1984). On the other hand, the X-ray emission arises from close to the surface of the WD (Wheatley & West 2003), produced by the boundary layer (Pringle 1977; Patterson & Raymond 1985) or the shock above the WD magnetic pole.
Therefore long period non-magnetic nova-like CVs (large accretion disk with high accretion rate) tend to be relatively X-ray faint and UV bright. Non-magnetic systems should generally be bright in UV due to their dominant accretion disc. ROSAT observations of field CVs in X-ray and optical strengthen this idea (Verbunt et al. 1997). Contrary to this, magnetic CVs seem to be more luminous in X-rays than in UV (e.g. Verbunt et al. 1997; Edmonds et al. 2003b). Part of the UV emission is expected to be suppressed in these systems due to the truncation of the inner portion of the accretion disc of intermediate polars (Grindlay 1999). This is also observed for polars which have no accretion disks (e.g. Warner 1995).
FUV source 397 is variable in FUV, as is FUV source 222, and is a CV candidate. However, no counterpart is detected in X-ray, contrary to FUV source 222 which matches with Chandra source 7. These CV candidates could therefore be in separate CV classes. FUV source 397 is likely to possess a UV-bright accretion disk as expected for non-magnetic systems. Chandra source 7 is brighter in X-ray as expected for magnetic systems, and variable and bright in UV due to the probable presence of an accretion disk. It is therefore likely to be an intermediate polar.
We estimated a / ratio for several CVs belonging to different classes, as estimated in Table 5, where is the flux density between 2500–3000 Å, and the flux in the band 0.5–8 keV. Polars have ratios greater than 5000 (ratios extrapolated from Ramsay & Cropper 2003; Ramsay et al. 2004; Vogel et al. 2008). Intermediate polars appear to have a ratio greater than 2000 (Haberl et al. 2002; de Martino et al. 2005, 2006). The detection limit of the NUV observation is , and the limit in X-rays is . Therefore, the X-ray/NUV ratio for the CV candidates detected in UV is lower than . The CV candidates detected in UV and not in X-rays are thus likely to be mostly non-magnetic systems (such as the dwarf nova YZ Cnc with a ratio of , Hakala et al. 2004). Most intermediate polars in the field are more luminous than in X-rays (Verbunt et al. 1997, see also the Intermediate Polar Home Page666http://asd.gsfc.nasa.gov/Koji.Mukai/iphome/iphome.html maintained by K. Mukai, where 12 out of 14 have luminosities above this limit). We should have detected most of these in our Chandra observation if their emission is similar to intermediate polars in the field. This would lead to a maximum of intermediate polars (we exclude Chandra source 14 whose X-ray/NUV ratio is lower than 2000, and Chandra source 1 which is a qLMXB candidate). The proportion derived is of the detected CV candidates, and of the expected GC CV population, estimated to be CVs (Ivanova et al. 2006, see also §5.4). This is coherent with the proportion of intermediate polar candidates in the field, which can be estimated to from the catalogue of Ritter & Kolb (2003, updated Feb. 2008). Due to the incompleteness of our observations, this result does not allow us to confirm or rule out a possible excess of intermediate polars in NGC 2808. However, with a deeper sample, this method could allow us to better quantify the proportion of intermediate polars.
5.6 Constraint on the mass of an intermediate mass black-hole in NGC 2808
Following Servillat et al. (2008), we can constrain the possible mass of an intermediate mass black-hole (IMBH) in NGC 2808. No sources are detected at the center of mass of NGC 2808, where such a massive object is expected to be found. We assumed that the BH is fed by intracluster gas with a density of derived from Pfahl & Rappaport (2001) with NGC~2808 parameters. We considered that the IMBH is radiatively inefficient as for an optically thin advection-dominated accretion flow (ADAF, see e.g. Narayan et al. 1998). Following Grindlay et al. (2001), our limiting luminosity implies an upper limit of for a central IMBH in NGC~2808. Maccarone & Servillat (2008) used ATCA radio observations to put a mass limit on an IMBH in NGC 2808 (370 M☉). They cast doubt on suggestions that globular clusters may follow the same relation as galaxies.
5.7 Foreground sources
5.7.1 Chandra source 31
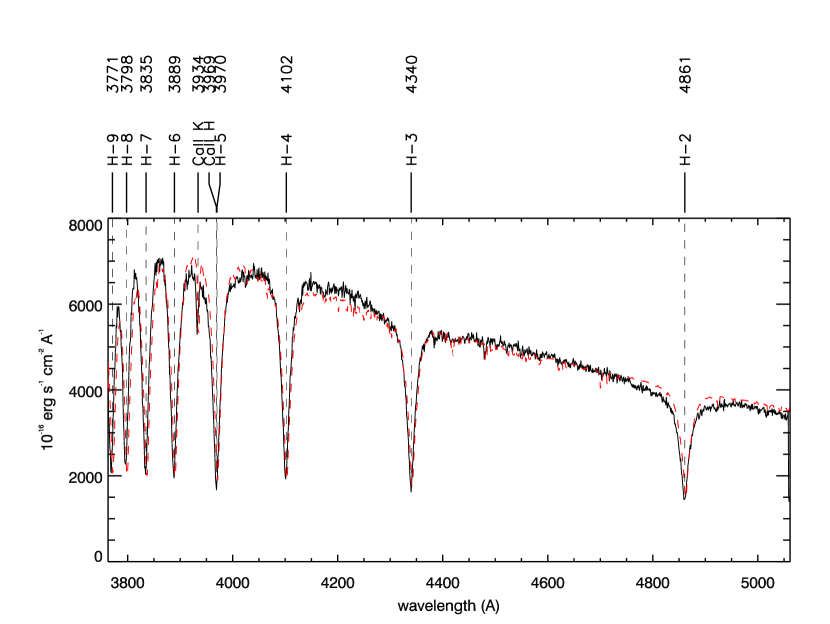
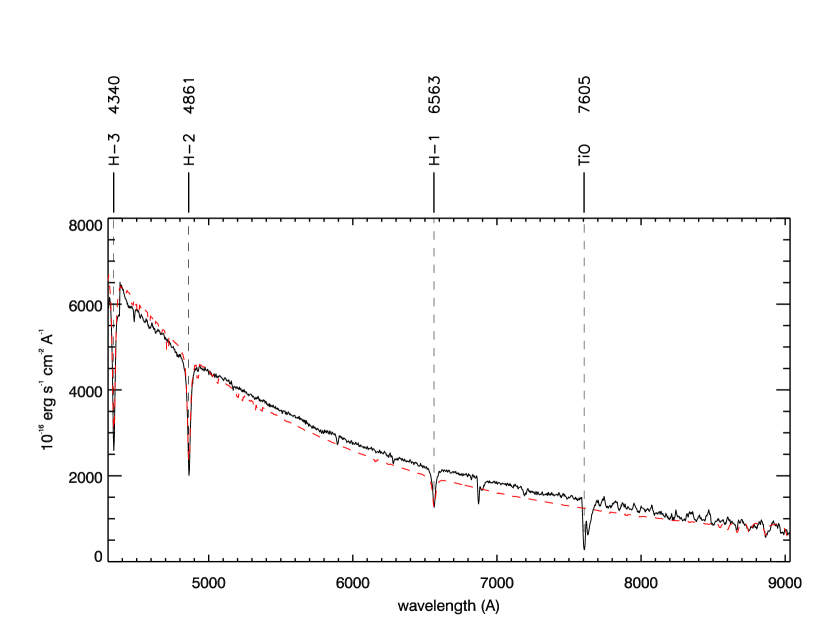
Chandra source 31 has a bright UV and optical counterpart compatible with the A0V star HD 79548. The distance estimate of pc to this source (Servillat et al. 2008) leads to an X-ray luminosity of . The X-ray emission is soft and showed some variation since the XMM-Newton observation.The luminosity is in agreement with the observed luminosity of X-ray bright A-type stars (Schröder & Schmitt 2007). However, the source of the emission may come from a late-type active star companion, as the majority of A-type stars are expected to be particularly X-ray dark (Schröder & Schmitt 2007). Using VLT/FORS1 spectra (see Fig. 10), we note that a contribution from a late-type star is possible, and difficult to detect as its flux could be at least 100 times lower than the A-star. The 12 radial velocity measurements of the H line do not show evidence for a period, so we cannot confirm the presence of a companion.
5.7.2 Chandra source 113
Chandra source 113 showed a flare in its X-ray lightcurve (Fig. 3), which reached at least three times the mean flux of the source. The decay timescale was ks. The photon index of the spectrum indicates a soft source (2.29, Table LABEL:tab:chandra_sources). These characteristics are in agreement with those of a chromospherically active star (Briggs & Pye 2003).
5.8 Background sources
5.8.1 Sources with radio counterparts
NGC 2808 was observed with the Australia Telescope Compact Array (ATCA) on 24 January 1992. The data processing is described in Maccarone & Servillat (2008). Chandra source 73 has a radio counterpart. It is the most luminous X-ray source of the field, its X-ray emission is hard and absorbed, and it showed a colour variation between XMM-Newton and Chandra observations. Chandra sources 50 and 89 also have a radio counterpart, and possibly Chandra source 107 and XMM-Newton source 8 (outside the field of view of Chandra). All these sources are hard and absorbed in X-ray (Table LABEL:tab:chandra_sources), as expected for AGN (Mainieri et al. 2007).
5.8.2 Chandra source 99
This source varied in luminosity between the XMM-Newton and Chandra observations. It has been proposed to be a background AGN based on its hard, absorbed X-ray spectrum (Servillat et al. 2008). The Chandra observation is consistent with this hypothesis, as is the UV emission detected with the XMM-Newton OM. We detect an infrared counterpart in the Spitzer data found in the archives777http://ssc.spitzer.caltech.edu/archanaly/archive.html (AOR 11586048), which is not compatible with the black body emission of a star. These properties are consistent with the emission of a galaxy, possibly an ultraluminous infrared galaxy (Lonsdale et al. 2006; Braito et al. 2004).
6 Conclusions
We presented Chandra observations of NGC 2808 coupled with previous XMM-Newton observations (Servillat et al. 2008), HST FUV observations (Dieball et al. 2005), VLT and ATCA observations. We have shown that 16 Chandra sources are likely to be linked to the cluster, with possibly a 17th close to the half mass radius. One of these is consistent with the X-ray emission of a qLMXB, confirming the previous detection with XMM-Newton. Two Chandra sources (7 and 14) have FUV counterparts that show emission compatible with a CV. Chandra source 10 is likely to be a CV from its X-ray emission, but no UV counterparts was found to confirm its nature. Another highly variable source (16) in the core is likely to be a CV, as well as two other variable sources (Chandra 3 and XMM-Newton C5). Two other Chandra sources (8 and 11) have optical counterparts compatible with the expected emission of CVs. We have thus identified 7 CV candidates (plus XMM-Newton source C5) and the observations indicate that there may be as many as 15 in the Chandra observations (although some of the faintest may be ABs or MSPs), along with CV candidates in the HST UV observations. This significant population of close binaries is likely to play an important role in slowing down the core collapse of this cluster. Compared to the number of X-ray sources detected in 47 Tuc and expected from dynamical formation, we found a possible deficit of X-ray sources in NGC 2808. This might indicate a true deficit of CVs, which is possibly linked to the metallicity content and the complexity of the evolution of NGC 2808.
Acknowledgements.
This paper has strongly benefitted from the careful review by the referee, C. Heinke, for which we are very grateful. MS is grateful to the University of Southampton and the Astronomy group for hosting him for two months, where part of this work was done. MS thanks T. J. Maccarone for interesting discussions and for the processing of ATCA data which improved the content of this article. This research has made use of data obtained from the Chandra Data Archive and software provided by the Chandra X-ray Center. This work is also based on observations obtained with XMM-Newton, an ESA science mission with instruments and contributions directly funded by ESA Member States and NASA. We thank the CNES for support of the operational phase of this mission. Part of this work is based on: FORS1 observations collected with the Very Large Telescope at the European Southern Observatory, Cerro Paranal, Chile; observations with the Australia Telescope Compact Array, founded by the Commonwealth of Australia for operation as a National Facility managed by the CSIRO; and observations made with the Spitzer Space Telescope, which is operated by the Jet Propulsion Laboratory, California Institute of Technology under a contract with NASA.References
- Albrow et al. (2001) Albrow, M. D., Gilliland, R. L., Brown, T. M., et al. 2001, ApJ, 559, 1060
- Arnaud (1996) Arnaud, K. A. 1996, in ASP Conf. Ser. 101: Astronomical Data Analysis Software and Systems V, ed. G. H. Jacoby & J. Barnes, 17
- Baskill et al. (2005) Baskill, D. S., Wheatley, P. J., & Osborne, J. P. 2005, MNRAS, 357, 626
- Becker et al. (2003) Becker, W., Swartz, D. A., Pavlov, G. G., et al. 2003, ApJ, 594, 798
- Bedin et al. (2000) Bedin, L. R., Piotto, G., Zoccali, M., et al. 2000, A&A, 363, 159
- Bogdanov et al. (2006) Bogdanov, S., Grindlay, J. E., Heinke, C. O., et al. 2006, ApJ, 646, 1104
- Braito et al. (2004) Braito, V., Della Ceca, R., Piconcelli, E., et al. 2004, A&A, 420, 79
- Briggs & Pye (2003) Briggs, K. R. & Pye, J. P. 2003, MNRAS, 345, 714
- Broos et al. (2002) Broos, P., Townsley, L., Getman, K., & Bauer, F. 2002, ACIS Extract, An ACIS Point Source Extraction Package, Pennsylvania State University, http://www.astro.psu.edu/xray/docs/TARA/ae_users_guide.html
- Brown et al. (2001) Brown, T. M., Sweigart, A. V., Lanz, T., Landsman, W. B., & Hubeny, I. 2001, ApJ, 562, 368
- Campana et al. (1998) Campana, S., Colpi, M., Mereghetti, S., Stella, L., & Tavani, M. 1998, A&A Rev., 8, 279
- Carretta et al. (2006) Carretta, E., Bragaglia, A., Gratton, R. G., et al. 2006, A&A, 450, 523
- Carretta et al. (2000) Carretta, E., Gratton, R. G., Clementini, G., & Fusi Pecci, F. 2000, ApJ, 533, 215
- Davies (1997) Davies, M. B. 1997, MNRAS, 288, 117
- de Martino et al. (2006) de Martino, D., Matt, G., Mukai, K., et al. 2006, A&A, 454, 287
- de Martino et al. (2005) de Martino, D., Matt, G., Mukai, K., et al. 2005, A&A, 437, 935
- de Mink et al. (2007) de Mink, S. E., Pols, O. R., & Yoon, S. . 2007, ArXiv e-prints, 710
- Dempsey et al. (1993) Dempsey, R. C., Linsky, J. L., Schmitt, J. H. M. M., & Fleming, T. A. 1993, ApJ, 413, 333
- Dieball et al. (2005) Dieball, A., Knigge, C., Zurek, D. R., Shara, M. M., & Long, K. S. 2005, ApJ, 625, 156
- Dobrotka et al. (2006) Dobrotka, A., Lasota, J.-P., & Menou, K. 2006, ApJ, 640, 288
- Edmonds et al. (2003a) Edmonds, P. D., Gilliland, R. L., Heinke, C. O., & Grindlay, J. E. 2003a, ApJ, 596, 1177
- Edmonds et al. (2003b) Edmonds, P. D., Gilliland, R. L., Heinke, C. O., & Grindlay, J. E. 2003b, ApJ, 596, 1197
- Elson et al. (1987) Elson, R., Hut, P., & Inagaki, S. 1987, ARA&A, 25, 565
- Fabian et al. (1975) Fabian, A. C., Pringle, J. E., & Rees, M. J. 1975, MNRAS, 172, 15P
- Franciosini et al. (2001) Franciosini, E., Pallavicini, R., & Tagliaferri, G. 2001, A&A, 375, 196
- Fruscione et al. (2006) Fruscione, A., McDowell, J. C., Allen, G. E., et al. 2006, in SPIE Conference, Vol. 6270, Observatory Operations: Strategies, Processes, and Systems. Edited by Silva, David R.; Doxsey, Rodger E.
- Gendre et al. (2003a) Gendre, B., Barret, D., & Webb, N. A. 2003a, A&A, 403, L11
- Gendre et al. (2003b) Gendre, B., Barret, D., & Webb, N. A. 2003b, A&A, 400, 521
- Giacconi et al. (2001) Giacconi, R., Rosati, P., Tozzi, P., et al. 2001, ApJ, 551, 624
- Godon et al. (2008) Godon, P., Sion, E. M., Barrett, P. E., et al. 2008, ApJ, 679, 1447
- Grindlay (1999) Grindlay, J. E. 1999, in Astronomical Society of the Pacific Conference Series, Vol. 157, Annapolis Workshop on Magnetic Cataclysmic Variables, ed. C. Hellier & K. Mukai, 377
- Grindlay et al. (2001) Grindlay, J. E., Heinke, C., Edmonds, P. D., & Murray, S. S. 2001, Science, 292, 2290
- Haberl et al. (2002) Haberl, F., Motch, C., & Zickgraf, F.-J. 2002, A&A, 387, 201
- Hakala et al. (2004) Hakala, P., Ramsay, G., Wheatley, P., Harlaftis, E. T., & Papadimitriou, C. 2004, A&A, 420, 273
- Harris (1974) Harris, W. E. 1974, ApJ, 192, L161
- Harris (1996) Harris, W. E. 1996, AJ, 112, 1487
- Hasinger et al. (2001) Hasinger, G., Altieri, B., Arnaud, M., et al. 2001, A&A, 365, L45
- Hasinger et al. (2005) Hasinger, G., Miyaji, T., & Schmidt, M. 2005, A&A, 441, 417
- Heinke et al. (2005a) Heinke, C. O., Grindlay, J. E., & Edmonds, P. D. 2005a, ApJ, 622, 556
- Heinke et al. (2005b) Heinke, C. O., Grindlay, J. E., Edmonds, P. D., et al. 2005b, ApJ, 625, 796
- Heinke et al. (2003a) Heinke, C. O., Grindlay, J. E., Edmonds, P. D., et al. 2003a, ApJ, 598, 516
- Heinke et al. (2003b) Heinke, C. O., Grindlay, J. E., Lloyd, D. A., & Edmonds, P. D. 2003b, ApJ, 588, 452
- Heinke et al. (2003c) Heinke, C. O., Grindlay, J. E., Lugger, P. M., et al. 2003c, ApJ, 598, 501
- Heinke et al. (2006) Heinke, C. O., Wijnands, R., Cohn, H. N., et al. 2006, ApJ, 651, 1098
- Hurley et al. (2007) Hurley, J. R., Aarseth, S. J., & Shara, M. M. 2007, ApJ, 665, 707
- Hut et al. (1992) Hut, P., McMillan, S., Goodman, J., et al. 1992, PASP, 104, 981
- Hut et al. (2003) Hut, P., Shara, M. M., Aarseth, S. J., et al. 2003, New Astronomy, 8, 337
- Ivanova et al. (2006) Ivanova, N., Heinke, C. O., Rasio, F. A., et al. 2006, MNRAS, 372, 1043
- Knigge et al. (2008) Knigge, C., Dieball, A., Maiz Apellaniz, J., et al. 2008, ApJ, in press/ArXiv:0805.0140
- Knigge et al. (2006) Knigge, C., Gilliland, R. L., Dieball, A., et al. 2006, ApJ, 641, 281
- Knigge et al. (2002) Knigge, C., Zurek, D. R., Shara, M. M., & Long, K. S. 2002, apj, 579, 752
- Knigge et al. (2003) Knigge, C., Zurek, D. R., Shara, M. M., Long, K. S., & Gilliland, R. L. 2003, ApJ, 599, 1320
- Kuerster & Schmitt (1996) Kuerster, M. & Schmitt, J. H. M. M. 1996, A&A, 311, 211
- Kundu et al. (2007) Kundu, A., Maccarone, T. J., & Zepf, S. E. 2007, ApJ, 662, 525
- Kurucz (1993) Kurucz, R. L. 1993, VizieR Online Data Catalog, 6039, 0
- Lewin & Joss (1983) Lewin, W. H. G. & Joss, P. C. 1983, in Accretion-Driven Stellar X-ray Sources, ed. W. H. G. Lewin & E. P. J. van den Heuvel, 41
- Lonsdale et al. (2006) Lonsdale, C. J., Farrah, D., & Smith, H. E. 2006, Ultraluminous Infrared Galaxies (Astrophysics Update 2), 285
- Maccarone & Servillat (2008) Maccarone, T. J. & Servillat, M. 2008, mnras, 843
- Mainieri et al. (2007) Mainieri, V., Hasinger, G., Cappelluti, N., et al. 2007, ApJS, 172, 368
- Mateo & Szkody (1984) Mateo, M. & Szkody, P. 1984, AJ, 89, 863
- Miocchi (2007) Miocchi, P. 2007, mnras, 381, 103
- Mukai (1993) Mukai, K. 1993, Legacy, vol. 3, p.21-31, 3, 21
- Narayan et al. (1998) Narayan, R., Mahadevan, R., & Quataert, E. 1998, in Theory of Black Hole Accretion Disks, ed. M. A. Abramowicz, G. Bjornsson, & J. E. Pringle, 148
- Pace et al. (2006) Pace, G., Recio-Blanco, A., Piotto, G., & Momany, Y. 2006, A&A, 452, 493
- Patterson & Raymond (1985) Patterson, J. & Raymond, J. C. 1985, apj, 292, 535
- Pfahl & Rappaport (2001) Pfahl, E. & Rappaport, S. 2001, ApJ, 550, 172
- Piotto et al. (2007) Piotto, G., Bedin, L. R., Anderson, J., et al. 2007, ApJ, 661, L53
- Piotto et al. (2002) Piotto, G., King, I. R., Djorgovski, S. G., et al. 2002, A&A, 391, 945
- Poletto et al. (1988) Poletto, G., Pallavicini, R., & Kopp, R. A. 1988, A&A, 201, 93
- Pooley & Hut (2006) Pooley, D. & Hut, P. 2006, ApJ, 646, L143
- Pooley et al. (2003) Pooley, D., Lewin, W. H. G., Anderson, S. F., et al. 2003, ApJ, 591, L131
- Predehl & Schmitt (1995) Predehl, P. & Schmitt, J. H. M. M. 1995, A&A, 293, 889
- Pringle (1977) Pringle, J. E. 1977, MNRAS, 178, 195
- Ramsay et al. (2004) Ramsay, G., Bridge, C. M., Cropper, M., et al. 2004, MNRAS, 354, 773
- Ramsay & Cropper (2003) Ramsay, G. & Cropper, M. 2003, MNRAS, 338, 219
- Ritter & Kolb (2003) Ritter, H. & Kolb, U. 2003, A&A, 404, 301
- Schröder & Schmitt (2007) Schröder, C. & Schmitt, J. H. M. M. 2007, A&A, 475, 677
- Servillat et al. (2008) Servillat, M., Webb, N. A., & Barret, D. 2008, A&A, 480, 397
- Shara et al. (1996) Shara, M. M., Bergeron, L. E., Gilliland, R. L., Saha, A., & Petro, L. 1996, ApJ, 471, 804
- Shara et al. (2005) Shara, M. M., Hinkley, S., Zurek, D. R., Knigge, C., & Dieball, A. 2005, AJ, 130, 1829
- Verbunt et al. (1997) Verbunt, F., Bunk, W. H., Ritter, H., & Pfeffermann, E. 1997, A&A, 327, 602
- Verbunt & Hut (1987) Verbunt, F. & Hut, P. 1987, in IAU Symp. 125: The Origin and Evolution of Neutron Stars, ed. D. J. Helfand & J.-H. Huang, 187
- Vogel et al. (2008) Vogel, J., Byckling, K., Schwope, A., et al. 2008, A&A, 485, 787
- Walker (1999) Walker, A. R. 1999, AJ, 118, 432
- Warner (1995) Warner, B. 1995, Cataclysmic variable stars (Cambridge Astrophysics Series, Cambridge, New York: Cambridge University Press, —c1995)
- Webb et al. (2004) Webb, N. A., Serre, D., Gendre, B., et al. 2004, A&A, 424, 133
- Webb et al. (2006) Webb, N. A., Wheatley, P. J., & Barret, D. 2006, A&A, 445, 155
- Wheatley et al. (2003) Wheatley, P. J., Mauche, C. W., & Mattei, J. A. 2003, MNRAS, 345, 49
- Wheatley & West (2003) Wheatley, P. J. & West, R. G. 2003, MNRAS, 345, 1009
- Yi et al. (2001) Yi, S., Demarque, P., Kim, Y.-C., et al. 2001, ApJS, 136, 417
1
| ID | Det. | XMM | RA2000 | Dec2000 | Error | Cts | Flux | XMM flux | HR | XMM HR | NH | PH | KS |
|---|---|---|---|---|---|---|---|---|---|---|---|---|---|
| 1 | w | C2 | 9h12m01.91s | 645150.67 | 0.05 | 98 | 2.23 0.47 | 3.60 0.54 | 0.96 0.03 | 0.68 0.05 | 0.12 | 3.74 | 6.25E-02 |
| 2 | w | – | 9h12m01.72s | 645141.25 | 0.11 | 22 | 0.55 0.32 | – | 0.27 0.21 | – | 0.12 | 1.47 | 4.11E-01 |
| 3 | w | – | 9h12m03.32s | 645140.08 | 0.12 | 20 | 0.90 0.46 | – | 0.50 0.19 | – | 0.12 | 0.18 | 2.62E-03 |
| 4 | w | C2 | 9h12m01.28s | 645149.63 | 0.22 | 6 | 0.14 0.12 | 3.60 0.54 | 0.33 0.38 | 0.68 0.05 | 0.12 | 1.74 | 2.08E-01 |
| 5 | w | C1 | 9h12m04.02s | 645149.01 | 0.13 | 17 | 0.53 0.43 | 10.42 0.83 | 0.06 0.24 | 0.13 0.04 | 0.12 | 0.90 | 8.64E-01 |
| 6 | h | – | 9h12m01.29s | 645139.52 | 0.28 | 4 | 0.09 0.08 | – | 0.50 0.43 | – | 0.12 | 1.89 | 3.20E-01 |
| 7 | w | C1 | 9h12m04.39s | 645148.23 | 0.05 | 109 | 2.90 0.81 | 10.42 0.83 | 0.14 0.09 | 0.13 0.04 | 0.12 | 1.35 | 9.67E-01 |
| 8 | h | – | 9h12m03.86s | 645138.50 | 0.25 | 5 | 0.14 0.13 | – | 0.20 0.44 | – | 0.12 | 1.15 | 5.57E-01 |
| 9 | h | – | 9h12m01.40s | 645156.97 | 0.25 | 5 | 0.12 0.11 | – | 0.20 0.44 | – | 0.12 | 1.57 | 7.95E-01 |
| 10 | w | C1 | 9h12m04.84s | 645147.50 | 0.05 | 99 | 2.60 0.90 | 10.42 0.83 | 0.21 0.10 | 0.13 0.04 | 0.12 | 1.38 | 9.78E-01 |
| 11 | w | C1 | 9h12m04.83s | 645151.69 | 0.12 | 20 | 0.60 0.37 | 10.42 0.83 | 0.20 0.22 | 0.13 0.04 | 0.12 | 0.96 | 2.31E-01 |
| 12 | w | C3 | 9h12m00.85s | 645158.04 | 0.14 | 15 | 0.43 0.30 | 1.56 0.45 | 0.07 0.26 | 0.11 0.16 | 0.12 | 1.22 | 7.19E-01 |
| 13 | w | C4 | 9h12m03.53s | 645201.77 | 0.09 | 33 | 0.81 0.39 | 1.37 0.46 | 0.09 0.17 | 0.18 0.15 | 0.12 | 1.48 | 5.80E-01 |
| 14 | h | C4 | 9h12m03.89s | 645203.16 | 0.28 | 4 | 0.09 0.07 | 1.37 0.46 | 0.50 0.43 | 0.18 0.15 | 0.12 | 1.88 | 9.26E-01 |
| 15 | w | – | 9h12m02.46s | 645206.23 | 0.12 | 20 | 0.44 0.26 | – | 0.40 0.20 | – | 0.12 | 1.87 | 7.56E-01 |
| 16 | w | – | 9h12m04.62s | 645209.79 | 0.05 | 97 | 2.40 0.66 | – | 0.15 0.10 | – | 0.12 | 1.55 | 1.85E-03 |
| 17 | w | – | 9h12m00.96s | 645054.48 | 0.21 | 7 | 0.12 0.09 | – | 0.43 0.34 | – | 0.12 | 2.57 | 8.32E-03 |
| 18 | w | – | 9h11m53.61s | 645206.42 | 0.23 | 6 | 0.23 0.17 | – | -1.00 0.26 | – | 0.12 | 2.67 | 3.57E-01 |
| 19 | w | – | 9h12m14.80s | 645141.96 | 0.21 | 8 | 0.25 0.24 | – | 0.00 0.35 | – | 0.12 | 0.89 | 4.18E-01 |
| 20 | w | – | 9h11m48.86s | 645249.45 | 0.27 | 5 | 0.10 0.07 | – | -1.00 0.30 | – | 0.12 | 3.20 | 9.68E-01 |
| 21 | w | – | 9h11m44.48s | 645128.20 | 0.12 | 27 | 0.65 0.55 | – | 0.26 0.19 | – | 0.12 | 1.55 | 5.05E-02 |
| 22 | w | – | 9h12m17.46s | 645309.41 | 0.29 | 5 | 0.13 0.12 | – | 0.20 0.44 | – | 0.12 | 1.32 | 9.37E-01 |
| 23 | w | – | 9h12m08.06s | 644940.57 | 0.16 | 20 | 0.60 0.45 | – | 0.20 0.22 | – | 0.12 | 1.13 | 8.82E-02 |
| 24 | w | – | 9h11m51.14s | 644943.26 | 0.21 | 11 | 0.48 0.29 | – | 0.45 0.27 | – | 0.12 | 0.29 | 9.65E-01 |
| 25 | w | – | 9h11m41.79s | 645028.62 | 0.26 | 8 | 0.85 0.79 | – | 0.50 0.31 | – | 0.12 | 0.31 | 5.39E-01 |
| 26 | w | 46 | 9h12m26.51s | 645257.02 | 0.17 | 21 | 0.45 0.29 | 0.66 0.27 | 0.62 0.17 | 0.41 0.16 | 0.12 | 2.41 | 1.63E-01 |
| 27 | w | – | 9h12m04.15s | 644855.47 | 0.20 | 17 | 0.86 0.54 | – | 0.53 0.21 | – | 0.12 | 0.18 | 3.06E-01 |
| 28 | h | – | 9h11m35.62s | 645159.52 | 0.26 | 8 | 0.44 0.33 | – | 0.50 0.31 | – | 0.12 | 0.28 | 8.31E-01 |
| 29 | w | – | 9h11m39.41s | 645001.65 | 0.30 | 8 | 1.37 0.69 | – | 0.50 0.31 | – | 0.12 | 0.70 | 2.84E-01 |
| 30 | w | – | 9h11m33.32s | 645134.27 | 0.33 | 6 | 0.16 0.16 | – | 0.33 0.38 | – | 0.12 | 0.97 | 9.36E-01 |
| 31 | w | 17 | 9h11m33.32s | 645103.25 | 0.12 | 43 | 0.96 0.25 | 1.66 0.42 | 0.91 0.06 | 0.37 0.11 | 0.12 | 3.56 | 8.67E-02 |
| 32 | w | – | 9h11m50.44s | 644843.59 | 0.20 | 21 | 0.45 0.25 | – | 0.52 0.19 | – | 0.12 | 2.09 | 8.34E-01 |
| 33 | w | 29 | 9h12m02.10s | 645506.43 | 0.12 | 39 | 1.00 0.43 | 1.22 0.33 | 0.13 0.16 | 0.22 0.12 | 0.12 | 1.48 | 6.89E-01 |
| 34 | w | – | 9h12m24.38s | 644922.59 | 0.41 | 7 | 0.25 0.24 | – | 0.14 0.37 | – | 0.12 | 0.84 | 9.84E-01 |
| 35 | w | – | 9h11m49.00s | 645448.78 | 0.27 | 8 | 0.20 0.18 | – | 0.00 0.35 | – | 0.12 | 1.42 | 5.22E-01 |
| 36 | w | 7 | 9h12m18.58s | 644841.13 | 0.10 | 117 | 2.75 0.69 | 2.90 0.49 | 0.35 0.09 | 0.42 0.07 | 0.12 | 1.76 | 7.57E-01 |
| 37 | w | 37 | 9h12m33.48s | 645027.83 | 0.13 | 60 | 1.90 0.78 | 1.46 0.40 | 0.03 0.13 | 0.18 0.14 | 0.12 | 1.05 | 4.56E-01 |
| 38 | h | – | 9h12m21.80s | 645453.17 | 0.37 | 7 | 0.26 0.16 | – | -1.00 0.23 | – | 0.12 | 3.62 | 8.16E-01 |
| 39 | w | 22 | 9h12m35.07s | 645318.59 | 0.16 | 39 | 1.23 0.34 | 0.89 0.25 | 0.90 0.07 | 0.77 0.08 | 0.12 | 4.67 | 6.82E-01 |
| 40 | w | – | 9h12m15.21s | 645520.70 | 0.32 | 9 | 0.47 0.46 | – | 0.78 0.21 | – | 0.12 | 0.07 | 9.49E-01 |
| 41 | w | 2 | 9h11m28.05s | 645035.65 | 0.04 | 513 | 11.69 1.18 | 14.36 1.02 | 0.43 0.04 | 0.30 0.03 | 0.12 | 1.95 | 7.37E-01 |
| 42 | w | 26 | 9h12m27.07s | 644849.05 | 0.17 | 55 | 1.53 0.40 | 1.25 0.39 | 0.27 0.13 | 0.35 0.13 | 0.12 | 1.36 | 3.27E-01 |
| 43 | w | 41 | 9h12m34.69s | 645349.51 | 0.20 | 29 | 0.72 0.26 | 0.43 0.19 | 0.93 0.07 | 0.85 0.12 | 0.12 | 3.71 | 9.59E-01 |
| 44 | h | 91 | 9h12m30.89s | 645426.59 | 0.46 | 6 | 0.36 0.27 | 0.91 0.39 | 1.00 0.26 | 0.57 0.23 | 0.12 | 0.55 | 2.77E-01 |
| 45 | w | – | 9h12m21.32s | 644817.39 | 0.35 | 14 | 0.43 0.31 | – | 0.14 0.26 | – | 0.12 | 0.92 | 2.10E-01 |
| 46 | h | – | 9h11m24.70s | 645156.19 | 0.36 | 8 | 0.29 0.28 | – | 0.25 0.34 | – | 0.12 | 0.68 | 6.00E-01 |
| 47 | w | 13 | 9h11m26.46s | 645314.20 | 0.13 | 57 | 2.56 1.20 | 4.32 0.66 | 0.40 0.12 | 0.54 0.08 | 0.12 | 0.31 | 6.66E-02 |
| 48 | w | 85 | 9h12m13.85s | 644751.40 | 0.29 | 19 | 0.56 0.40 | 0.68 0.32 | 0.05 0.23 | 0.53 0.43 | 0.12 | 1.06 | 8.28E-02 |
| 49 | w | – | 9h12m30.56s | 644854.15 | 0.43 | 11 | 0.77 0.75 | – | 0.82 0.17 | – | 0.12 | 0.89 | 4.52E-01 |
| 50 | w | – | 9h12m34.25s | 644908.26 | 0.49 | 9 | 0.38 0.30 | – | 0.33 0.31 | – | 0.12 | 0.10 | 5.12E-01 |
| 51 | w | 50 | 9h12m39.52s | 645331.60 | 0.36 | 11 | 0.37 0.20 | 0.51 0.23 | -1.00 0.16 | 0.67 0.14 | 0.12 | 4.80 | 7.39E-03 |
| 52 | w | 67 | 9h12m42.46s | 645034.62 | 0.34 | 16 | 0.38 0.30 | 0.70 0.31 | 0.00 0.25 | 0.17 0.20 | 0.12 | 1.55 | 1.84E-01 |
| 53 | w | 24 | 9h12m01.37s | 645611.87 | 0.20 | 27 | 0.74 0.25 | 0.63 0.20 | 0.93 0.07 | 0.91 0.08 | 0.12 | 4.43 | 7.25E-01 |
| 54 | h | – | 9h11m43.90s | 645546.53 | 0.42 | 7 | 0.25 0.24 | – | 0.43 0.34 | – | 0.12 | 0.67 | 8.73E-01 |
| 55 | w | – | 9h11m43.64s | 645555.84 | 0.34 | 11 | 0.52 0.43 | – | 0.64 0.23 | – | 0.12 | 0.00 | 1.55E-01 |
| 56 | w | 3 | 9h11m18.86s | 645058.19 | 0.06 | 453 | 9.62 1.10 | 9.17 0.77 | 0.59 0.04 | 0.55 0.03 | 0.12 | 2.55 | 3.36E-14 |
| 57 | w | – | 9h11m17.27s | 645245.02 | 0.36 | 13 | 0.27 0.23 | – | 0.08 0.28 | – | 0.12 | 1.89 | 4.99E-01 |
| 58 | w | – | 9h11m22.95s | 645418.78 | 0.26 | 26 | 0.53 0.27 | – | 0.62 0.15 | – | 0.12 | 2.66 | 2.18E-02 |
| 59 | h | – | 9h11m59.68s | 645646.54 | 0.43 | 9 | 0.32 0.31 | – | 0.11 0.33 | – | 0.12 | 0.80 | 4.00E-01 |
| 60 | w | – | 9h11m15.90s | 645227.63 | 0.49 | 8 | 0.17 0.12 | – | 0.75 0.23 | – | 0.12 | 3.03 | 1.65E-01 |
| 61 | w | 25 | 9h11m28.81s | 645521.77 | 0.15 | 79 | 1.74 0.46 | 0.86 0.27 | 0.49 0.10 | 0.79 0.09 | 0.12 | 2.33 | 8.45E-02 |
| 62 | w | 45 | 9h11m34.51s | 645557.17 | 0.25 | 28 | 0.89 0.42 | 0.87 0.32 | 0.07 0.19 | 0.43 0.14 | 0.12 | 1.03 | 3.43E-01 |
| 63 | w | – | 9h12m50.76s | 645225.27 | 0.38 | 19 | 0.45 0.18 | – | 0.68 0.17 | – | 0.12 | 3.21 | 5.90E-02 |
| 64 | w | 62 | 9h12m51.77s | 645208.18 | 0.36 | 21 | 0.56 0.36 | 0.70 0.32 | 0.14 0.22 | 0.24 0.31 | 0.12 | 1.55 | 4.21E-01 |
| 65 | w | – | 9h12m47.28s | 645406.97 | 0.30 | 32 | 0.86 0.46 | – | 0.25 0.17 | – | 0.12 | 1.32 | 4.49E-01 |
| 66 | h | – | 9h12m06.37s | 645704.47 | 0.60 | 6 | 0.36 0.23 | – | 0.67 0.30 | – | 0.12 | 0.45 | 6.71E-01 |
| 67 | h | – | 9h12m18.64s | 645652.58 | 0.50 | 10 | 0.27 0.22 | – | 0.00 0.32 | – | 0.12 | 1.00 | 1.24E-01 |
| 68 | w | – | 9h11m16.26s | 644932.16 | 0.61 | 9 | 0.12 0.11 | – | 0.33 0.31 | – | 0.12 | 1.01 | 4.69E-01 |
| 69 | w | – | 9h11m53.33s | 645716.17 | 0.44 | 12 | 0.55 0.27 | – | 0.50 0.25 | – | 0.12 | 0.12 | 7.67E-01 |
| 70 | w | – | 9h11m58.93s | 645722.85 | 0.54 | 9 | 0.18 0.13 | – | 0.78 0.21 | – | 0.12 | 2.83 | 7.86E-01 |
| 71 | w | – | 9h12m50.21s | 645419.80 | 0.51 | 15 | 0.29 0.22 | – | 0.20 0.25 | – | 0.12 | 1.10 | 9.79E-01 |
| 72 | w | 59 | 9h11m08.50s | 645113.21 | 0.40 | 21 | 0.80 0.45 | 0.82 0.39 | 0.14 0.22 | 0.10 0.57 | 0.12 | 0.50 | 1.36E-01 |
| 73 | w | 5 | 9h12m56.91s | 645227.62 | 0.10 | 336 | 19.35 3.55 | 19.24 2.08 | 0.65 0.04 | 0.85 0.04 | 0.12 | 0.13 | 5.82E-01 |
| 74 | w | 77 | 9h12m23.34s | 645710.49 | 0.36 | 26 | 0.66 0.25 | 0.34 0.27 | 0.92 0.08 | 0.62 0.27 | 0.12 | 3.97 | 5.01E-01 |
| 75 | h | – | 9h12m31.11s | 645713.75 | 0.60 | 15 | 0.64 0.63 | – | 0.33 0.24 | – | 0.12 | 0.26 | 3.77E-01 |
| 76 | w | 47 | 9h11m12.12s | 645501.03 | 0.26 | 58 | 1.49 0.53 | 1.47 0.49 | 0.31 0.12 | 0.05 0.15 | 0.12 | 1.65 | 8.50E-01 |
| 77 | w | 6 | 9h13m01.44s | 645216.44 | 0.18 | 146 | 3.74 1.07 | 3.91 0.60 | 0.32 0.08 | 0.30 0.06 | 0.12 | 1.76 | 9.26E-01 |
| 78 | w | – | 9h11m29.21s | 645709.05 | 0.58 | 14 | 0.26 0.23 | – | 0.14 0.26 | – | 0.12 | 1.75 | 9.06E-01 |
| 79 | w | 86 | 9h12m29.44s | 644558.22 | 0.47 | 32 | 2.69 1.22 | 1.18 0.48 | 0.94 0.06 | 1.00 0.15 | 0.12 | -1.32 | 5.87E-02 |
| 80 | w | – | 9h12m20.92s | 645808.86 | 0.51 | 21 | 0.74 0.67 | – | 0.14 0.22 | – | 0.12 | 0.57 | 2.06E-01 |
| 81 | w | 88 | 9h11m21.84s | 645654.49 | 0.45 | 25 | 1.22 0.72 | 1.20 0.45 | 0.60 0.16 | 0.84 0.17 | 0.12 | 0.30 | 9.69E-03 |
| 82 | w | 14 | 9h12m50.13s | 645612.30 | 0.19 | 158 | 4.65 0.97 | 3.05 0.59 | 0.20 0.08 | 0.09 0.09 | 0.12 | 1.45 | 3.55E-02 |
| 83 | w | 38 | 9h11m17.22s | 644652.99 | 0.37 | 57 | 1.59 0.59 | 1.54 0.58 | 0.09 0.13 | 0.21 0.15 | 0.12 | 1.16 | 6.94E-01 |
| 84 | w | 23 | 9h12m36.86s | 644545.01 | 0.34 | 79 | 1.99 0.64 | 2.39 0.59 | 0.19 0.11 | 0.01 0.11 | 0.12 | 1.62 | 3.68E-01 |
| 85 | w | 19 | 9h10m57.93s | 644933.42 | 0.24 | 123 | 2.77 0.88 | 3.26 0.68 | 0.51 0.08 | 0.33 0.08 | 0.12 | 2.10 | 7.64E-02 |
| 86 | w | 76 | 9h12m13.55s | 644432.76 | 0.51 | 41 | 0.91 0.51 | 1.32 0.51 | 0.02 0.16 | 0.72 0.19 | 0.12 | 1.32 | 8.39E-01 |
| 87 | h | 56 | 9h12m43.92s | 645742.63 | 0.65 | 25 | 0.35 0.20 | 0.64 0.31 | 0.04 0.20 | 0.49 0.19 | 0.12 | 3.04 | 5.64E-01 |
| 88 | w | – | 9h12m52.44s | 645655.44 | 0.53 | 36 | 0.91 0.57 | – | 0.17 0.16 | – | 0.12 | 1.33 | 1.28E-01 |
| 89 | w | – | 9h13m05.36s | 645457.27 | 0.76 | 18 | 0.29 0.19 | – | 0.00 0.24 | – | 0.12 | 2.80 | 2.68E-01 |
| 90 | h | – | 9h12m23.50s | 644443.09 | 0.64 | 28 | 0.97 0.49 | – | 0.36 0.18 | – | 0.12 | 0.65 | 4.08E-01 |
| 91 | w | 53 | 9h11m27.67s | 644515.12 | 0.46 | 51 | 1.03 0.46 | 1.55 0.58 | 0.29 0.13 | 0.02 0.21 | 0.12 | 1.94 | 6.07E-01 |
| 92 | h | 31 | 9h13m12.54s | 645257.87 | 0.49 | 42 | 1.27 0.75 | 0.96 0.37 | 0.05 0.15 | 0.50 0.15 | 0.12 | 1.18 | 6.04E-01 |
| 93 | w | – | 9h11m39.48s | 644436.23 | 0.77 | 21 | 0.31 0.28 | – | 0.05 0.22 | – | 0.12 | 0.57 | 9.32E-01 |
| 94 | h | 68 | 9h13m12.10s | 644913.44 | 0.68 | 32 | 0.78 0.38 | 0.66 0.38 | 0.12 0.18 | 0.41 0.22 | 0.12 | 1.63 | 9.65E-01 |
| 95 | w | 55 | 9h10m49.56s | 645301.46 | 0.52 | 34 | 0.75 0.33 | 1.04 0.46 | 0.35 0.16 | 0.24 0.18 | 0.12 | 2.72 | 3.72E-01 |
| 96 | h | – | 9h10m57.94s | 645544.48 | 0.65 | 26 | 0.47 0.27 | – | 0.15 0.19 | – | 0.12 | 1.16 | 2.17E-02 |
| 97 | w | 12 | 9h11m37.60s | 644404.10 | 0.35 | 112 | 2.66 0.62 | 3.76 0.74 | 0.29 0.09 | 0.27 0.08 | 0.12 | 1.82 | 3.42E-02 |
| 98 | h | 43 | 9h12m09.52s | -650014.72 | 0.62 | 37 | 1.19 0.79 | 1.70 0.53 | 0.14 0.16 | 0.14 0.15 | 0.12 | 0.91 | 6.89E-01 |
| 99 | w | 1 | 9h10m49.68s | 644814.13 | 0.25 | 242 | 11.84 3.01 | 55.16 2.59 | 0.35 0.06 | 0.00 0.02 | 0.12 | 0.20 | 2.94E-01 |
| 100 | h | 71 | 9h10m42.82s | 645313.70 | 0.71 | 28 | 1.14 0.88 | 1.15 0.44 | 0.21 0.18 | 0.23 0.87 | 0.12 | 0.23 | 1.50E-01 |
| 101 | h | 27 | 9h13m23.50s | 645104.60 | 0.71 | 40 | 0.66 0.30 | 2.18 0.59 | 0.05 0.16 | 0.11 0.12 | 0.12 | 1.94 | 9.21E-01 |
| 102 | w | – | 9h10m48.59s | 645538.02 | 0.84 | 24 | 1.01 0.62 | – | 0.42 0.19 | – | 0.12 | 0.27 | 9.76E-01 |
| 103 | h | 83 | 9h10m39.27s | 645140.10 | 0.78 | 30 | 0.50 0.32 | 0.86 0.45 | 0.07 0.18 | 0.06 0.23 | 0.12 | 1.62 | 3.57E-01 |
| 104 | h | – | 9h12m24.02s | -650028.78 | 0.93 | 26 | 0.51 0.30 | – | 0.08 0.20 | – | 0.12 | 2.44 | 6.95E-01 |
| 105 | w | 44 | 9h12m10.27s | 644244.74 | 0.35 | 168 | 4.21 1.00 | 1.06 0.42 | 0.32 0.07 | 0.60 0.13 | 0.12 | 1.77 | 5.63E-01 |
| 106 | h | – | 9h10m42.92s | 645507.85 | 0.67 | 40 | 0.66 0.34 | – | 0.15 0.16 | – | 0.12 | 2.62 | 8.54E-02 |
| 107 | w | 16 | 9h13m37.06s | 645201.10 | 0.43 | 167 | 6.95 1.67 | 4.99 0.89 | 0.17 0.08 | 0.33 0.09 | 0.12 | 0.58 | 9.68E-01 |
| 108 | h | 61 | 9h11m54.18s | -650202.85 | 1.07 | 30 | 0.42 0.24 | 1.62 0.56 | 0.20 0.18 | 0.48 0.21 | 0.12 | 1.73 | 5.80E-01 |
| 109 | h | 28 | 9h11m57.39s | -650252.76 | 0.85 | 60 | 1.11 0.49 | 1.38 0.45 | 0.03 0.13 | 0.60 0.12 | 0.12 | 1.64 | 2.85E-01 |
| 110 | h | 15 | 9h12m51.60s | -650213.39 | 0.54 | 207 | 4.92 0.94 | 3.80 0.77 | 0.29 0.07 | 0.23 0.09 | 0.12 | 1.53 | 8.32E-01 |
| 111 | h | 20 | 9h13m28.39s | 645918.40 | 0.61 | 170 | 1.75 0.36 | 1.47 0.42 | 0.44 0.07 | 0.88 0.07 | 0.12 | 2.79 | 4.60E-01 |
| 112 | h | 90 | 9h14m02.25s | 645708.79 | 0.80 | 171 | 1.46 0.56 | 1.50 0.66 | 0.01 0.08 | 0.50 0.28 | 0.12 | 1.51 | 6.26E-01 |
| 113 | h | 79 | 9h13m32.22s | -650152.75 | 0.52 | 218 | 2.43 0.48 | 1.90 0.78 | 0.49 0.06 | 0.14 0.25 | 0.12 | 2.29 | 7.11E-08 |