DLA kinematics and outflows from starburst galaxies.
Abstract
We present results from a numerical study of the multiphase interstellar medium in sub-Lyman-break galaxy protogalactic clumps. Such clumps are abundant at and are thought to be a major contributor to damped Ly absorption. We model the formation of winds from these clumps and show that during star formation episodes they feature outflows with neutral gas velocity widths up to several hundred . Such outflows are consistent with the observed high-velocity dispersion in DLAs. In our models thermal energy feedback from winds and supernovae results in efficient outflows only when cold (), dense () clouds are resolved at grid resolution of . At lower resolution the first signs of the multiphase medium are spotted; however, at this low resolution thermal injection of feedback energy cannot yet create hot expanding bubbles around star-forming regions – instead feedback tends to erase high-density peaks and suppress star formation. At resolution feedback compresses cold clouds, often without disrupting the ongoing star formation; at the same time a larger fraction of feedback energy is channeled into low-density bubbles and winds. These winds often entrain compact neutral clumps which produce multi-component metal absorption lines.
Subject headings:
galaxies: formation — galaxies: kinematics and dynamics — intergalactic medium1. introduction
Current numerical galaxy formation models can successfully reproduce some of the properties of damped Ly absorbers (DLAs), such as the lower end () of the column density distribution and the total incidence rate (Pontzen et al., 2008; Razoumov et al., 2007), the distribution of metals, and the slope of the relation between metallicity and low-ion velocity width which appears to originate in the mass-metallicity relation in the models (Pontzen et al., 2008). On the other hand, simulations tend to overpredict the number of DLAs with and systematically produce fewer high-velocity systems. Most such systems feature multiple components in their absorption line profiles, but unfortunately one cannot map these components from the velocity space to real space to identify the absorption regions and constrain the mechanism producing such high velocities.
In general, the velocity dispersion of neutral gas clouds can come either from the gravitational infall in the process of hierarchical buildup of galaxies, in the form of random velocities of protogalactic clumps (Haehnelt et al., 1998), or from feedback from stellar winds and supernovae (SNe) (Schaye, 2001). In fairly massive halos at as much as of gas by mass can be in the cold phase surviving the infall (Razoumov et al., 2007). The corresponding can account for part of the observed neutral gas velocity dispersion. However, more massive halos are rare at , and the fraction of cold gas drops sharply in halos, leaving us in search of other mechanisms to produce high velocities.
Galactic winds driven by the feedback energy from stellar winds and SNe are an obvious candidate (Schaye, 2001). Star-forming Lyman-break galaxies (LBGs) at show evidence for large-scale outflows with typical velocities of hundreds (Pettini et al., 1998, 2001). In fact, with a simple semi-analytical model McDonald & Miralda-Escudé (1999) showed that feedback at the rate per of halo dark matter mass added to the velocity dispersion of neutral clouds inside virialized halos works out perfectly to explain the observed DLA kinematics. However, this energy transfer takes place on pc scales currently inaccessible to cosmological models. Moreover, the inability of numerical galaxy formation models to capture physics on such small scales has led to a number of predicaments, the most famous of which is the overcooling problem, accompanied by the excessive loss of angular momentum in simulated galactic disks.
This classical problem (Katz, 1992) has been somewhat alleviated in recent years (Thacker & Couchman, 2000; Sommer-Larsen et al., 2003) as it was realized that feedback from young stars can be very efficient at keeping gas in a diluted state preventing it from rapid collapse and conversion into stars. However, even galaxy models at a sub-kpc () resolution cannot capture propagation of supernova blastwaves into the interstellar medium (ISM), as the injected thermal energy is radiated away very quickly before it can be converted into kinetic energy. The reason is very simple: the mass of a resolution element to which the feedback energy is supplied is usually several orders of magnitude larger than the typical mass of a SN ejecta. Therefore, the temperature and expansion velocity of the post-shock regions are greatly underestimated, and so is the cooling time which scales as above (Dalla Vecchia & Schaye, 2008).
Cosmological simulations must then turn to ad-hoc assumptions about the role of stellar feedback at scales below their resolution limit. Two types of solutions have been popular. The first one is suppressing radiative cooling in the feedback regions for the duration of the starburst (Mori et al., 1997; Thacker & Couchman, 2000; Sommer-Larsen et al., 2003; Stinson et al., 2006), to allow more efficient conversion of feedback energy into hydrodynamical expansion. This approach leads to more realistic simulated galaxies that correctly reproduce many of the observed properties of present-day disk galaxies and have only with a small deficiency in angular momentum. On the other hand due to lack of resolution the feedback energy is supplied to a fairly large mass, and the outflow velocities are usually underestimated. This method is known to produce “puffy” galaxies that cannot reproduce the high-end tail of the observed DLA velocity dispersion (Razoumov et al., 2007). Since these galaxies extend to larger radii, their outer regions may pick part of the velocity dispersion of the local galaxy group, so that they have slightly less severe kinematics problem (Pontzen et al., 2008) than similar-resolution models which do not suppress radiative cooling.
The second widespread approach is to use kinetic feedback instead of thermal feedback (Navarro & White, 1993; Springel & Hernquist, 2003; Dalla Vecchia & Schaye, 2008), usually implemented in particle-based simulations. Although there are several variations of this method, the basic idea is to give a velocity kick to a small fraction of gas particles near the star-forming regions, adjusting the mass loading and velocities to reproduce observations. Some of the recipes turn off hydrodynamical interaction of the wind particles with the gas to obtain large-scale outflows, while other stress the importance of such interaction to create hot bubbles in the ISM and develop galactic fountains (Dalla Vecchia & Schaye, 2008).
A popular method to circumvent some of the resolution problems that can be combined with either of the above two approaches is to use a sub-resolution multiphase model that describes analytically growth of cold clouds embedded in a hot intercloud medium, star formation (SF) in these clouds, feedback and cloud evaporation (Yepes et al., 1997; Springel & Hernquist, 2003). In such models SF and feedback are self-regulating. However, different phases are not dynamically separated from each other, and therefore by itself such model cannot result in outflows.
At the other end of the resolution spectrum, detailed models of small patches of galactic disks, usually in the context of the Milky Way galaxy, provide sufficient resolution to study turbulent ISM stirred by SN explosions. Such models resolve hot bubbles driven by individual SNe, fragmentation of shells created by these bubbles, and the structure of cold dense clouds on pc scales (e.g., Joung & Mac Low, 2006). High SF rates in such models naturally lead to galactic outflows, galactic fountains rising to several kpc away from the midplane, and shell fragments raining back onto the disk as intermediate-velocity cold clouds (Joung & Mac Low, 2006). Such high-resolution simulations can in principle be used to develop subgrid models of stellar energy feedback for a given SF rate in cosmological simulations, although to the best of our knowledge currently there are no subgrid models in the literature that separate the dynamics of different components of the ISM.
In the past few years it has become possible to extend such high-resolution 3D models to entire galactic disks, albeit at a lower spatial resolution. Tasker & Bryan (2006) used adaptive mesh refinement (AMR) models to study the multiphase ISM in a quiescent Milky Way-sized disk galaxy. They employ two SF prescriptions, one based on cosmological simulations, with low SF threshold () and low efficiency, and the other one with a much higher threshold () and a high efficiency. Their highest numerical resolution is which is a typical size of giant molecular clouds; they include cooling to and later add photoelectric heating (Tasker & Bryan, 2008). Their models reproduce a multiphase ISM with most of the mass in cold, dense clouds, while SN feedback drives gas out of the plane of the galaxy, but most of it eventually falls back on the disk. All of their models reproduce the slope of the observed relation between the SF rate and the gas surface density, on both global and local scales, although the high-density threshold models tend to produce more intermittent outflows and occasionally triggered SF in the outer disk.
Saitoh et al. (2008) carried out SPH simulations of an isolated gas disk with particles to study the effect of various SF prescriptions on the structure of the ISM. Similar to Tasker & Bryan (2006, 2008), they test both a cosmological () and a high-density () SF thresholds, but also vary the SF efficiency . Only the high-density threshold models could reproduce the complex multiphase structure of the gas disk, regardless of the value of . In these runs the SF rates depend on the modeled global gas flow from intermediate densities to the actual sites of SF rather then the actual prescribed SF efficiency. On the other hand, the low-density threshold models produce thicker and smoother disks with SF rates highly sensitive to the chosen value of . Therefore, they conclude, the use of a high SF threshold will avoid uncertainties in the SF models.
Ceverino & Klypin (2007) developed a realistic prescription for modeling feedback formulating conditions under which simulations would resolve the formation of hot bubbles in the multiphase ISM. Such bubble can only be created if simulations resolve cold dense clouds in which feedback occurs – only in these clouds heating can exceed cooling so that a large fraction of feedback energy is converted into hydrodynamical expansion, creating the hot phase and driving winds. Ceverino & Klypin (2007) also added heating by massive binary systems which are ejected from molecular clouds when one of the components becomes a SN. These “runaway stars” carry energy very efficiently away from high-density regions, eventually exploding as SNe in lower density environments and thus facilitating the formation of the hot gas component even in low-resolution cosmological models.
In this paper the approach of Ceverino & Klypin (2007) is used to study the formation of winds in high-redshift protogalactic clumps responsible for damped Ly absorption. We show that a brief episode of SF in a sub-LBG galaxy that creates a multiphase medium can also drive winds with neutral gas velocity dispersions up to several hundred . If a substantial fraction of protogalactic clumps form such winds at any given time, these winds can explain the observed DLA kinematics (Schaye, 2001). Our models resolve the effect of massive stars in protogalactic clumps. Although the spatial resolution of this study () is not sufficient to follow the details of shell fragmentation or turbulent interactions, it is argued that this resolution is adequate for modeling the multiphase medium for the purposes of computing galaxy formation and launching galactic winds in the cosmological context.
2. Models
2.1. Peak cross-section of DLA absorption
The mass range of halos that are the main contributors to the total DLA line density is still debated. Pontzen et al. (2008) argue that the main contribution comes from halos in the mass range . Lower-mass halos have much smaller absorption cross-sections due to heating by the ultraviolet background (UVB), while the number of halos with masses above drops sharply. Pontzen et al. (2008) point out that their peak at is probably related to their particular feedback implementation in which cooling is turned off to reproduce the blastwave solution. On the other hand, Nagamine et al. (2007) see a peak of DLA absorption shift to higher halo masses with the increased wind strength, reaching in the “strong wind” model.
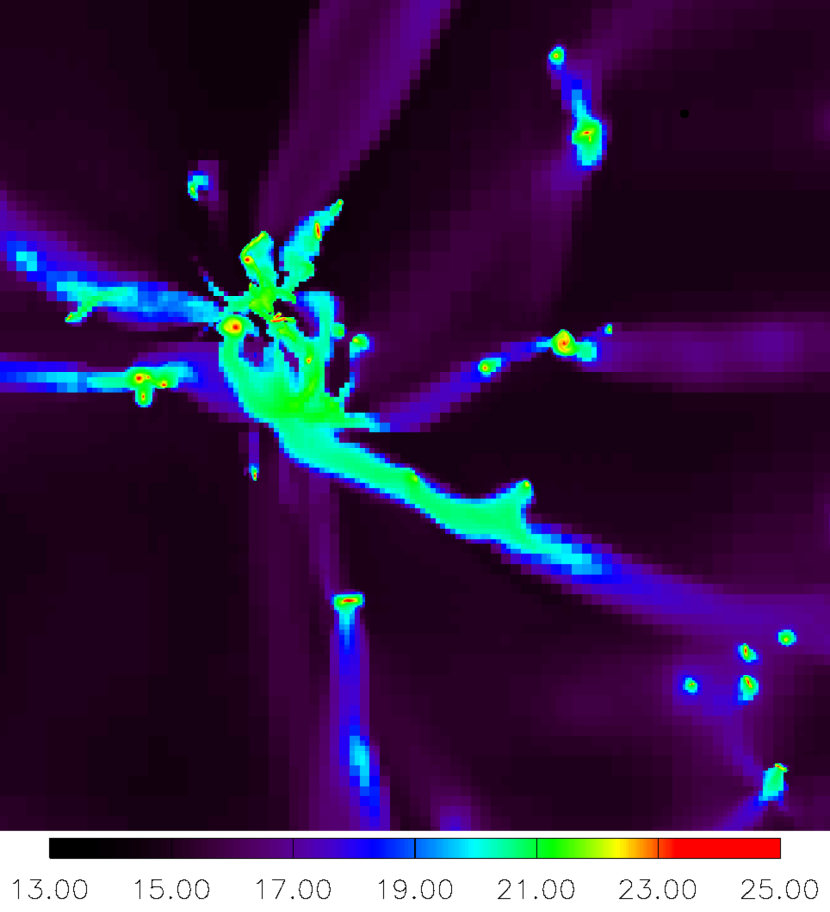
In our earlier cosmological DLA models (Razoumov et al., 2007), the most common DLA absorbers are halos in the range . At the lower end of this range, absorption is typically dominated by a single galaxy in the halo, while in halos with masses above DLAs are commonly associated with one of several protogalactic clumps with the average gas clump mass of (Fig. 1). Our goal is to model formation of winds in one of these clumps as it undergoes a starburst. For the sake of simplicity, we adopt a fixed gravitational potential with and a low , but we argue that our results are equally applicable to lower-mass () halos with .
2.2. Initial setup and grids
All simulations in this paper were performed using the AMR hydrodynamical code ENZO (O’Shea et al., 2004). The computational domain is a 3D periodic box on a side covered with a root grid and up to seven levels of refinement corresponding to spatial resolution. A fixed spherical Navarro-Frenk-White DM profile
| (1) |
is assumed at the center of the volume, where , the concentration parameter , and . The initial distribution of gas follows an isothermal disk with a temperature of and a density
| (2) |
(Tasker & Bryan, 2006). For all models we take and to approximate a compact star-forming disk at . The total mass of the gas disk is then
| (3) |
Since our disks are at least 30 times smaller than the side of the box, using a small volume is a reasonable approximation; in addition, small perturbations from nearby clumps should be always expected. To resolve the initial disk configuration, inside the central region a hierarchy of six centered nested grids is set, with the maximum initial resolution of . We start with the uniform temperature , resolving the Jeans length everywhere in the disk. During evolution we refine adaptively by the local Jeans length requiring that it must be resolved by at least 16 cells at all times, which is four times better than the Truelove criterion (Truelove et al., 1997).
A cooling function in the temperature range is assumed, with heating by the ionizing UVB from Razoumov et al. (2006) with self-shielding above . Since DLAs at have fairly high metallicities at times exceeding solar, for simplicity solar metallicity is assumed throughout all calculations.
2.3. Star formation and feedback
Star formation is modeled with discrete stellar particles that represent a population of stars born in the same cell roughly at the same time and assumed to have the same velocity vector in later evolution. In two of the three runs presented in this paper, we adopt the minimum stellar particle mass ; our stellar particles can have any mass above if a sufficient amount of gas in a given cell satisfies the following SF criteria. A stellar particle is always created at the finest local level of refinement, in cells in which (1) the total gas density exceeds the threshold , and (2) the mass of the gas is larger than the local Jeans mass. In other words, stars will be formed only in cells in which the local Jeans length is unresolved which with our refinement criterion is possible only at the highest AMR level. If a cell is marked as a candidate for SF, we compute the mass of stars it would form with the given efficiency over the local dynamical time , and scale that mass to the local timestep . If exceeds , a stellar particle is created, and the corresponding mass is removed from the gas component. Since our minimum stellar particle mass is very low and would allow us to record individual core-collapse SN events, we adopt instantaneous conversion of gas into stars with , unlike, e.g., in Tasker & Bryan (2008) where the actual SF and feedback associated with each stellar particle are continuous over the dynamical timescale.
Over its lifetime every stellar particle injects feedback energy into the thermal energy of the gas. We use a prescription similar to that of Ceverino & Klypin (2007) to include feedback by both stellar winds and type II SNe. Stellar winds supply energy at a constant rate of for after creation of the stellar particle which corresponds to conversion of of the rest-mass energy of newly created stars into feedback energy. In addition, during the last 10% of the feedback phase, SNe contribute per every of the initial stellar particle mass. This energy is added to the thermal energy of the cell hosting each stellar particle, in discrete events spread uniformly over the interval. In our starburst model most stellar particle masses fall into the range , therefore our simulations begin to resolve environmental effect of individual massive stars exploding as SNe.
In addition to energy, winds and SNe also return mass and metals to the ISM. In our models, energy and mass release into the ISM is strictly synchronized to avoid putting too much energy into regions which have been cleared by winds and/or earlier SNe. We assume that of the total mass that goes into stars is ejected back into the ISM via winds and SNe. It can be shown that the maximum sound speed in hot bubbles in simulations in which mass and energy are simultaneously released into the same cell cannot exceed
| (4) |
where is the speed of light, corresponding to the maximum temperature of . Actual temperatures in hot bubbles are somewhat lower in the range , largely due to expansion and the work performed to compress the ambient medium, and to a much lesser degree due to cooling in the bubble itself. With outflow velocities added to , the Courant-Friedrichs-Lewy (CFL) condition sets the shortest timesteps in our models to several thousand years.
In all our runs the SF efficiency is assumed. Many authors have found that the exact value of has little impact on the mean SF rates (Stinson et al., 2006, e.g.), as long as it is in the range from 0.05 to 1 (see their Fig.14). Moreover, the true efficiency of SF, i.e. the fraction of gas that is eventually converted into stars in dense clouds should be determined by an interplay of various processes starting from the hydrodynamical timescale of gas supply to the star-forming regions. Saitoh et al. (2008) have found that at sufficiently high the SF rates are effectively set by the timescale of cold gas supply from reservoirs () to the star-forming regions () which in their calculations is about five times longer than the local dynamical timescale in the star-forming regions.
In this paper we are using a set of three simulations listed in Table 1: a high-resolution starburst model A1, a high-resolution quiescent disk model A2, and a low-resolution model A3 for which was adjusted to produce the highest SF rate. The high-resolution models used 7 levels of AMR in the region centered on the disk resulting in grid resolution. The low-resolution model employed 6 levels of refinement in the same region corresponding to spatial resolution.
We ran the quiescent model to estimate the effect of star formation on the structure of the ISM and on galactic wind kinematics. There are two ways to reduce the SF rate in our models: increase the SF density threshold or increase the minimum stellar particle mass . Note that in our setup is not independent of . A star particle is formed only if in a cell exceeds . For the fiducial value and , the gas mass in a cell allowed to form stars is
| (5) |
Setting would result in immediate SF once the density exceeds , whereas using a much higher value would delay SF until more gas accumulates in the cell. For the quiescent disk model we use . This prescription ultimately results in conversion of approximately the same amount of gas into stars, but over a several times longer period, and produces a very different ISM morphology and much weaker winds.
| model | |||
|---|---|---|---|
| A1 | 7 | 158 | 100 |
| A2 | 7 | 158 | 1000 |
| A3 | 6 | 25 | 100 |
3. Results
3.1. Global ISM morphology
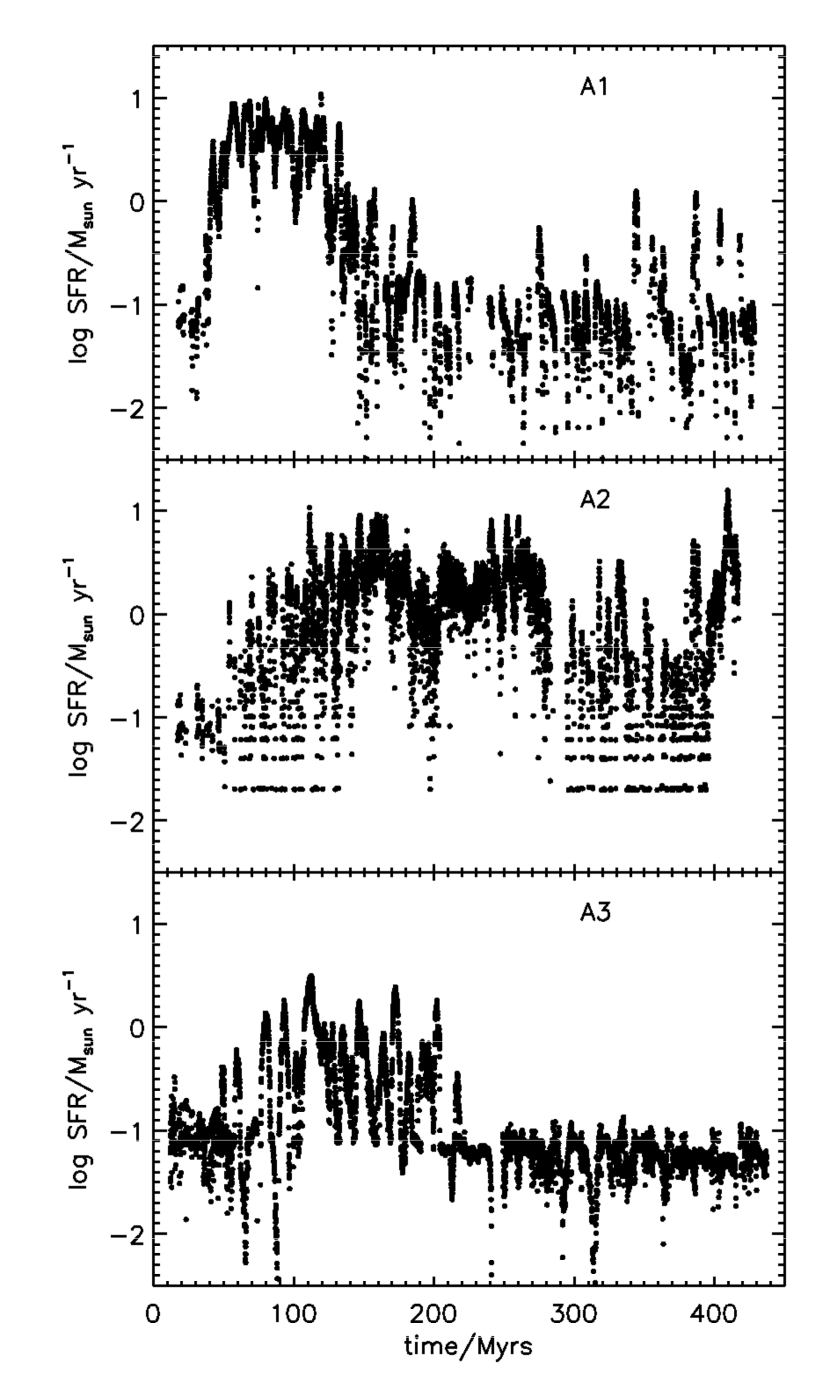
Without cooling our disks would be marginally Toomre-unstable. Adding cooling leads to rapid gas accumulation near the galactic midplane and its subsequent fragmentation into cold clumps and warm interclump material. For the initial central disk density and temperature the cooling time is of order of few years leading to gas collapse of the disk onto the midplane on the timescale of . Soon thereafter first cold clumps form in which SF begins. By high-resolution models start developing a complex ISM morphology characterized by dense clouds and filaments separated by warm () medium seen in many simulations (e.g., Wada & Norman, 2001), and to a lesser degree in the low-resolution model. In model A1 ample gas supply quickly leads to a starburst starting at and lasting (Fig. 2) in which of the gas in the disk is converted into stars. In the quiescent disk model A2 there is no single starburst phase; the first significant episode of gas conversion into stars takes place well past , with intermittent SF throughout the entire run. It is interesting that by the end of simulation A2 at approximately the same total stellar mass () is accumulated, although its effect on the underlying gas distribution will be completely different.
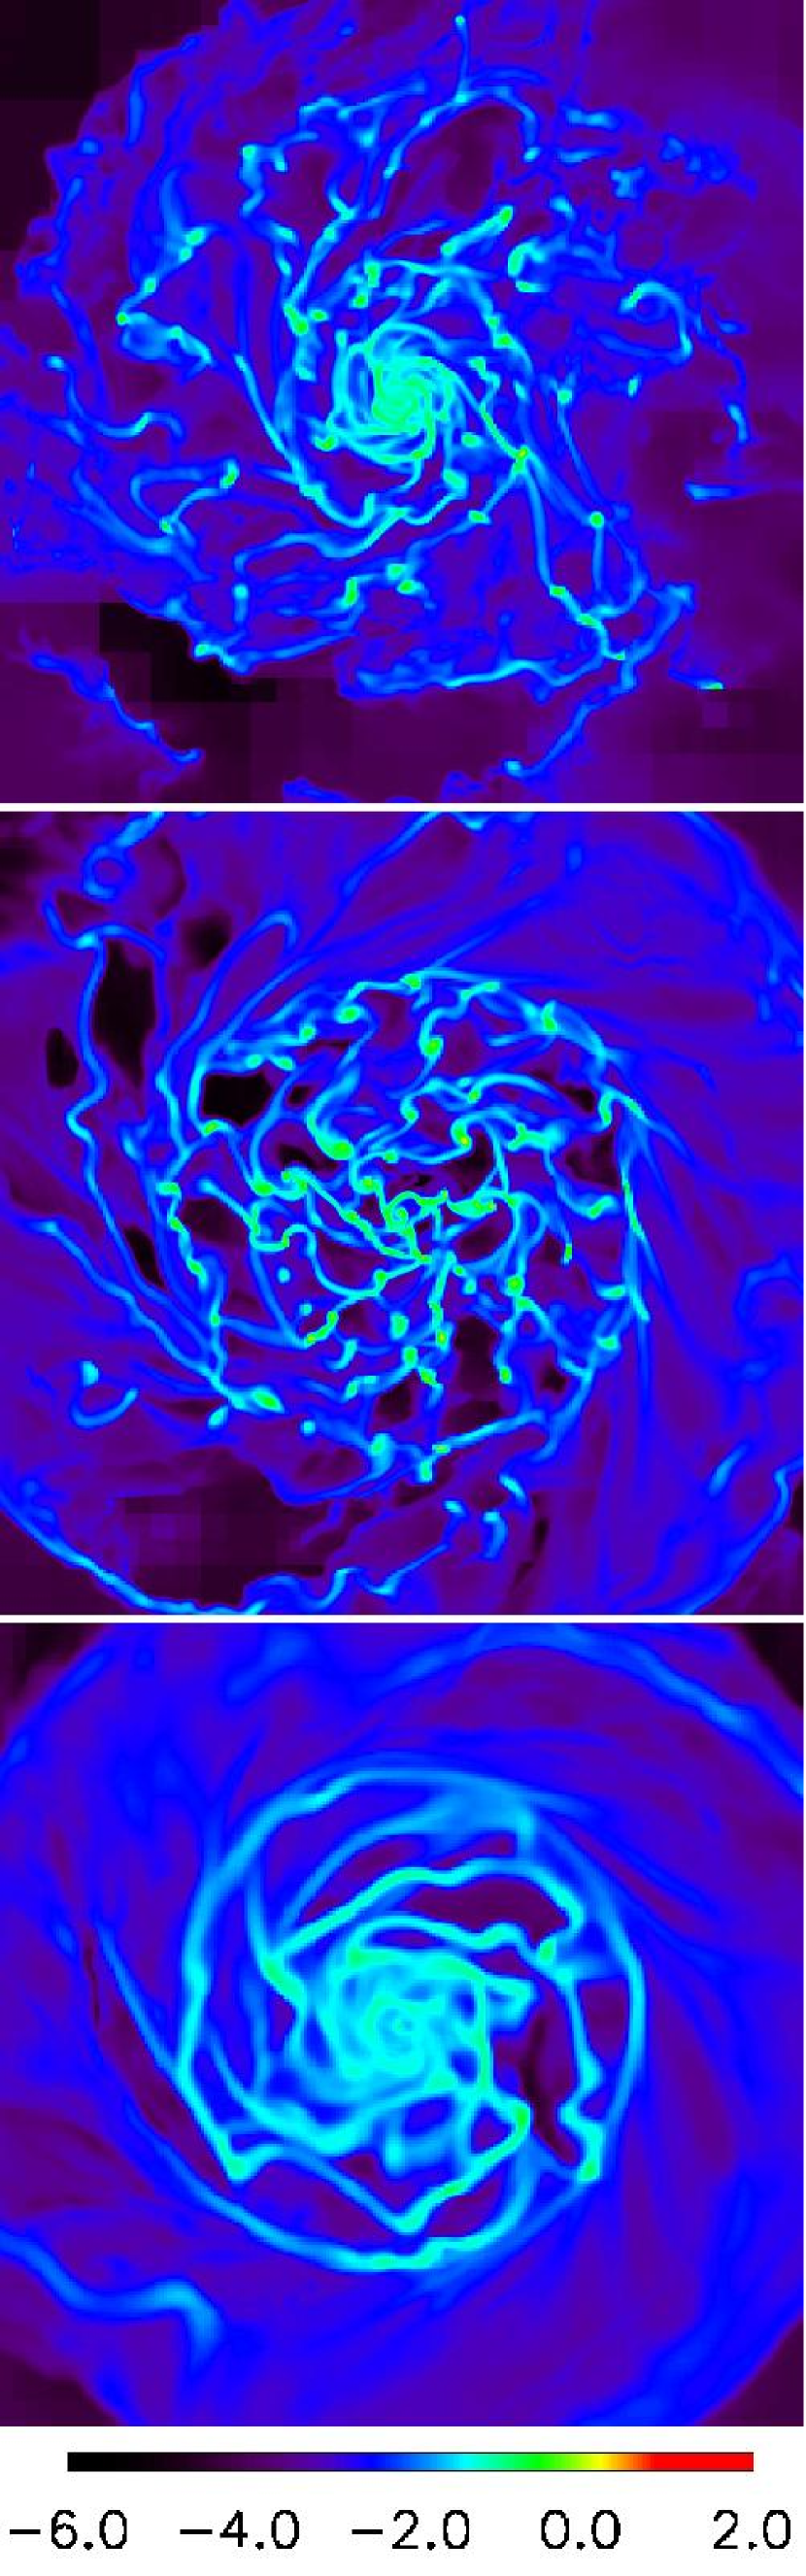
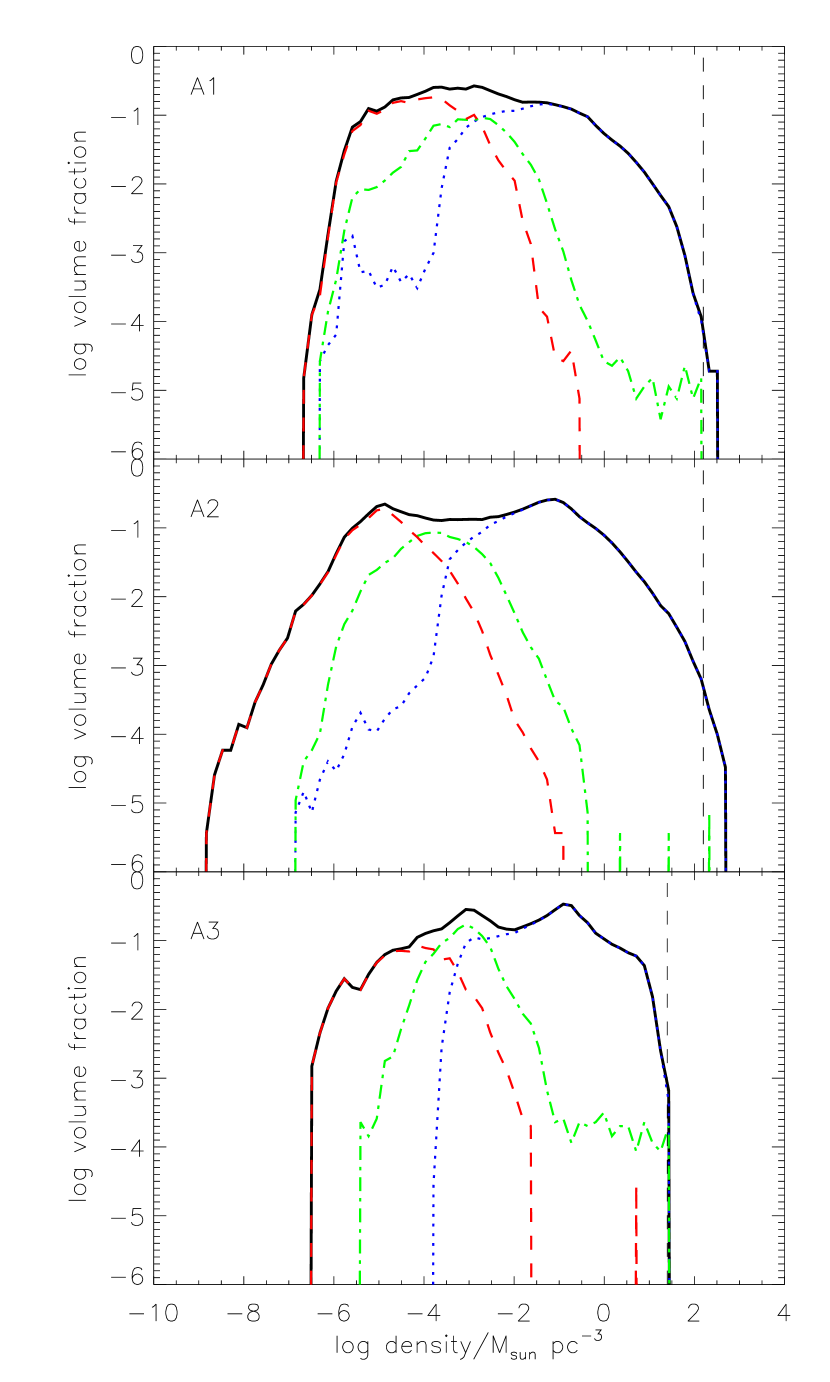
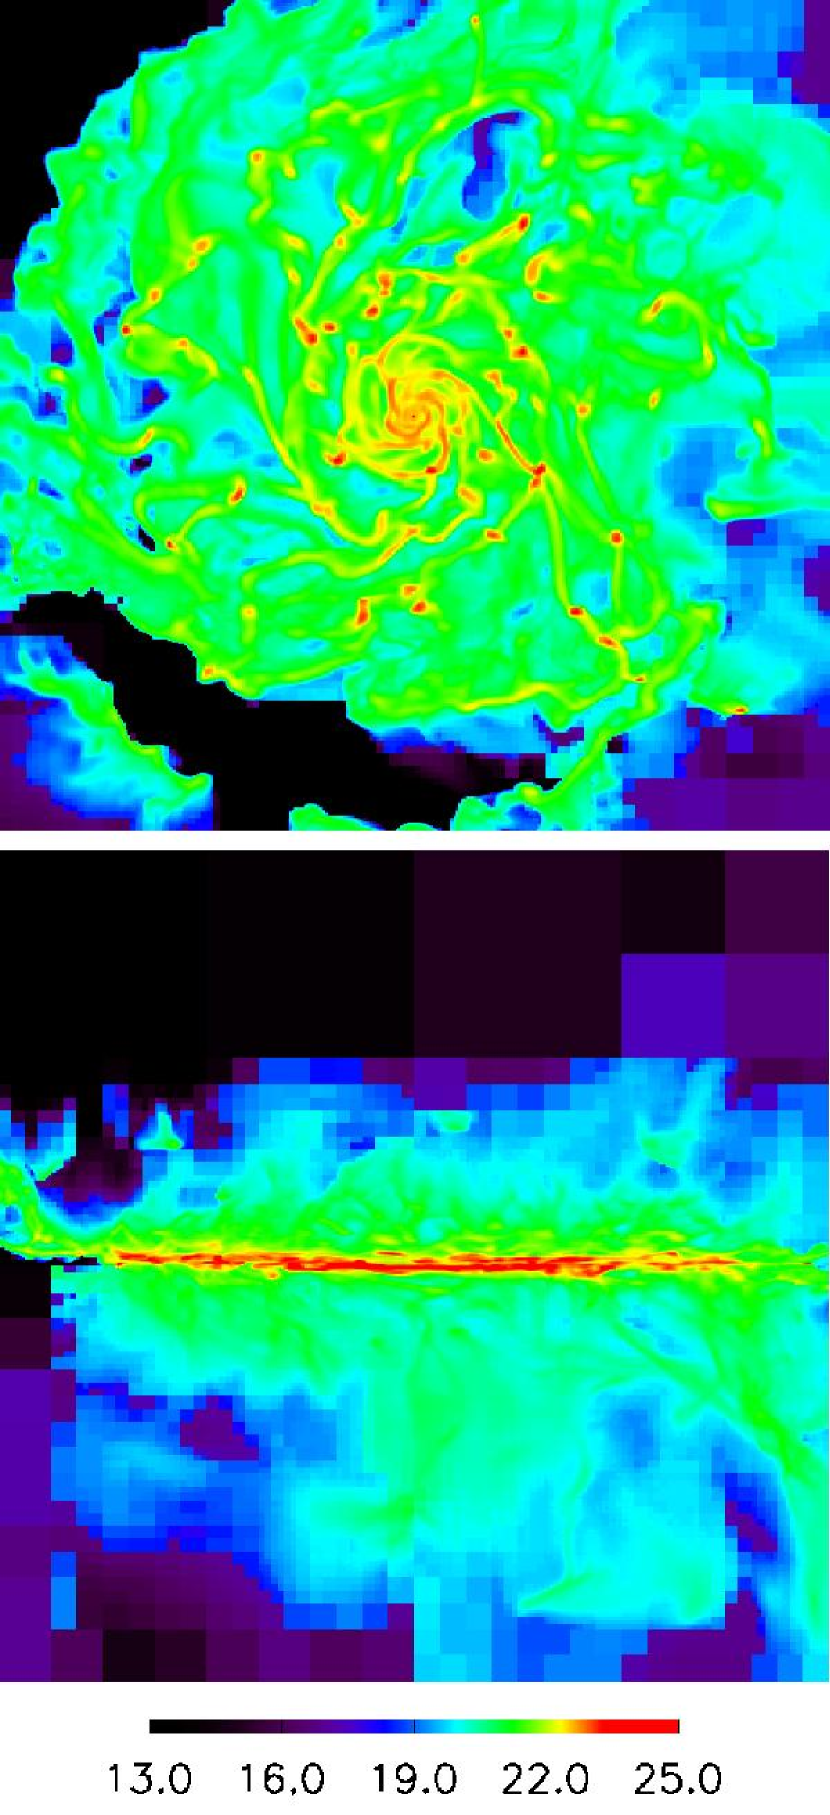
The morphology of the ISM is clearly affected by feedback from SF as can be seen from the surface density maps in Fig. 3 at corresponding to the end of the starburst phase in model A1. By this time in the starburst model a much larger amount of mass and energy have been injected through feedback into the lower-density gas. The result is a much larger role of pressure confinement of cold clouds in model A1, as opposed to more gravitational confinement in the quiescent model. The mass distribution appears to be smoother in the starburst model, with a lower density contrast between the clumps and the voids (Fig. 4). Also evident in model A1 is a more pronounced gas accumulation near the galactic center, and a violent stripping of the outer gas regions of the disk by feedback waves. The latter process depends, of course, on the gas mass of the outer disk which in turn is determined by the cosmic accretion which we do not compute in our current models.
In our high-resolution models dense clouds are continuously being formed and destroyed by self-gravity, differential rotation, feedback from SF inside the clouds, and interaction with feedback waves coming from nearby star-forming regions. Any single cloud usually survives only for a fraction of its galactic orbital revolution, in other words, from few Myrs to few tens of Myrs. This is consistent with many estimates of the giant molecular cloud (GMC) lifetimes in the Milky Way galaxy, although we do not resolve the scales and processes taking place inside these clouds.
3.2. Conditions in simulated SF regions
We are interested in modeling conditions in the star-forming regions that facilitate launching of galactic winds from thermal feedback only, without suppression of cooling. We will here review a set of criteria necessary to model winds and expanding hot bubbles in the ISM. First and foremost, heating by a SN must lead to a sharp rise in the gas temperature that would drive the hot bubble expansion without rapid cooling. In other words, during all stages of bubble expansion heating must dominate over radiative cooling. For the early stages, this condition was elegantly formulated in Ceverino & Klypin (2007) (see their eq. 5); using our SF threshold, we will write it as
| (7) | |||||
where is the spatial density of young stars, and is expected to be in the range . If the gas temperature is around , cooling , and heating from SNe cannot counterbalance cooling in any moderate overdensity. On the other hand, at very low temperatures () cooling is much less efficient (), and even at high star-forming cloud densities feedback may be able to heat the gas. Therefore, Ceverino & Klypin (2007) argue, it is crucial to include cooling to to resolve the cold phase in order to heat up the gas via SN feedback. Once hydrodynamical expansion of the feedback region begins, gas flows out, the mass ratio increases, assisting further heating and expansion.
When a SN injects energy into the ISM, the resulting pressure in the hot bubble greatly exceeds the surrounding pressure. Provided that the energy is not quickly radiated away, the bubble expands only if it is not confined by self-gravity. This second condition was formulated in Ceverino & Klypin (2007) in terms of the pressure difference between the bubble and the surrounding gas
| (8) |
where is the radius of the bubble, and is the ambient gas density. Using the ideal gas equation of state and our SF density threshold, we can rewrite eq. 8 to obtain the minimum resolution necessary to model the expansion of the HII regions against self-gravity
| (9) |
Since our models start to resolve individual SNe, the mass of a resolution element should be small enough in order for it to get heated by the typical explosion energy. A single SN explosion in a dense cloud may have a hydrodynamical impact only if it can heat its host cell to high () temperatures of an expanding hot bubble. In other words, the energy input per SN should then exceed
| (10) |
which gives us an estimate of the minimum resolution necessary to heat up the host cell
| (12) | |||||
At first glance, this constraint requires much higher resolution than the self-gravity condition (eq. 9). Fortunately, type II SN explosions have a delay after the initial starburst, and many of them explode in environments which have been previously cleared by stellar winds and neighbouring SNe. Even more importantly, the lifetimes of individual cold clouds are usually in the range from few Myrs to few tens of Myrs. By the time a stellar particle hosts a SN explosion, its cloud of origin is very likely to have been destroyed, and the SN energy is released into a environment. In addition, stellar particles may have non-negligible intrinsic velocities – traveling even a small velocity for will take a particle away from its birthplace. Therefore, the ISM densities in which type II SN explosions take place are likely to be several orders of magnitude smaller than making the constraint in eq. 12 much less demanding.
Once conversion of feedback energy into hydrodynamical expansion becomes efficient, lack of spatial resolution can present an additional problem. If the density contrast in the ISM is not resolved in the simulation, heating and hydrodynamical stirring of the star-forming clouds might erase high-density peaks bringing the ongoing SF to a halt. In other words, SF/feedback can be too self-regulating at low resolution. Since we do not know a priori the amount of clumping in the ISM at , perhaps the most reliable way to reduce this effect is to compare the SF rates at various resolutions.
3.3. Neutral gas kinematics in quasar absorption lines
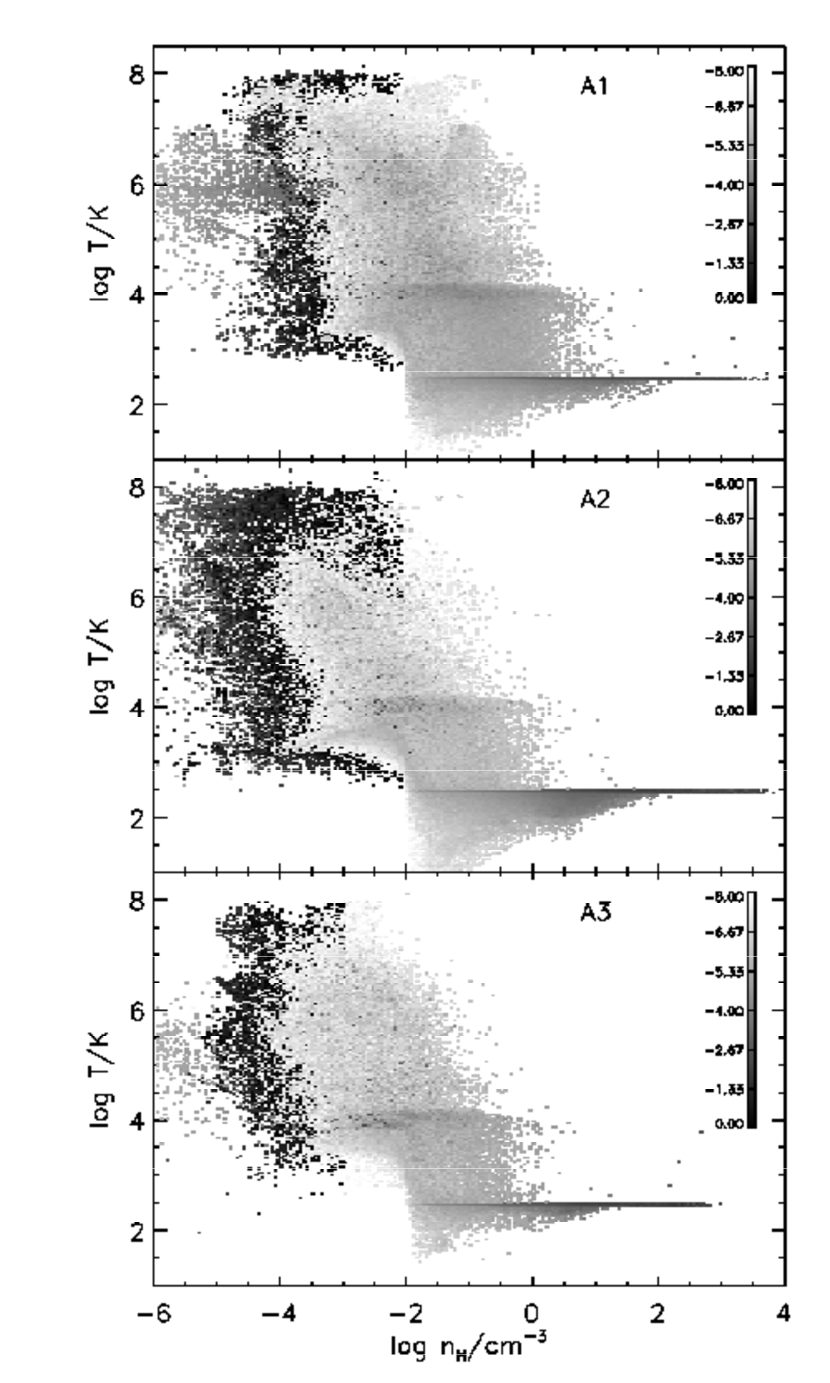
Fig. 5 shows the diagram of the entire simulation volume in all three runs at . In cells hosting stellar particles, stellar winds and SNe return both mass and energy. Assuming that winds remove all ambient gas, the minimum density in such cells can be easily estimated from the mass loss rate of each star particle of mass during its feedback stage
where is the fiducial outflow speed, and is the cell size. These feedback regions can be easily seen in the starburst model in Fig. 5 at , and to a much lesser degree in the quiescent model.
Since we model isolated systems without external accretion, winds from the disk do not experience any ram pressure of the infalling material and can be stopped only by gravity and collision with the gas previously blown off the disk. The wind speeds often exceed several hundred , consequently a large fraction of the volume is quickly filled by a low-density () gas (Fig. 5). Since we model a large () computational volume, the mass fraction locked in this low-density component is significant, especially in the quiescent model A2. In the starburst model A1 the density of the wind is clearly much higher (Fig. 5). Can such dense winds from starburst environments account for the wide absorption line profiles seen in DLAs?
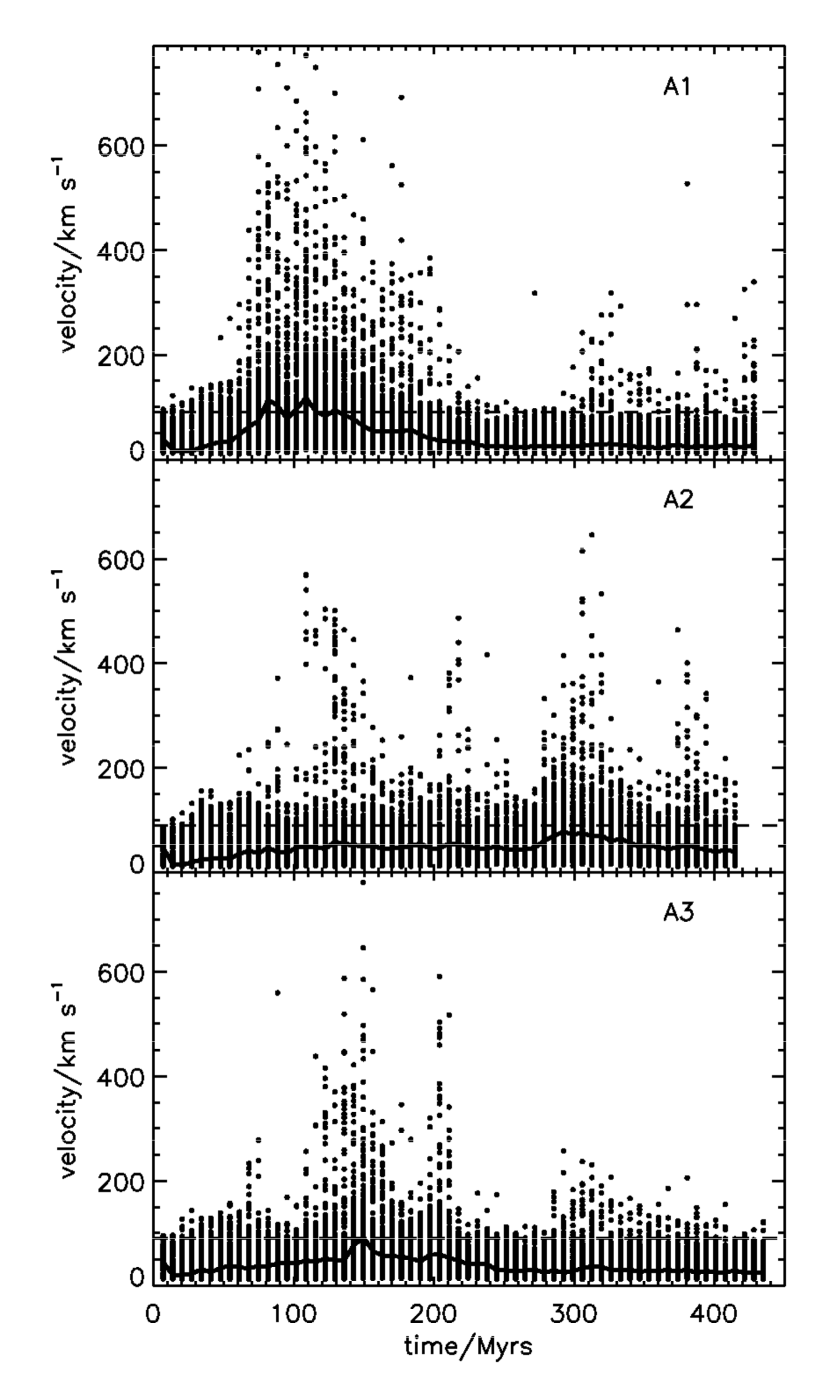
To answer this question, we constructed a set of low-ionization metal line spectra. At each time output, we projected 200 random lines of sight within of the center of each disk and calculated absorption line profiles of an unsaturated low-ion transition along sight-lines with HI column density above . For each such profile we calculated a line width corresponding to of the total optical depth of all components in the line. Note that this diagnostic measures the neutral gas velocity dispersion, not the typical outflow velocities, and is dominated by clouds with large optical depths – its more detailed discussion and the comparison to the equivalent width can be found in Prochaska et al. (2008). Fig. 6 shows the distribution of widths for each model as a function of time, along with the median value. Although these velocities cannot be compared to DLAs statistics directly, since we do not have a cosmological sample and do not account for gas accretion which would regulate SF episodes, we note that the typical absorption velocities are much higher in the starburst model. None of the cosmological DLA models can reproduce the observed median , with the actual value of of order in Razoumov et al. (2007) and close to in (Pontzen et al., 2008). Note that in cosmological models the simulated widths are also sensitive to the DLA cross-sections, as, for instance, the velocity dispersion in “puffy” galaxies with extended radial profiles will have an additional weight.
We argue that if a substantial fraction of clumps along the quasar line of sight in a host halo experience an active starburst, it could result in a much larger velocity dispersion possibly explaining the observed incidence rate of high-velocity DLAs. The fraction of such active star-forming galaxies is poorly constrained and can be only computed from the cosmic gas infall rate onto individual systems in cosmological simulations.
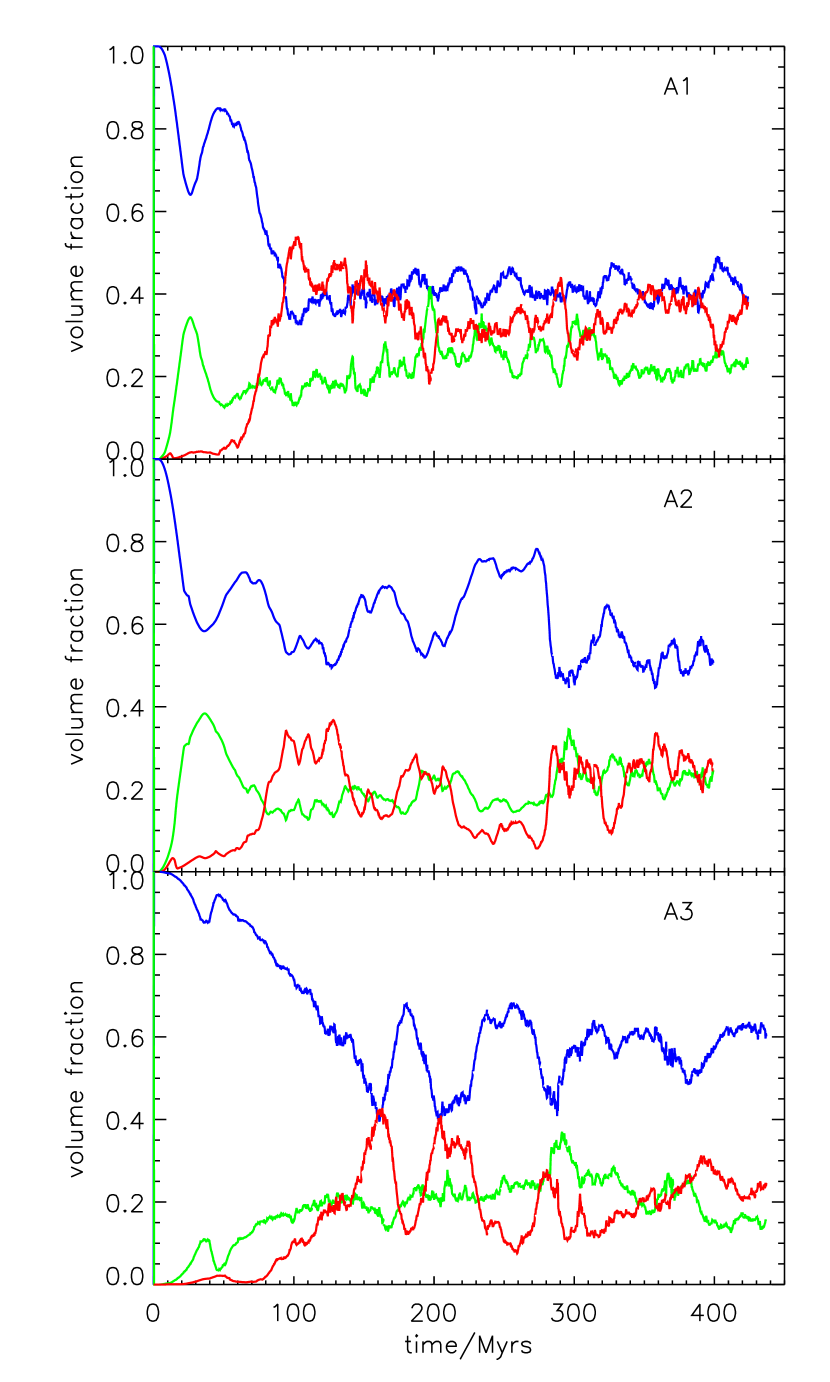
Here instead we focus on individual systems. In the starburst model approximately matches the observed value for , whereas the quiescent model has for most of the disk evolution. The low-resolution model features a delayed and much weaker SF resulting in a brief episode during which reaches the observed value. Fig. 7 shows the time evolution of the volume fractions of cold, warm and hot gas in the plane of the disk. After very rapid cooling the early () evolution is marked by separation of gas into warm and cold components. Shortly thereafter feedback gives rise to the hot component, and subsequent evolution of the disk is characterized by recurrent episodes of gas heating and cooling. The “depth” of these episodes is higher in the low-resolution model, in which relatively low-density cold clumps are more susceptible to feedback. At high resolution the relative change of the volume fraction of cold and hot gas is visibly reduced, as the number of cold star-forming clumps increases, and so does the density in individual clumps. The higher SF rate results in a larger volume filling fraction of the hot gas, at the same time driving more energetic winds from the disk.
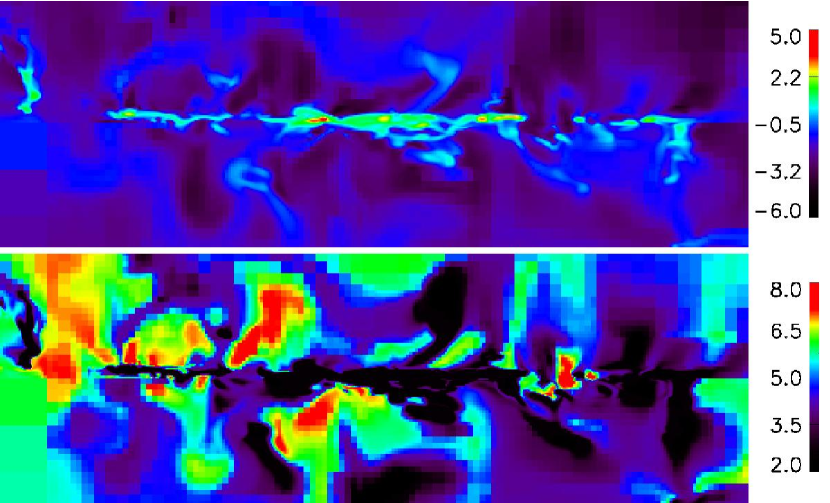
We can see the formation of hot galactic chimneys driving the outflows in the vertical slice in Fig. 8. The visual structure of the outflows is very different from the single-source models of winds from high-redshift dwarf galaxies (e.g., Fujita et al., 2004), more resembling the high-resolution multiphase models of Ceverino & Klypin (2007); Wada (2008). Our current spatial resolution is not yet sufficient to model instabilities in the shells created by hot bubbles (Ferrara & Ricotti, 2006) or even follow these shells farther away from the disk.
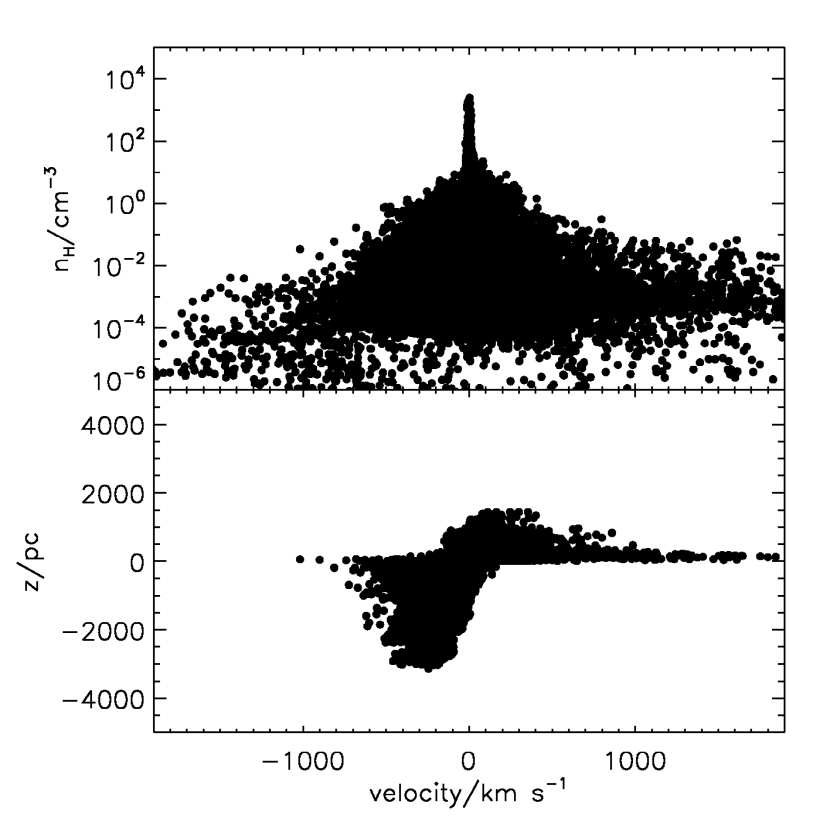
Fig. 9 shows the range of velocities and densities in the wind in the starburst model. Ionized, low-density wind moves with velocities up to several thousand , whereas neutral gas exhibits velocities of few hundred . Cold gas absorption comes from ; there is a clear asymmetry above and below the disk, explained by the fact that feedback starts in a fairly small number of cold clumps. This asymmetry can be also seen in the HI column density maps in Fig. 10. It is important to remember that since our models do not account for interaction of winds and shells with the infalling material, the extent of the HI absorbing regions might change in more realistic models with cosmic infall.
4. Conclusions
We use high-resolution hydrodynamic simulations of isolated protogalactic clumps to show for the first time that the high-end tail of the DLA neutral gas velocity width distribution can be naturally produced if a substantial fraction of clumps in halos experience a starburst event at the rate for a sustained period of few tens of Myrs. Such starbursts would produce a multiphase ISM in which the volume fraction of the hot gas exceeds in the midplane of the clump. Hot bubbles created by feedback expand both in the horizontal direction to fill the interclump material, and vertically to form chimney-like structures which lead to high-velocity winds. Shells and neutral gas fragments embedded in such winds above the disk give rise to neutral gas absorption with the median velocity lasting roughly for the entire duration of the starburst.
Similar to other multiphase disk models, the cold component of the ISM is distributed in a complex network of filamentary structures confined by hot bubbles and voids. Inside these filaments dense clouds form as gravitational instabilities the growth of which is assisted by the external pressure. Once their growth begins, the clouds proceed to form stars very quickly. Only a small fraction of each cloud ( by mass) is converted into stars, as the clouds are being continuously destroyed by stellar winds from inside, interaction with shells pushed by rapidly expanding nearby hot bubbles, and collisions with other clouds. In our simulation clouds are transient objects constantly exchanging mass and energy with the cold shells and filaments, as well as with the hot gas, and rarely surviving as discrete entities for longer than a fraction of the rotational period.
In this paper we chose the typical clump masses and initial conditions representative of protogalactic environments at . We expect similar winds to arise in grid-based cosmological simulations at spatial resolution. Although none of the current cosmological models have such resolution, we argue that using AMR techniques to zoom in only on those protogalactic clumps that have a high gas infall rate will allow to obtain galactic winds from thermal feedback in the cosmological context, without suppressing cooling or using kinetic feedback.
Acknowledgments
I thank Jesper Sommer-Larsen and Eduard Vorobyov for many useful discussions. I am grateful to Marc Schartmann for providing me with the cooling data. Computational facilities for this work were provided by ACEnet, the regional high performance computing consortium for universities in Atlantic Canada. ACEnet is funded by the Canada Foundation for Innovation (CFI), the Atlantic Canada Opportunities Agency (ACOA), and the provinces of Newfoundland & Labrador, Nova Scotia, and New Brunswick. I acknowledge financial support from ACEnet.
References
- Ceverino & Klypin (2007) Ceverino, D. & Klypin, A. 2007, ArXiv e-prints, 712
- Dalla Vecchia & Schaye (2008) Dalla Vecchia, C. & Schaye, J. 2008, ArXiv e-prints, 801
- Ferrara & Ricotti (2006) Ferrara, A. & Ricotti, M. 2006, MNRAS, 373, 571
- Fujita et al. (2004) Fujita, A., Mac Low, M.-M., Ferrara, A., & Meiksin, A. 2004, ApJ, 613, 159
- Haehnelt et al. (1998) Haehnelt, M. G., Steinmetz, M., & Rauch, M. 1998, ApJ, 495, 647
- Joung & Mac Low (2006) Joung, M. K. R. & Mac Low, M.-M. 2006, ApJ, 653, 1266
- Katz (1992) Katz, N. 1992, ApJ, 391, 502
- McDonald & Miralda-Escudé (1999) McDonald, P. & Miralda-Escudé, J. 1999, ApJ, 519, 486
- Mori et al. (1997) Mori, M., Yoshii, Y., Tsujimoto, T., & Nomoto, K. 1997, ApJL, 478, L21+
- Nagamine et al. (2007) Nagamine, K., Wolfe, A. M., Hernquist, L., & Springel, V. 2007, ApJ, 660, 945
- Navarro & White (1993) Navarro, J. F. & White, S. D. M. 1993, MNRAS, 265, 271
- O’Shea et al. (2004) O’Shea, B. W., Bryan, G., Bordner, J., Norman, M. L., Abel, T., Harkness, R., & Kritsuk, A. 2004, ArXiv Astrophysics e-prints
- Pettini et al. (1998) Pettini, M., Kellogg, M., Steidel, C. C., Dickinson, M., Adelberger, K. L., & Giavalisco, M. 1998, ApJ, 508, 539
- Pettini et al. (2001) Pettini, M., Shapley, A. E., Steidel, C. C., Cuby, J.-G., Dickinson, M., Moorwood, A. F. M., Adelberger, K. L., & Giavalisco, M. 2001, ApJ, 554, 981
- Pontzen et al. (2008) Pontzen, A., Governato, F., Pettini, M., Booth, C. M., Stinson, G., Wadsley, J., Brooks, A., Quinn, T., & Haehnelt, M. 2008, ArXiv e-prints, 804
- Prochaska et al. (2008) Prochaska, J. X., Chen, H.-W., Wolfe, A. M., Dessauges-Zavadsky, M., & Bloom, J. S. 2008, ApJ, 672, 59
- Razoumov et al. (2007) Razoumov, A. O., Norman, M. L., Prochaska, J. X., Sommer-Larsen, J., Wolfe, A. M., & Yang, Y.-J. 2007, ArXiv e-prints, 710
- Razoumov et al. (2006) Razoumov, A. O., Norman, M. L., Prochaska, J. X., & Wolfe, A. M. 2006, ApJ, 645, 55
- Saitoh et al. (2008) Saitoh, T. R., Daisaka, H., Kokubo, E., Makino, J., Okamoto, T., Tomisaka, K., Wada, K., & Yoshida, N. 2008, ArXiv e-prints, 802
- Schaye (2001) Schaye, J. 2001, ApJL, 559, L1
- Sommer-Larsen et al. (2003) Sommer-Larsen, J., Götz, M., & Portinari, L. 2003, ApJ, 596, 47
- Springel & Hernquist (2003) Springel, V. & Hernquist, L. 2003, MNRAS, 339, 289
- Stinson et al. (2006) Stinson, G., Seth, A., Katz, N., Wadsley, J., Governato, F., & Quinn, T. 2006, MNRAS, 373, 1074
- Tasker & Bryan (2006) Tasker, E. J. & Bryan, G. L. 2006, ApJ, 641, 878
- Tasker & Bryan (2008) —. 2008, ApJ, 673, 810
- Thacker & Couchman (2000) Thacker, R. J. & Couchman, H. M. P. 2000, ApJ, 545, 728
- Truelove et al. (1997) Truelove, J. K., Klein, R. I., McKee, C. F., Holliman, II, J. H., Howell, L. H., & Greenough, J. A. 1997, ApJ, 489, L179+
- Wada (2008) Wada, K. 2008, ApJ, 675, 188
- Wada & Norman (2001) Wada, K. & Norman, C. A. 2001, ApJ, 547, 172
- Yepes et al. (1997) Yepes, G., Kates, R., Khokhlov, A., & Klypin, A. 1997, MNRAS, 284, 235