Ubiquitous Water Masers in Nearby Star-Forming Galaxies
Abstract
We report the detection of water maser emission from four nearby galaxies hosting ultradense H ii (UDHII) regions, He 2-10, the Antennae galaxies (NGC 4038/4039), NGC 4214, and NGC 5253, with the Green Bank Telescope. Our detection rate is 100%, and all of these H2O “kilomasers” ( L⊙) are located toward regions of known star formation as traced by UDHII regions and bright 24 m emission. Some of the newly discovered H2O masers have luminosities 1–2 orders of magnitude less than previous extragalactic studies and the same order of magnitude as those typical of Galactic massive star-forming regions. The unusual success of this minisurvey suggests that H2O maser emission may be very common in starburst galaxies, and the paucity of detections to date is due to a lack of sufficient sensitivity. While the galaxy sample was selected by the presence of UDHII regions, and the UDHII regions lie within the telescope beam, in the absence of H2O spectral line maps the connection between H2O masers and UDHII regions has not yet been demonstrated.
Subject headings:
galaxies: interactions — galaxies: ISM — galaxies: star clusters — galaxies: starburst — masers — radio lines: galaxies1. Introduction
Extreme star-forming environments known as “ultradense H ii regions” (UDHIIs) have been discovered in a number of starburst galaxies (e.g., Kobulnicky & Johnson, 1999; Turner et al., 2000; Tarchi et al., 2000; Johnson et al., 2004; Reines et al., 2008). UDHIIs are identified through their thermal mid-IR to radio emission (often being too deeply embedded in their birth material to observe at optical wavelengths). Similarly, dense radio H ii regions are known to exist on a much smaller scale around individual massive stars in the Galaxy (i.e., ultracompact H ii regions [UCHIIs]; Wood & Churchwell 1989). However, UDHIIs are vastly scaled up from individual UCHIIs, and they can contain the equivalent of a thousand or more embedded O-type stars.
Given the tremendous number and density of young massive stars in UDHIIs, it is logical to ask whether typical signposts of Galactic massive star formation are associated with these objects. Churchwell et al. (1990) found that % of Galactic UCHIIs are associated with H2O (22.235 GHz) masers. Subsequent interferometric follow-up showed that while some H2O masers are coincident with the UCHII regions themselves, many are instead associated with younger members of the forming massive protocluster of which the UCHII is a member (e.g., Tofani et al., 1995; Hofner & Churchwell, 1996). These studies imply that the conditions required for H2O masers ( cm-3 and K) are fairly persistent during the early stages of massive star cluster evolution. If extragalactic UDHIIs are composed of thousands of UCHIIs, then it is reasonable to expect H2O masers to be associated with a large fraction of the embedded massive stars in these giant clusters.
The term “kilomasers” has been coined to describe extragalactic 22 GHz H2O masers with luminosities comparable to the brightest Galactic star formation-associated H2O masers (e.g., W49N; L⊙). The luminosities of H2O kilomasers ( L⊙) are much lower than the more widely studied “megamasers,” which are associated with the nuclear regions of AGN (i.e., NGC 4258) and have been observed with luminosities up to 104 L⊙ (Barvainis & Antonucci, 2005). H2O kilomasers have been associated with both AGN and star formation activity; this luminosity regime includes the tails (high and low) of both maser populations. Although H2O kilomasers can be used to help pinpoint sites of active star formation, there have been few searches with the sensitivity necessary to detect these faint masers at extragalactic distances. To date six H2O kilomasers have been unambiguously associated with regions of known star formation in the LMC, M82, IC 342, IC 10, M33 [IC 133], and NGC 2146 (Whiteoak & Gardner, 1986; Tarchi et al., 2002a, b; Henkel et al., 2005; Castangia et al., 2008, and references therein). The six remaining known H2O kilomasers either are associated with AGN activity or have ambiguous provenance. For example, the H2O masers in NGC 253 appear to be associated with a nuclear outflow (Hofner et al., 2006) and not current star formation.
We have carried out a Green Bank Telescope111The National Radio Astronomy Observatory is a facility of the National Science Foundation operated under cooperative agreement by Associated Universities, Inc. (GBT) search for kilomasers toward four nearby starburst galaxies ( Mpc), known to host UDHIIs, down to a sensitivity level consistent with strong Galactic UCHII region H2O masers. Positive detections were found for all four galaxies as described in detail below. The unusual success of this minisurvey is due to the fact that our observations are more than an order of magnitude more sensitive than the majority of previous single dish surveys for either kilomasers or megamasers. This result suggests that H2O maser emission may be very common in starburst galaxies.
2. Observations and Data Reduction
| Galaxy | Other Name | Pointing Center | rms | Observing | UT Date | |||||
|---|---|---|---|---|---|---|---|---|---|---|
| (J2000) | (J2000) | (Jy) | (Mpc) | (h) | (km s-1) | (mJy) | Mode | |||
| He 2-10 | 08 36 15.3 | 26 24 30 | 26.4 | 10.5(0.7)aaFor He 2-10 we adopt an H i velocity-based Hubble flow distance that accounts for local peculiar velocities (Mould et al., 2000) and km s-1 Mpc-1. | 2.2 | 3.3 | 1.2 | Nod | 2004 May 3, 4 | |
| Antennae | NGC 4038/4039 | 12 01 55.0 | 18 52 58 | 76.0 | 20.0(1.4)bb The Antennae distance is controversial; we adopt the conventional value of 19.2 Mpc (Whitmore et al., 2005) updated to km s-1 Mpc-1. | 2.1 | 2.0 | 0.9 | OffOn | 2004 May 4, 6 |
| NGC 4214 | UGC 7278 | 12 15 39.2 | +36 19 40 | 25.5 | 2.94(0.18)ccThe NGC 4214 distance is from the RG branch method (Maíz-Apellániz et al., 2002). | 1.1 | 2.0 | 1.3 | OnOff | 2004 May 3 |
| NGC 5253 | Haro 10 | 13 39 55.8 | 31 38 20 | 29.8 | 3.33(0.17)ddThe NGC 5253 distance is from Cepheids (Gibson et al., 2000), and the uncertainty is statistical only (other recent NGC 5253 Cepheid distances range from 3.0 to 4.1 Mpc). | 2.9 | 0.66 | 2.4 | Nod | 2004 May 3, 4 |
Note. — Units of right ascension are hours, minutes, and seconds, and units of declination are degrees, arcminutes, and arcseconds. The 100 m flux densities come from the IRAS Point Source Catalog. indicates the total on-source integration time and is the velocity resolution of spectra plotted in Fig. 1.
We observed the 22.23508 GHz ortho-water maser line in He 2-10, the Antennae (NGC 4038/4039), NGC 4214, and NGC 5253 with the GBT on 2004 May 3–6 (Table 1). Two 25 MHz offset IFs were observed simultaneously with 200 MHz bandpasses in two polarizations and 12.2 or 24.4 kHz wide channels. A winking calibration diode and hourly atmospheric opacities were used for flux density calibration. Opacities ranged from 0.05 to 0.15 nepers but were typically below 0.10. The estimated uncertainty in the flux density calibration is 10–15. We used the 33″ (FWHM) dual-beam K-band feed in a nodding mode for the compact galaxies (He 2-10 and NGC 5253) and a position-switched mode for the larger galaxies (the Antennae and NGC 4214). Bandpasses were Hanning smoothed to 48.8 kHz channels for a rest-frame velocity resolution of 0.66 km s-1 and Gaussian smoothed to the resolution listed in Table 1 to produce the final spectra shown in Figure 1.
For all observations, records were individually calibrated and bandpasses flattened using the calibration diode and the corresponding off-source records, respectively. Scans and polarizations were subsequently averaged, and a fifth-order polynomial baseline was fitted and subtracted. The bandpasses were rarely contaminated by radio frequency interference (RFI) but were carefully inspected and flagged. Baselines were often not flat, but the atmospheric features in the bandpass were much broader than any possible maser lines. All spectra were carefully inspected by polarization, IF, and time subsets to confirm the validity of the detected lines. All data reduction was performed in GBTIDL, and all velocities are given in the heliocentric frame.
3. Results
We have detected water maser emission in all four galaxies observed. Measured line properties are listed in Table 2, and further information for each galaxy is presented below. In all cases, given the complex velocity structure of the galaxies in this sample (likely due to the combined effect of large and small mergers and outflows), we might expect to find a correspondingly complex velocity structure connected to the maser emission. The precise association of the maser emission with specific regions and environments in these galaxies will only be possible with future high-resolution emission maps.

He 2-10: Kobulnicky & Johnson (1999) identified five distinct UDHII regions within the blue compact dwarf (BCD) galaxy He 2-10, which is located at a distance of 10.5 Mpc. He 2-10 has roughly solar metallicity (12+log(O/H)=8.93; Vacca & Conti, 1992) implying that molecules may be relatively abundant. The He 2-10 UDHII regions are associated with bright 24 m emission, and the main body of the BCD fits completely within the GBT beam as shown in Figure 2a, so at the current resolution it is not possible to pinpoint where the H2O emission originates. The velocity extent of CO(1–0) emission in He 2-10 observed with OVRO is 800–940 km s-1 (Kobulnicky et al., 1995). Mohan et al. (2001) find a H92 line velocity peak of km s-1, with a broad blue wing, and Henry et al. (2007) find narrow Brackett line features in the range –900 km s-1. The maser velocity presented here of 887 km s-1 is roughly consistent with all of these studies.
The Antennae: At an adopted distance of 20 Mpc,222 Recent work by Saviane et al. (2004, 2008) suggests that the Antennae distance may be as close as 13.3 Mpc. the interacting galaxy pair known as the Antennae (NGC 4038/NGC 4039) is the most distant source in our survey. As shown in Figure 2b, the single GBT pointing ( beam) was centered on a 24 m-bright region of copious star formation within the “interaction region” (IAR), offset from both interacting galaxies’ nuclei. This region is also coincident with several CO-identified “supergiant molecular complexes” (SGMCs; Wilson et al., 2000) and UDHII regions identified by VLA cm wavelength emission (Neff & Ulvestad, 2000). The broad component of maser emission that peaks at 1515 km s-1 is consistent with velocities measured from ionized gas studies, such as Gilbert & Graham (2007), as well as that of CO toward the IAR (1350–1700 km s-1; see, e.g., Wilson et al., 2000; Schulz et al., 2007). However, the second maser component at 1670 km s-1 is on the high end of the CO gas velocities observed within the IAR, and may instead be associated with a “bridge” of CO at 1650–1700 km s-1 that appears to link the IAR to the NGC 4039 nucleus in the channel maps of Schulz et al. (2007). Emission from the NGC 4039 nuclear region itself is unlikely because it lies near the first null of the GBT’s beam; thus, Antennae feature 2 is unlikely to be associated with nuclear activity.
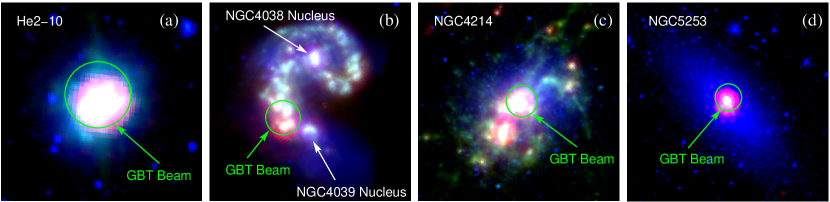
NGC 4214: NGC 4214 is a BCD at a distance of 2.9 Mpc with a subsolar metallicity (12+log(O/H)=8.28; Kobulnicky & Skillman, 1996). As shown in Figure 2c, H2O maser emission is detected toward a region of bright 24 m emission near the center of the galaxy. The 24 m and H2O emission are also coincident with several unresolved thermal radio sources identified by Beck et al. (2000). Using OVRO, Walter et al. (2001) found that the CO(1–0) emission in this galaxy is concentrated into three main regions, the centralmost of which is coincident with the GBT pointing and the bright 24 m emission. This CO emission has a peak Vhel(CO)= 291.4 km s-1 and a velocity extent of 287–308 km s-1, in good agreement with Vhel(H2O) = 301.6 km s-1.
NGC 5253: NGC 5253 is a dwarf starburst galaxy at a distance of 3.3 Mpc with subsolar metallicity (12+log(O/H)=8.23; Martin, 1997). Using OVRO, Meier et al. (2002) found that the CO(2–1) emission is concentrated toward the optically dark dust lane with a velocity range of 350–450 km s-1. The GBT beam was centered on the UDHII region discovered by Turner et al. (2000), and a region of bright 24 m emission (see Fig. 2d). This region is also coincident with the weak CO(2–1) molecular cloud ”D” with Vhel(CO)= 394 km s-1 and =15 km s-1 (Meier et al., 2002). However, the GBT beam also encompasses parts of CO cloud ”C” (Vhel=418 km s-1) to the southeast and cloud ”A” (Vhel=363 km s-1) to the east. Thus, the H2O maser emission at 366 and 375 km s-1 is significantly blueward of the CO gas toward the UDHII region and most closely agrees with the velocity of cloud ”A.” Using the radio recombinations lines H53 and H92 Mohan et al. (2001) and Rodríguez-Rico et al. (2007) measure peak velocities of km s-1, both with broad wings. These velocities are somewhat higher than, but consistent with, the maser velocities. Given that the ionized gas in NGC 5253 is known to have a sinusoidal velocity structure (López-Sánchez et al., 2007) with an amplitude of km s-1, it is not surprising that we see maser lines with velocity separations within this range.
| Galaxy | Line | ||||||
|---|---|---|---|---|---|---|---|
| (km s-1) | (km s-1) | (mJy) | (km s-1) | (mJy km s-1) | () | ||
| He 2-10 | 1 | 887(6) | 800–940 | 2.4(0.3) | 115(14) | 267(10) | 0.68(9) |
| Antennae | 1 | 1514.7(4) | 12.4(0.9) | 24(2) | 704(10) | ||
| 2 | 1670.4(2) | 14.5(0.9) | 7(1) | 172(4) | |||
| Sum | 1350–1700 | 892(12) | 8.2(1.1) | ||||
| NGC 4214 | 1 | 301.6(8) | 287–308 | 6.7(0.6) | 21(2) | 141(6) | 0.028(4) |
| NGC 5253 | 1 | 366.0(1) | 18.1(2.6) | 1.2(0.2) | 29(8) | ||
| 2 | 375.1(2) | 13.2(1.6) | 3.3(0.5) | 47(9) | |||
| Sum | 350–450 | 83(13) | 0.021(4) |
Note. — The line properties were determined from Gaussian fits, with the exception of the Antennae, which were obtained directly from the data because the line profiles are non-Gaussian. The peak channel in the He 2-10 spectrum is 4.5 alone; the gaussian-fit peak is 8 . Isotropic line luminosities were computed from , where is in Mpc and is in Jy km s-1 (Henkel et al., 2005). is the range of CO line velocities previously observed within the GBT beam; references are provided in § 3.
4. Discussion
Could the strong Galactic H2O maser source W49N be detected in our sample galaxies? Using a fiducial distance of 11.4 kpc and a 10 kJy peak flux density (see e.g., Liljestrom et al., 1989), W49N is marginally detectable in the Antennae (3 mJy) but easily detectable in the other sample galaxies (12–150 mJy). By luminosity ( ), W49N should be detectable in NGC 4214 and NGC 5253 and possibly in He 2-10, but not in the Antennae. It is remarkable that we can now detect sub-W49N H2O masers in external galaxies, which means that extragalactic H2O kilomaser observations may now be interpretable in a Galactic star formation context.
Two of our new H2O maser detections are extremely low luminosity; there is only one other system known with a total , and this was a brief flaring episode in IC 342 (Tarchi et al., 2002a; Henkel et al., 2005). The detection of deci-W49N emission in a larger sample of galaxies similar to NGC 4214 and NGC 5253 will provide a measurement of the H2O luminosity function at least an order of magnitude below current limits on (Henkel et al., 2005) and will genuinely explore the link between H2O masers and star formation in galaxies as a function of environment, metallicity, and age.
Our minisurvey sample has a 100% detection rate, and expands by 2/3 the sample of known H2O kilomaser galaxies associated with star formation. The GBT beam excludes the nuclei in the Antennae, so the association of H2O maser emission with star formation is likely in this galaxy merger. Moreover, the three dwarf galaxies in our sample show no evidence of AGN activity. Both He 2-10 and NGC 5253 have been observed with the very long baseline interferometry (VLBI) High-Sensitivity Array (HSA) by Ulvestad et al. (2007), and neither has pointlike radio sources down to a detection level of Jy, consistent with no AGN activity. The mid-infrared spectrum of NGC 4214 was studied by Satyapal et al. (2008), and they find no evidence of high-ionization lines that would be suggestive of an AGN. Indeed, given the association between the presence of AGN and host galaxy bulge mass (e.g., Kauffman et al., 2003), it would be surprising if any of these three dwarf galaxies harbored an AGN. Without H2O spectral line maps, however, the connection between H2O and UDHII regions has not yet been demonstrated.
All four detected masers lie dex below the relationship obtained for Galactic H2O masers by Felli et al. (1992). That is, these masers are “subluminous” in the H2O line given their host galaxies’ far-IR luminosities. They are, however, in good agreement with the relationship for H2O kilomasers obtained by Castangia et al. (2008). The origin of this difference between kilomasers and Galactic masers is unknown, but is likely due to spatially unresolved far-IR (IRAS) observations of galaxies that include IR emission unrelated to the sites of maser emission (Galactic sites of star formation were much better resolved). The difference between the H2O-FIR relation of kilomasers and Galactic masers may thus not be physical at all (unlike H2O megamasers, which represent a substantially different physical process from Galactic and kilomasers).
5. Conclusions
We have identified H2O masers in four galaxies hosting ultradense H ii regions. The high detection rate and the low luminosity of the H2O lines in our minisurvey indicate that previous water maser surveys of nearby IR-bright galaxies lacked the sensitivity to detect most H2O kilomasers associated with bursts of star formation. We suggest that sensitive future surveys will produce a wealth of new H2O maser detections, enabling detailed studies of intense star formation in other galaxies. Future interferometric imaging of the maser lines detected with the GBT are needed to conclusively determine whether the the maser emission is connected to massive star formation in these galaxies. Indeed, although each of the GBT-detected masers are likely composed of numerous individual maser spots, if any of them remains relatively bright at very high spatial resolution (rather than segregating into many weak spots), it may be possible to carry out VLBI astrometry in the future as has been recently done for several Local Group galaxies hosting H2O masers (Brunthaler et al., 2007).
References
- Barvainis & Antonucci (2005) Barvainis, R., & Antonucci, R. 2005, ApJ, 628, L89
- Beck et al. (2000) Beck, S. C., Turner, J. L., & Kovo, O. 2000, AJ, 120, 244
- Brunthaler et al. (2007) Brunthaler, A., Reid, M. J., Falcke, H., Henkel, C., & Menten, K. M. 2007, A&A, 4 62, 101
- Castangia et al. (2008) Castangia, P., Tarchi, A., Henkel, C., & Menten, K. M. 2008, A&A, 479, 111
- Churchwell et al. (1990) Churchwell, E., Walmsley, C. M., & Cesaroni, R. 1990, A&A, 83, 119
- Felli et al. (1992) Felli, M., Palagi, F., & Tofani, G. 1992, A&A, 255, 293
- Gibson et al. (2000) Gibson, B. K., et al. 2000, ApJ, 529, 723
- Gilbert & Graham (2007) Gilbert, A. M. & Graham, J. R. 2007, ApJ, 668, 168
- Henkel et al. (2005) Henkel, C., Peck, A. B., Tarchi, A., Nagar, N. M., Braatz, J. A., Castangia, P., & Moscadelli, L. 2005, A&A, 436, 75
- Henry et al. (2007) Henry, A. L., Turner, J. L., Beck, S. C., Crosthwaite, L. P., & Meier, D. S. 2007, AJ, 133, 757
- Hofner & Churchwell (1996) Hofner, P., & Churchwell, E. 1996, A&A, 120, 283
- Hofner et al. (2006) Hofner, P., Baan, W. A., & Takano, E. 2006, AJ, 131, 2074
- Johnson et al. (2004) Johnson, K. E., Indebetouw, R., Watson, C., & Kobulnicky, H. A. 2004, AJ, 128, 610
- Kauffman et al. (2003) Kauffmann, G. et al. 2003, MNRAS, 346, 1055
- Kobulnicky et al. (1995) Kobulnicky, H. A., Dickey, J. M., Sargent, A. I., Hogg, D. E., & Conti, P. S. 1995, AJ, 110, 116
- Kobulnicky & Johnson (1999) Kobulnicky, H. A. & Johnson, K. E. 1999, ApJ, 527, 154
- Kobulnicky & Skillman (1996) Kobulnicky, H. A., & Skillman, E. D. 1996, ApJ, 471, 211
- Liljestrom et al. (1989) Liljestrom, T., Mattila, K., Toriseva, M., & Anttila, R. 1989, A&A, 79, L19
- López-Sánchez et al. (2007) López-Sánchez, Á. R., Esteban, C., García-Rojas, J., Peimbert, M., & Rodríguez, M. 2007, ApJ, 656, 168
- Maíz-Apellániz et al. (2002) Maíz-Apellániz, J., Cieza, L., & MacKenty, J. W. 2002, AJ, 123, 1307
- Martin (1997) Martin, C. L. 1997, ApJ, 491, 561
- Meier et al. (2002) Meier, D. S., Turner, J. L., & Beck, S. C. 2002, AJ, 124, 877
- Mohan et al. (2001) Mohan, N. R., Anantharamaiah, K. R., & Goss, W. M. 2001, ApJ, 557, 659
- Mould et al. (2000) Mould, J. R. et al. 2000, ApJ, 529, 786
- Neff & Ulvestad (2000) Neff, S. G. & Ulvestad, J. S. 2000, AJ, 120, 670
- Reines et al. (2008) Reines, A. E., Johnson, K. E., & Goss, W. M. 2008, AJ, 135, 2222
- Rodríguez-Rico et al. (2007) Rodríguez-Rico, C. A., Goss, W. M., Turner, J. L., & Gómez, Y. 2007, ApJ, 670, 295
- Satyapal et al. (2008) Satyapal, S., Vega, D., Dudik, R. P., Abel, N. P., & Heckman, T. 2008, ApJ, 677, 926
- Saviane et al. (2004) Saviane, I., Hibbard, J. E., & Rich, R. M. 2004, AJ, 127, 660
- Saviane et al. (2008) Saviane, I., Momany, Y., da Costa, G. S., Rich, R. M., Hibbard, J. E. 2008, ApJ, 678, 179
- Schulz et al. (2007) Schulz, A., Henkel, C., Muders, D., Mao, R. Q., Röllig, M., & Mauersberger, R. 2007, A&A, 466, 467
- Tarchi et al. (2000) Tarchi, A., Neininger, N., Greve, A., Klein, U., Garrington, S. T., Muxlow, T. W. B., Pedlar, A., & Glendenning, B. E. 2000, A&A, 358, 95
- Tarchi et al. (2002a) Tarchi, A., Henkel, C., Peck, A. B., & Menten, K. M. 2002a, A&A, 385, 1049
- Tarchi et al. (2002b) Tarchi, A., Henkel, C., Peck, A. B., & Menten, K. M. 2002b, A&A, 389, L39
- Tofani et al. (1995) Tofani, G., Felli, M., Taylor, G. B., & Hunter, T. R. 1995, A&A, 112, 299
- Turner et al. (2000) Turner, J. L., Beck, S. C., & Ho, P. T. P. 2000, ApJ, 532, L109
- Ulvestad et al. (2007) Ulvestad, J. S., Johnson, K. E., & Neff, S. G. 2007, AJ, 133, 1868
- Vacca & Conti (1992) Vacca, W. D., & Conti, P. S. 1992, ApJ, 401, 543
- Walter et al. (2001) Walter, F., Taylor, C. L., Hüttemeister, S., Scoville, N., & McIntyre, V. 2001, AJ, 121, 727
- Whiteoak & Gardner (1986) Whiteoak, J. B. & Gardner, F. F. 1986, MNRAS, 222, 513
- Whitmore et al. (2005) Whitmore, B. C., Gilmore, D., Leitherer, C., Fall, S. M., Chandar, R., Blair, W. P., Schweizer, F., Zhang, Q., & Miller, B. W. 2005, AJ, 130, 2104
- Wilson et al. (2000) Wilson, C. D., Scoville, N., Madden, S. C., & Charmandaris, V. 2000, ApJ, 542, 120
- Wood & Churchwell (1989) Wood, D. O. S. & Churchwell, E. 1989, ApJ, 340, 265