Galaxy populations in the Antlia cluster. II. Compact elliptical galaxy candidates ††thanks: Based on observations carried out at the Cerro Tololo Inter–American Observatory (Chile), at Las Campanas Observatory (Chile), and at the European Southern Observatory, Paranal (Chile) (Program 71.B-0122(A)). Also based on observations made with the NASA/ESA Hubble Space Telescope, obtained from the data archive at the Space Telescope Institute. STScI is operated by the association of Universities for Research in Astronomy, Inc. under the NASA contract NAS 5-26555.
Abstract
Continuing our study of galaxy populations in the Antlia cluster, we present a photometric analysis of four galaxies classified as compact elliptical (cE) galaxies in the Ferguson & Sandage (1990, hereafter FS90) Antlia Group catalogue. Only 6 members of this rare type of galaxies are known until now. Using data in various photometric systems (Washington , Kron-Cousins , Bessel and , HST and ), we measured brightness and colour profiles, as well as structural parameters. By comparing them with those of other galaxies in the Antlia cluster, as well as with confirmed cE galaxies from the literature, we found that two of the FS90 cE candidates, albeit being spectroscopically confirmed Antlia members, are not cE galaxies. However, one of these objects presents strong ellipticity and position angle variations that resemble those already reported for M32, leading us to speculate about this kind of objects being progenitors of cE galaxies. The other two FS90 cE candidates, for which radial velocities are not available, match some features typical of cE galaxies like being close in projection to a larger galaxy, displaying flat colour profiles, and having a high degree of compactness. Only one of the remaining cE candidates shows a high central surface brightness, two components in its brightness profile, distinct changes in ellipticity and position angle where the outer component begins to dominate, and seems to follow the same trend as other confirmed cE galaxies in a luminosity versus mean effective surface brightness diagram. Moreover, it shows a distorted inner structure with similar characteristics to those found by simulations of interacting galaxies, and an extremely faint structure that seems to link this object with one of the Antlia dominant galaxies, has been detected in MOSAIC-CTIO, FORS1-VLT, and ACS-HST images. The cE nature of this galaxy as well as the possible interaction with its bright companion, still have to be confirmed through spectroscopy.
keywords:
galaxies: clusters: general – galaxies: clusters: individual: Antlia – galaxies: elliptical and lenticular – galaxies: dwarf – galaxies: photometry – galaxies: peculiar1 Introduction
Early-type dwarf galaxies are the most frequent galaxy type in nearby groups and clusters of galaxies (e.g. Ferguson & Sandage 1990). Although the information related with their evolution in such environments is codified in their spatial distribution, chemical composition and kinematics, a single scenario including all their properties in a consistent frame is still missing. The main difficulty resides in the fact that they do not constitute a homogeneous class of objects. Among them, there are nucleated and non-nucleated galaxies, as well as systems that were found to harbour discs and spiral structure (Jerjen, Kalnajs & Binggeli 2000; Cellone & Buzzoni 2005; Lisker, Grebel & Binggeli 2006b). Moreover, central star formation has also been reported in some objects (Lisker et al. 2006a).
The so called compact elliptical (cE, e.g. Nieto & Prugniel 1987), compact dwarf elliptical (cdE, Drinkwater et al. 2001) or M32-like (e.g. Ziegler & Bender 1998) galaxies are members of the low-luminosity galaxy family, but instead of having low surface brightness like the most common early-type dwarfs, they have notorious high surface brightness (e.g. Nieto & Prugniel 1987). They constitute a very rare group, as there are many galaxies classified as compact ellipticals (see, for instance, Binggeli, Sandage & Tammann 1985), but only five objects have been confirmed as such, in addition to the prototype M32.
The known examples are all companions of larger galaxies. They are M32 itself, a satellite of the M31 (Andromeda) spiral galaxy, NGC 4486B close to M87 in the Virgo cluster (Sandage & Binggeli 1984; Davidge 1991), NGC 5846A close to the giant elliptical NGC 5846 (Davidge 1991; Mahdavi, Trentham & Tully 2005), A496cE close to the central cluster dominant (cD) galaxy of the cluster Abell 496 (Chilingarian et al. 2007), and two objects in the Abell 1689 cluster (CGA1689,1 and CGA1689,2, Mieske et al. 2005). It should be noted that object CGA1689,1 from (Mieske et al. 2005), has a quite deviating radial velocity with respect to its closest projected giant elliptical.
In particular, M32 presents the following characteristics: (a) it is a satellite of a larger galaxy; (b) the brightness profile cannot be accurately fitted with a single Sérsic law (Graham 2002; Choi, Guhathakurta & Johnston 2002); (c) high surface brightness in comparison with ellipticals of the same luminosity (Nieto & Prugniel 1987) and correspondingly a small size (Graham 2002; Choi et al. 2002); (d) a radial change in both age and metallicity, leading however to a quite flat colour profile, its stellar population being younger and more metal-rich at the centre (Rose et al. 2005). The other confirmed cE galaxies show similar properties with respect to surface brightness, compactness and projected location close to brighter galaxies. However, there might be some differences in their colour gradients and brightness profiles (see, for example, Lauer et al. 1996 and Ferrarese et al. 2006, regarding NGC 4486B) as well as in metal content and age (e.g. Sánchez-Blázquez, Gorgas & Cardiel 2006; Chilingarian et al. 2007).
Some effort has been made to find more examples of these very rare objects in nearby clusters or groups, like Fornax (Drinkwater et al. 2001) and Leo (Ziegler & Bender 1998). However, all the examined candidates have been rejected as cE galaxies. As the questions related to their origin and their role in the framework of galaxy evolution remain still open, it would be of great interest to find more objects and to study them in relation to their environment.
The Antlia cluster of galaxies is the third nearest well populated galaxy cluster after Virgo and Fornax. It exhibits a complex structure consisting of several subgroups, the most conspicuous ones being dominated by the giant elliptical galaxies NGC 3258 and NGC 3268. X-ray observations showed extended emissions around both subgroups (Pedersen, Yoshii & Sommer-Larsen 1997; Nakazawa et al. 2000). These emissions are concentrated towards the dominant galaxies, but extensions elongated in the direction to the other subgroup are also present, suggesting an ongoing merger. Dirsch, Richtler & Bassino (2003) and Bassino, Richtler & Dirsch (2008) have shown that the globular cluster systems around NGC 3258 and NGC 3268 are elongated in the same direction as a connecting line between the two galaxies, resembling the X-ray results.
The photographic survey of Ferguson & Sandage (1990) was the first and last major effort devoted to study the galaxy population of the Antlia cluster. They identified, by visual inspection, 375 galaxies that are listed in their Antlia Group Catalogue (hereafter labelled by the acronym FS90 plus the catalogue number). It gives, among other data, a membership status (1. definite member, 2. likely member, 3. possible member) and a morphological type for each galaxy. FS90 classified 10 objects as E(M32?) or S0(M32?), and 1 object as d:E(M32?),N.
Given the lack of an extensive analysis of Antlia’s galaxy population, we initiated the Antlia Cluster Project with the aim at performing the first CCD-photometric and spectroscopic study of this cluster. In the first paper of this long-term project (Smith Castelli et al. 2008, hereafter Paper I), we presented photometric properties of the early-type galaxy population. Among our results it was found that early-type members define a tight colour-magnitude relation, spanning 9 mag from giant ellipticals to dwarf galaxies, without a perceptible change of slope. This slope is similar to those found in other clusters like Virgo, Fornax, Perseus and Coma, which are dynamically different to Antlia, and it is also consistent with that displayed by the so called ‘blue tilt’ of metal-poor globular clusters in NGC 4486.
Among the Paper I sample, there were four galaxies classified as cE candidates by Ferguson & Sandage (1990). Two of these objects are spectroscopically confirmed Antlia members that seem to be normal low-luminosity early-type galaxies. The other two are each one close in projection to either one of the dominant galaxies, and are separated from the locus of the early-type members in the luminosity-mean effective surface brightness diagram. They display some characteristics of cE galaxies, but radial velocities are not available.
In this paper, the second of the Antlia Cluster Project, we present a photometric analysis of four FS90 cE candidates (namely FS90 110, FS90 165, FS90 192, and FS90 208) located in the central region of the Antlia cluster. We aim at obtaining photometric evidence in favour of, or against to, these objects being genuine cE galaxies. Given the small number of cE galaxies known to date, any additional members of this class could give important clues on their evolutionary path. The central question is probably whether they have been dynamically transformed by the interaction with a massive galaxy.
Throughout this paper we will adopt as the Antlia distance modulus (Dirsch et al. 2003), which corresponds to an Antlia distance of 35.2 Mpc. At this distance 1 arcsec subtends 170 pc. The paper is organized as follows. In Section 2 we give information about our photometric data. In Section 3 and 4 we present the analysis of the data, and in Section 5, a discussion and our conclusions.
2 Data
2.1 Observations
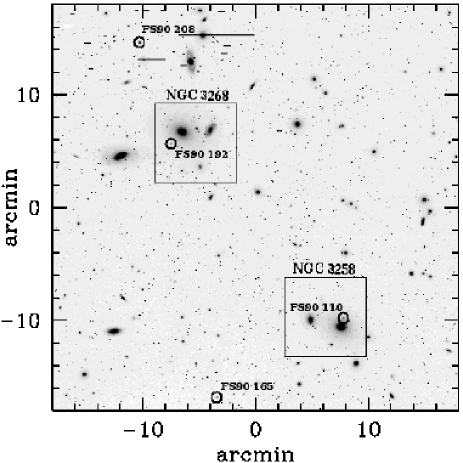
The data set comprises Kron-Cousins and Washington (Canterna 1976) images obtained with the MOSAIC camera (8 CCDs mosaic imager) mounted at the prime focus of the 4-m Blanco telescope at the Cerro Tololo Inter–American Observatory (CTIO), during 2002 April 4–5. These images cover the central part of the Antlia cluster (Fig. 1) and were used for Paper I. One pixel of the MOSAIC subtends 0.27 arcsec on the sky, which results in a field of view of arcmin2 (i.e. about kpc2 at the Antlia distance). The seeing on the image is 1 arcsec and on the image 1.1 arcsec. We refer to Dirsch et al. (2003) for more details.
We selected the Kron-Cousins filter instead of the original Washington due to its better transmission at all wavelengths (Geisler (1996)). and magnitudes are very similar, with just a very small colour term and zero-point difference (). We have transformed magnitudes into magnitudes by the calibration given in Dirsch et al. (2003).
As a supplement to the MOSAIC observations, we use Bessel and images for two fields centred on NGC 3258 and NGC 3268, respectively, that have been obtained during 2003 March 27-28 with FORS1 at the 8-m VLT UT1 (Antu) telescope (Cerro Paranal, Chile). These images cover two FS90 cE candidates (FS90 110 and FS90 192), are deeper and have higher resolution than those from CTIO. One pixel of this camera subtends 0.2 arcsec on the sky, giving a field of view of 6.8 6.8 arcmin2, i.e. 60 60 kpc2 at the Antlia distance. The seeing on the image is 0.53 arcsec for the NGC 3258 field, and 0.54 arcsec for the NGC 3268 one. We refer to Bassino et al. (2008) for more details.
In addition, we have combined four F814W band images of 570 sec each, and four F435W band frames of 1340 sec each, obtained from the ACS-HST archive and centred on NGC 3258, as well as four images in the same bands and with the same exposure times, centred on NGC 3268 (Proposal ID: 9427, PI: W. Harris). The FS90 cE candidates covered by these frames are, once more, FS90 110 and FS90 192. In order to make a comparison between these two candidates with a confirmed cE galaxy, we have also combined two images in the F850LP band of 560 sec each of NGC 4486B, obtained from the same archive (Proposal ID: 9401, PI: P. Côté).
All ACS images were processed with the standard calibration pipeline (CALACS+multidrizzle), including bias, dark and flat-fielding corrections. The HST images have a FWHM of 0.1-0.12 arcsec, one pixel of the ACS camera subtends 0.05 arcsec on the sky, and its field of view is 202 202 arcsec2, i.e. 34.3 34.3 kpc2 at the Antlia distance. Following Sirianni et al. (2005), the F850LP was calibrated to the band. Additionally, and adopting the transformation for , the F814W filter was calibrated in Cousins band magnitudes, and the F435W filter in Johnson band magnitudes.
2.2 Photometry
We calculated total magnitudes and colours by numerically integrating the observed brightness profiles of our FS90 cE candidates. To obtain these profiles we applied the task ELLIPSE within IRAF (Jedrzejewski 1987). For each galaxy, we used the MOSAIC image to obtain the elliptical apertures to be used also for the image. These apertures were determined allowing their centres, ellipticities and position angles to vary freely, until their fits became unstable as a consequence of the low surface brightness. At this point, the three parameters were fixed in order to extend the isophotal fit as much as possible towards larger radii. The sky level was determined following the procedure described in Paper I.
The central regions of FS90 110, FS90 165 and FS90 208 were overexposed on the long-exposure images. To include them, we worked with both long- and short-exposure frames following the procedure described in Paper I for bright galaxies with overexposed centres (see also Sect. 3.2).
FS90 110 and FS90 192 are projected close to NGC 3258 and NGC 3268, respectively. As a consequence, they are embedded within the light of their bright companions. To obtain their brightness profiles, we constructed 2-dimensional models of both dominant galaxies, and subtracted them from the original images. To build these models, we used the task BMODEL within IRAF, which creates a 2-dimensional image file containing a noiseless photometric model of a source image. The models are based on the isophotal analyses previously performed with ELLIPSE. We chose a spline function for the interpolation which is supposed to give the smallest residuals.
In order to ensure the best quality of our models we performed two sequences of modelling and subtraction. The first models of NGC 3258/3268, built after masking out the neighbouring bright galaxies, served to enable the modelling of the companion galaxies. These models are then subtracted from the original images, after which we obtain the final models of the dominant galaxies. The subtraction of these last models for NGC 3258 and NGC 3268 from the original images provides the frames in which the profiles of FS90 110 and FS90 192 are measured, following the fitting procedure mentioned above.
The FORS images were used to determine the isophotal apertures to be measured also on the FORS frames, and single sequences of modelling and subtraction of the dominant galaxies were applied. The fitting procedure was similar to that performed on the MOSAIC images. This is also valid for the ACS images.
Table 1 lists relevant information about our cE candidates. In the first five columns we show the FS90 number, positions, FS90 morphology, and values. The next six columns give the photometric results obtained in the Washington photometric system. These are the observed total magnitudes and colours (not corrected by absorption or reddening) with uncertainties in parentheses (obtained as described in Paper I), the surface brightness of the limiting isophote within which the total magnitude has been calculated, the equivalent radius of the limiting isophote, the mean surface brightness within the effective radius, and the effective radius (i.e. the radius containing half of the light). The last column gives the heliocentric radial velocities, when available.
| FS90 | R.A. | Decl. | FS90 | vr | |||||||||||||
|---|---|---|---|---|---|---|---|---|---|---|---|---|---|---|---|---|---|
| ID | (J2000) | (J2000) | morph. | mag | mag | mag | mag arcsec-2 | arcsec | mag arcsec-2 | arcsec | km s-1 | ||||||
| 110 | 10:28:53.0 | -35:35:24 | E(M32?) | 0.085 | 15.49 (0.01) | 2.06 (0.02) | 27.5 | 14 | . | 0 | 18.4 | 1 | . | 5 | - | ||
| 165 | 10:29:46.0 | -35:42:25 | S0(M32?) | 0.086 | 15.50 (0.01) | 2.01 (0.02) | 27.3 | 20 | . | 9 | 20.3 | 3 | . | 6 | 2605 | 80 | |
| 192 | 10:30:04.5 | -35:20:31 | E(M32?) | 0.104 | 16.66 (0.01) | 2.11 (0.02) | 27.6 | 11 | . | 4 | 19.8 | 1 | . | 7 | - | ||
| 208 | 10:30:18.7 | -35:11:49 | S0(M32?) | 0.103 | 14.76 (0.01) | 1.94 (0.03) | 27.5 | 30 | . | 1 | 19.8 | 4 | . | 1 | 1774 | 100 | |
Notes.- Coordinates have been obtained through CDS, which are calculated from FS90. Extinction values are from Schlegel et al. (1998). corresponds to the surface brightness of the outermost isophote within which integrated magnitudes and colours were measured. is the equivalent radius () of that isophote. is obtained within , the radius that contains half of the light. All these values were obtained from ELLIPSE. The radial velocities are from 6dF.
3 Analysis of MOSAIC data
3.1 Morphology and spatial location
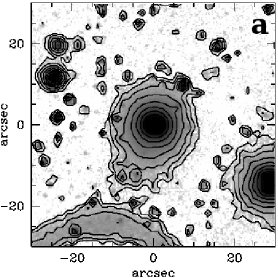
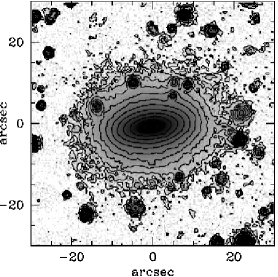
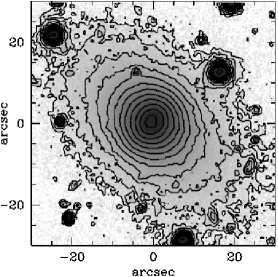
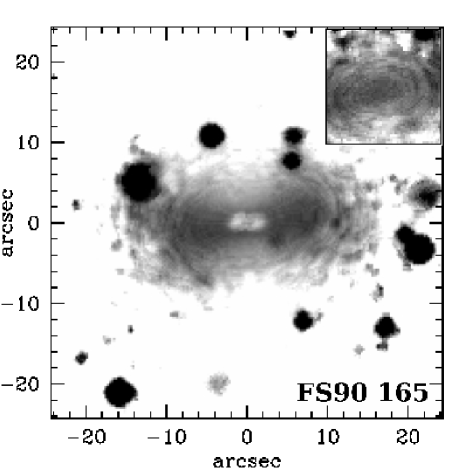
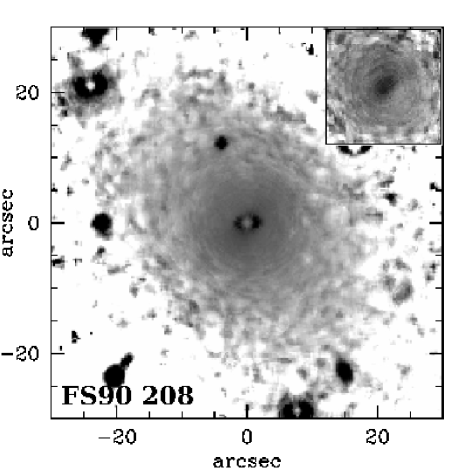
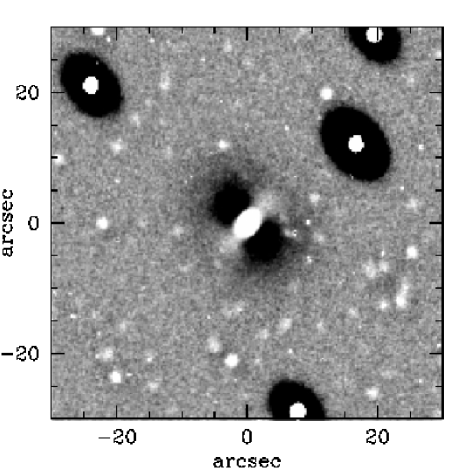
The a-panels of Fig. 2 show the morphologies of the FS90 cE candidates in the MOSAIC R-frames. Each side is 1 arcmin (10.2 kpc at the adopted Antlia distance). In the case of FS90 110, a model of NGC 3258 has been subtracted.
FS90 110 is located at a radial distance of 47 arcsec ( 8 kpc at the Antlia distance) from NGC 3258 to the North. There is no radial velocity available for this object. FS90 110 was catalogued by FS90 as a ‘possible’ (i.e. status 3) Antlia member with an E(M32?) morphology. It resembles a cE galaxy (see Fig. 2), as it is round and small in projected size ( 2.4 kpc). It is the closest galaxy in projection to either one of the dominant Antlia galaxies and, interestingly, its image shows an elongation of the outer isophotes towards its bright companion (see Fig. 2). This low surface brightness feature is seen on the image as well.
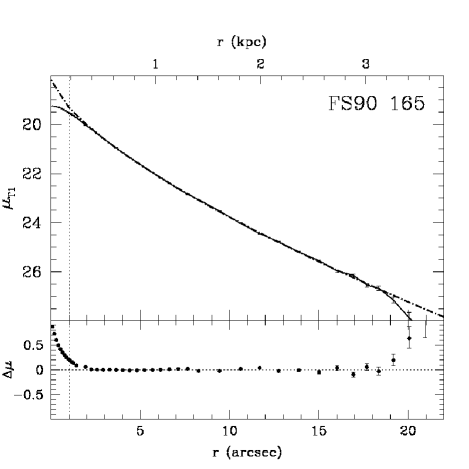
FS90 165 is located at 12.2 arcmin ( 124.4 kpc at the Antlia distance) from NGC 3258 towards the SE, and is a spectroscopically confirmed Antlia member. It was catalogued by FS90 as a ‘likely’ (i.e. status 2) member of Antlia with an S0(M32?) morphology. FS90 165 is one of the smallest S0 galaxies in the central region of Antlia. It is fainter than mag, the limiting magnitude that separates dwarfs from bright early-type galaxies in our Paper I sample.
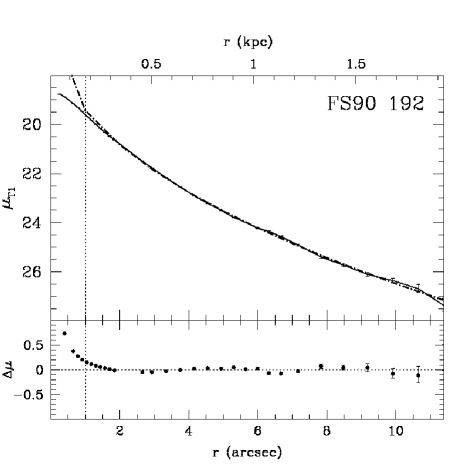
FS90 192 is located at 1.4 arcmin ( 14.2 kpc at the Antlia distance) from NGC 3268 to the SE. No radial velocity is available. It is catalogued as a ‘possible’ (i.e. status 3) Antlia member displaying an E(M32?) morphology. It looks round and compact like FS90 110, albeit smaller ( 1.9 kpc at the Antlia distance, see Table 1). It is more distant in projection from NGC 3268 than FS90 110 is from NGC 3258, and there is no visible distortion in its outer isophotes.
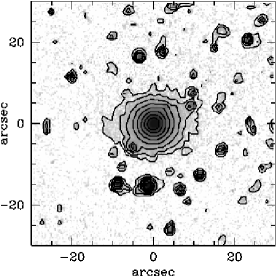
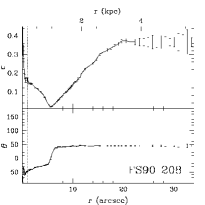
FS90 208 is a confirmed Antlia member located at 8.5 arcmin ( 86.7 kpc at the adopted Antlia distance) from NGC 3268 to the NE. It is considered to be a S0(M32?) ‘definite’ (i.e. status 1) member of Antlia by FS90. It displays a round morphology in its central region and gets elongated outwards. It is the largest FS90 cE candidate in the central region of Antlia (see Table 1).
3.2 Brightness and colour profiles
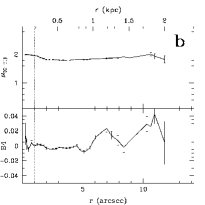
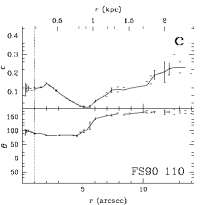
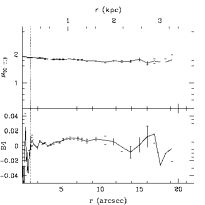
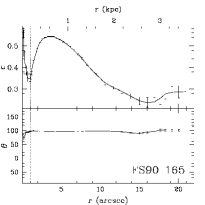
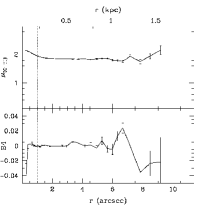
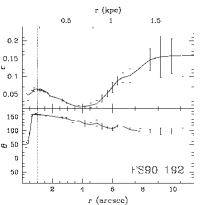
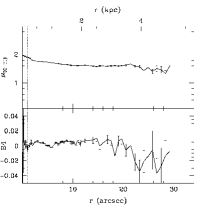
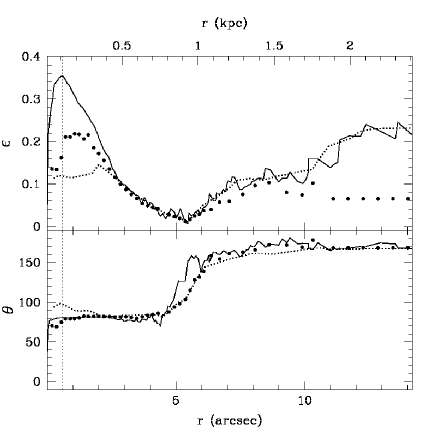
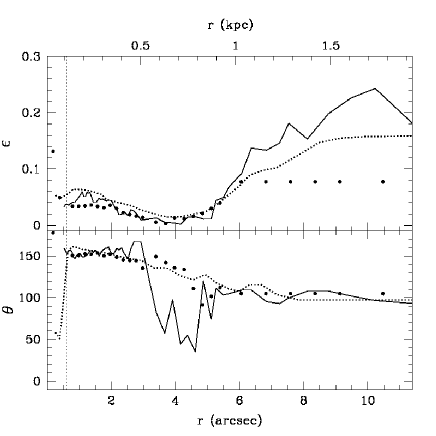
As mentioned above, panels a of Fig.2 show contour plots superimposed on the images of the FS90 cE candidates. We also present their colour profiles and the ELLIPSE B4 index vs. equivalent radius (panels b), as well as the ellipticity () and position angle () vs. equivalent radius (panels c). Positive angles are measured from north to east.
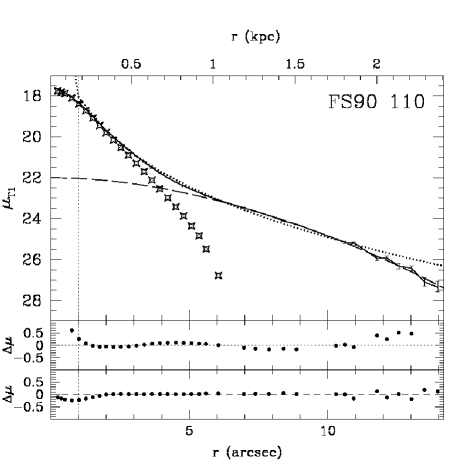
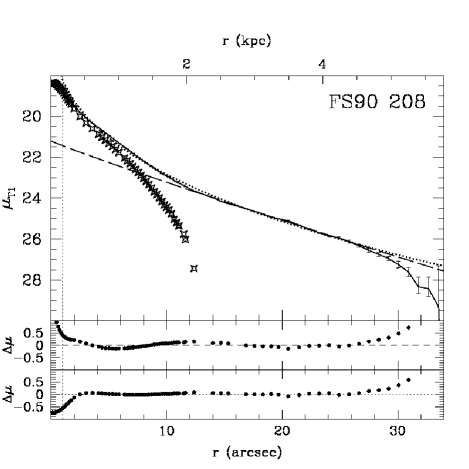
In Fig.3 we show the brightness profiles for these four galaxies. From these plots it can be seen that, if we exclude the region affected by seeing ( arcsec), FS90 165 and FS90 192 show what seems to be a one component profile with smooth variations in ellipticity and position angle. On the contrary, the brightness profiles of FS90 110 and FS90 208 seem to present two components in agreement with the strong changes both in ellipticity and orientation displayed by the fitted apertures.
To test if single component models provide good fits to the brightness profiles of the FS90 cE candidates, we used the Sérsic law (Sérsic 1968):
| (1) |
where designates the central () surface brightness, is the scalelength of the profile, and is the Sérsic index. Because of its simpler mathematical dependence on the free parameters, we decided to use the above formula instead of:
| (2) |
where for (Graham & Worley 2008, and references therein). There are simple relations between the quantities involved in both equations (e.g. MacArthur, Courteau & Holtzman 2003):
| (3) |
| (4) |
| (5) |
which let us easily obtain the effective radius () and the surface brightness at this radius () from the parameters of Eq. 1. Following the results of the numerical simulations performed by Gavazzi et al. (2005), it was decided not to correct the Sérsic parameters for seeing effects (Trujillo et al. 2001a,b) unless a Sérsic index n greater than 3 was obtained.
The structural parameters obtained from the fits are listed in Table 2. The profile fits and their residuals are plotted in Fig. 3.
| Object | Component | N | n | |||||||
|---|---|---|---|---|---|---|---|---|---|---|
| (arcsec) | (arcsec) | (mag arcsec-2) | (arcsec) | (mag arcsec-2) | (arcsec) | |||||
| FS90 110 | inner | 2.3 | 4.8 | 17.730.02 | 1.170.01 | 1.230.01 | 19.13 | 1.43 | 0.81 | 15.61 |
| FS90 110 | outer | 6.0 | 11.8 | 21.990.45 | 6.072.78 | 1.830.36 | 22.82 | 5.26 | 0.55 | 16.84 |
| FS90 165 | single | 2.2 | 13.8 | 18.190.06 | 0.940.05 | 0.690.01 | 20.98 | 3.69 | 1.45 | 15.25 |
| FS90 192 | single | 1.6 | 9.9 | 15.770.34 | 0.070.02 | 0.460.02 | 20.12 | 1.42 | 2.17 | 16.27 |
| FS90 208 | inner | 2.0 | 9.8 | 19.140.08 | 2.920.29 | 1.290.04 | 20.44 | 3.37 | 0.77 | 15.04 |
| FS90 208 | outer | 12.4 | 24.9 | 21.210.55 | 5.262.45 | 0.930.14 | 23.16 | 9.90 | 1.07 | 15.52 |
3.2.1 FS90 110
As it was mentioned in Sec. 2.2, the centre of FS90 110 is overexposed in the long-exposure image obtained with MOSAIC. Thus, we used the short-exposure one to obtain its inner brightness profile up to an equivalent radius of arcsec. For larger radii, we used the long-exposure frame to obtain its brightness profile out to arcsec ( mag arcsec-2), starting with the parameters for arcsec.
The centre of the elliptical apertures, the ellipticity and the position angle were allowed to vary freely for the inner fit. For the outer fit, they were fixed once the convergence of the isophotal fit was prevented due to the low surface brightness of the outermost isophote.
The ellipticity shows a strong variation on a small radial scale. It changes from at arcsec, to at arcsec. Then, it increases up to at arcsec and after that it remains constant. This behaviour is followed by the position angle as it varies from in the range arcsec, to at arcsec. The B4 coefficient becomes positive (i.e. disky isophotes) in the outer region, at a similar radius as for which the ellipticity and the position angle change in a significant manner.
The outer isophotes of FS90 110 display an elongation towards NGC 3258 in the MOSAIC image, as it can be seen from Fig. 2. Therefore, we performed several isophotal fits to test if the strong variation in position angle and ellipticity could be an artifact due to the presence of this low surface brightness structure. We performed an outer fit keeping the position of the centre fixed during the whole process, and an outer fit masking half of the galaxy in the direction to NGC 3258. In all these cases, and show, within the errors, the same behaviour like in the free isophotal fit.
The colour profile of this galaxy does not show any perceptible gradient out of the region of seeing influence.
We performed several fits of the Sérsic law to the brightness profile of FS90 110. It was found that it is more convenient to fit the profile with two components, as a single component fit gives systematic positive and negative residuals (see Fig. 3). Furthermore, variations of the range in equivalent radius used to perform single component fits, make the Sérsic index to evolve from convex profiles for larger ranges to concave ones for smaller intervals.
Following Cellone & Buzzoni (2001), to get possible analytical profiles for the two components we first fitted a Sérsic law to the outer region of the galaxy in the range arcsec (dashed line in FS90 110 panel of Fig. 3). Then, we subtracted the intensities of this model from the observed ones in the whole profile range. In this way we recover the inner component (open symbols in Fig. 3), which was then fitted with an independent Sérsic law (not shown for clarity in Fig. 3).
We are aware that this decomposition scheme might be not unique as it depends on the radial ranges selected to perform the fits, as well as on sky subtraction effects (see, for instance, Cellone & Buzzoni 2001, for a discussion about the art of profile fitting). However, the validity of our approach is supported by the small and stable residuals shown in Fig. 3. Moreover, a fit of two coupled general Sérsic laws to the profile of FS90 110 in the range 2.3 – 11.8 arcsec has given structural parameters that are in agreement, within the errors, with those given in Table 3.
The integrated magnitudes obtained for both components from their individual Sérsic fits show that the inner component could be 3 times brighter than the outer one, making this galaxy a bulge-dominated system. It is worth noting that the radius at which the changes in ellipticity and position angle arise, is similar to that at which the outer component seems to begin to dominate the brightness profile.
3.2.2 FS90 165 (confirmed Antlia member)
The fit of elliptical apertures in the central region of FS90 165 was performed on the short-exposure image, as its centre is overexposed in the long-exposure one. The inner profile was obtained allowing centre, ellipticity and position angle to vary freely. The fit reaches an equivalent radius of arcsec, and from this radius outwards, we worked with the long-exposure image to obtain an outer profile reaching arcsec ( mag arcsec-2).
Again, we allowed for free variation of all elliptical apertures parameters until the outermost (low surface brightness) regions of the galaxies were reached.
The ellipticity shows an almost constant value of about from arcsec to arcsec, and then displays a smooth decrease until at arcsec. The position angle keeps a constant value of along the whole profile. This behaviour of the elliptical apertures can be seen in panel a of Fig. 2: the ellipses get more and more elongated towards the centre, while their orientation has no detectable variation. The B4 coefficient is positive over the whole equivalent radius range, showing that the isophotes of this galaxy are disky.
Outside arcsec, the colour profile displays a slight blue gradient of mag, from at arcsec, to at arcsec.
The brightness profile was fitted by a single Sérsic law in the range arcsec. The analytical profile is shallower than a de Vaucouleurs law, and the effective radius obtained from it, is in good agreement with that measured from the observed one (see Table 2).
3.2.3 FS90 192
As the centre of this galaxy is not overexposed in the long-exposure frames, the fit of elliptical apertures was performed on the long-exposure image up to an equivalent radius of 11.4 arcsec ( mag arcsec-2). The centre of the ellipses, the isophotal ellipticity and position angle were allowed to vary freely, until the low surface brightness of the outermost regions prevented a good convergence of the fits.
The ellipticity is consistent with circular isophotes out to arcsec, and then it begins to increase smoothly until it reaches a maximum value of in the outer regions. The position angle shows a smooth decrease of from the innermost isophotes (out of the seeing influence region) to the outermost ones.
There is no perceptible gradient in the colour profile, except that seen at arcsec, likely due to seeing effects.
The brightness profile was successfully fitted by a single Sérsic profile in the range arcsec. This galaxy does not follow a de Vaucouleurs law, but a shallower one. However, we should stress that we do not have a radial velocity for this object. If it was a background galaxy, we would likely lose the central steepening of the profile due to seeing and distance effects.
The effective radius obtained from the analytical profile is in good agreement with that calculated from the observed one.
3.2.4 FS90 208 (confirmed Antlia member)
The short-exposure image was used to obtain an inner profile up to arcsec. The rest of the profile was obtained from the long-exposure frame, up to arcsec ( mag arcsec-2). Once more, all the elliptical parameters were allowed to vary freely, until a good convergence was prevented due to the low surface brightness of the outer isophotes.
This galaxy presents a remarkable change both in ellipticity and in position angle at arcsec. The ellipticity decreases from at arcsec, to at arcsec, and then increases to at arcsec. From this point outwards, the ellipticity keeps constant. The position angle follows the changes in ellipticity, as it varies from at arcsec, to at arcsec, and then it keeps more or less constant. These variations are quite similar to those displayed by FS90 110, albeit stronger. The B4 coefficient for this galaxy is consistent with its isophotes being disky.
A small colour gradient is present in the profile. The colour gets bluer outwards, from at arcsec, to at arcsec. From this point to the outskirts of the galaxy, the colour keeps constant.
As in the case of FS90 110, the brightness profile of FS90 208 is better fitted by two components for the same reasons. Therefore, we fitted a Sérsic profile to the outer part of the galaxy, in the range arcsec, which was then subtracted in intensities from the original one. We then recovered the inner component and fitted an independent Sérsic law to it (see Fig. 3).
From the integrated magnitudes of both components, we found that the inner one seems to be not so prominent in comparison with the outer, as the former is 1.6 times brighter than the latter. Contrary to FS90 110, the radius at which the changes in ellipticity and position angle arise is smaller than that found to possibly separate the two components.
3.3 Colour maps and unsharp masking
In order to obtain information about the internal structure of the FS90 cE candidates, we built colour maps with their and short and long exposure images. The individual images were previously filtered by applying a median filter with a window size of 5 5 pixels to reduce the noise of the maps.
Following Lisker et al. (2006b), we have also performed an unsharp masking process on the long exposure images of the four galaxies. The frames were used instead of the ones, as none of the galaxy centres are overexposed in the former ones. We have produced circular and elliptical masks, considering Gaussian kernels with values in the range 3 – 30 pixels (i.e. 0.8 – 8 arcsec). To built the elliptical masks, we used the position angles and ellipticities of the outer isophotes of each galaxy.
In addition, to test the existence of hidden discs, we have analysed the residual images obtained from a fixed ELLIPSE fitting (i.e. by fixing the position angle and ellipticity in the whole fitting process).
For FS90 110 and FS90 192 we have found no evidence of internal structure. Both colour maps are smooth and show redder centres than the outskirts, in agreement to what is seen in their colour profiles (see Fig. 2). As there are FORS1 and ACS images available for them, we will go on with this analysis in Sect. 4.2.
In Fig. 4 we show for FS90 165 and FS90 208, colour maps and resulting images of the unsharp masking process. It can be seen that the mask of FS90 165 shows a red disc-like structure, not evidenced in its colour profile. This structure is in agreement with the existence of disky isophotes, as expected from the positive values of the B4 index (see Fig. 2). FS90 165 seems to be a low luminosity lenticular galaxy, displaying a similar colour-map to those of similar objects (see, for example, Chilingarian et al. 2008).
The colour map of FS90 208 is smooth with a small red gradient towards the centre, also evident in its colour profile. On the contrary, the unsharp mask performed using an elliptical kernel with the same ellipticity and position angle of its outer component shows a possible bar-like structure, that seems to be present in the residual image of a fixed ELLIPSE fitting (not shown).
3.4 Colour-magnitude and luminosity versus mean effective surface brightness relations
| Galaxy | Companion | Dist. Comp. | References | |||||||
|---|---|---|---|---|---|---|---|---|---|---|
| (mag) | (mag) | (Mpc) | (mag) | (arcsec) | (mag arcsec-2) | (kpc) | (kpc) | |||
| M32 | 0.062 | 24.53 | 0.8 | 7.68 | 28.5 | 16.9 | 1.2 | M31 | 5.5 | 1,2,3 |
| NGC 4486B | 0.021 | 31.26 | 17.9 | 12.72 | 2.5 | 16.7 | 1.0 | NGC 4486 | 28 | 4,5,6 |
| NGC 5486A | 0.055 | 32.08 | 26.1 | 13.07 | 4.1 | 18.1 | 1.6 | NGC 5486 | 3.1 | 6,7,8 |
| A496cE | 0.138 | 35.70 | 138.0 | 17.35 | 0.7 | 18.6 | - | A496 cD | 14 | 9 |
Notes.- Extinction values are from Schlegel et al. (1998). References: (1) Mateo (1998) and references therein; (2) Graham (2002); (3) Choi et al. (2002); (4) Alonso et al. (2003); (5) Tonry et al. (2001); (6) Nieto & Prugniel (1987); (7) Mahdavi et al. (2005); (8) de Vaucouleurs et al. (1991); and (9) Chilingarian et al. (2008). In all cases, the mean effective surface brightness () was obtained from the effective radius (), and magnitudes transformed into ones through (see Section 2.1), with eq. 1 of Paper I. For A496cE, the magnitude was calculated from its one (Chilingarian et al. 2008), through (Fukugita et al. 1995).
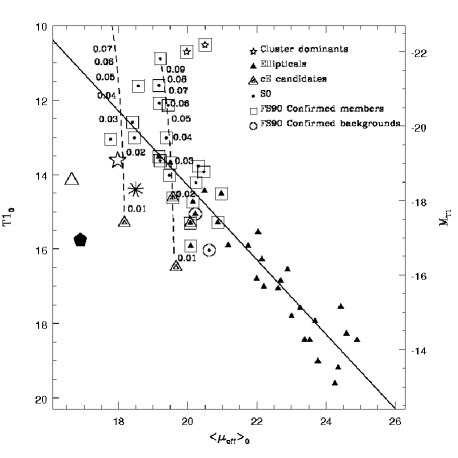
The left panel of Fig. 5 shows a vs. (absorption corrected) plot for the FS90 early-type galaxies from our Paper I sample, where their FS90 morphology has been indicated. We also depict, as a reference, the locus of constant effective radius followed by galaxies fainter than mag (see Paper I). In this plot, the locations of all these galaxies correspond to observed apparent magnitudes. For comparison, we have also included some confirmed cE galaxies that display the positions they would have at the Antlia distance. These are M32 (big filled pentagon), NGC 4486B (big open triangle), NGC 5846A (big star), and A496cE (big asterisk) (see Table 3).
In this figure, FS90 165 and FS90 208 share the locus of the Antlia early-type galaxies. On the contrary, FS90 110 and FS90 192 are located far from this relation defined by early-type galaxies, towards higher mean effective surface brightness, smaller effective radius or fainter magnitudes.
In particular, FS90 110 presents the highest mean effective surface brightness of the whole Paper I sample, with the exception of FS90 94, a bright S0 Antlia member. Furthermore, FS90 110 seems to extend the sequence followed by bright elliptical and S0 galaxies (in a perpendicular direction with respect to the early-type galaxies’ relation), in the same way as M32 would do if it were placed at the Antlia distance. This latter correlation corresponds to the Kormendy (1977) scaling relation followed by bright ellipticals and bulges of spiral galaxies on the vs. plot, which is a projection of the Fundamental Plane (Djorgovski & Davis 1987). NGC 4486B, NGC 5846A and A496cE are located within this sequence as well, towards smaller effective radius. However, M32 is the most extreme case. This behaviour of cE galaxies has already been noticed by, for instance, Nieto & Prugniel (1987) (see also Chilingarian et al. 2007). FS90 192 does not follow the same trend as the cEs do.
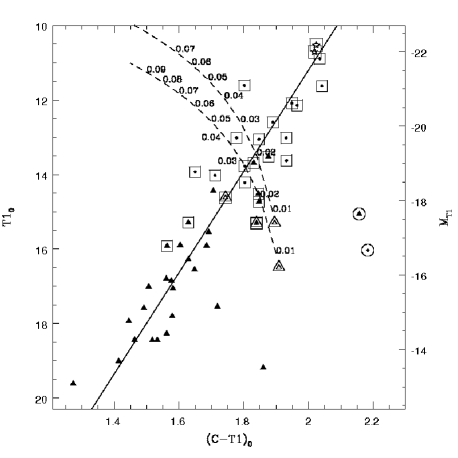
The right panel of Fig.5 shows the colour-magnitude diagram of the FS90 early-type galaxies from the Paper I sample, where the FS90 cE candidates have been included. The solid line shows the mean colour-magnitude relation followed by early-type Antlia galaxies. It can be seen that FS90 110 is located on the red border of the relation, at almost the same position as FS90 165, and evidently separated from the early-type background galaxies with similar apparent magnitudes. On the contrary, FS90 192 clearly deviates from the colour-magnitude relation of Antlia members towards redder colours, or fainter magnitudes.
We note that, considering the vs colour-magnitude relation of the Perseus cluster (Conselice, Gallagher & Wyse 2002), and adopting for M32 mag (Peletier 1993) and (see Table 3), the location of M32 in this diagram presents the same trend like FS90 110 and FS90 192 in ours, i.e. shifted towards redder colours or fainter magnitudes from the cluster mean colour-magnitude relation.
As an additional test, we assume that FS90 110 and FS90 192 are elliptical background galaxies that ‘fall off’ the mean relations followed by Antlia early-type members, due to the effect of distance. Then we can calculate the shift of their positions in the vs. and colour - magnitude plots applying cosmological dimming and K-corrections to their observed surface brightnesses, and luminosities and colours, respectively. From Fukugita et al. (1995) we adopt the K-correction to for an elliptical galaxy. Assuming that early-type galaxies are old stellar systems, we transformed this correction into following Forbes & Forte (2001). The dashed lines in both panels of Fig. 5 show the different positions that these galaxies would hold at the Antlia distance, if their real distances were within a redshift range . Please note that a redshift of corresponds approximately to the adopted Antlia distance.
Fig. 5 shows that, to fall on the locus of the Antlia relation, FS90 110 might have, at most, an intrinsic luminosity similar to those of bright early-type Antlia members, then being at a distance of 120 Mpc (). This shift would place it within the colour-magnitude relation at the right panel.
For FS90 192 two options exist in the vs. plot: it could be a bright dwarf elliptical at 120 Mpc, or a giant elliptical galaxy placed as far as 400 Mpc (). However, from the colour - magnitude diagram we can see that the second possibility must be discarded as, for that redshift, FS90 192 would be completely out of the mean relation.
Regarding FS90 192, the images do not show any concentration of galaxies in its neighbourhood, which would make it an interesting object even if it were not confirmed as an Antlia cE galaxy: isolated ellipticals of moderate luminosity are not common objects. In the case of FS90 110, we can not rule out from the present analysis that it may be an ordinary background galaxy.
4 Analysis of FORS1 and ACS data
In order to obtain more evidence in favour of, or against FS90 110 and FS90 192 being cE galaxies, we have analysed two frames obtained with FORS1, centred on NGC 3258 and NGC 3268, respectively. As said above, these frames are deeper and were taken under better seeing conditions than the MOSAIC ones. We have also used two ACS images from the HST archive also centred on NGC 3258 and NGC 3268, respectively. Unfortunately, there are no similar data available for FS90 165 and FS90 208.
4.1 Low surface brightness bridge
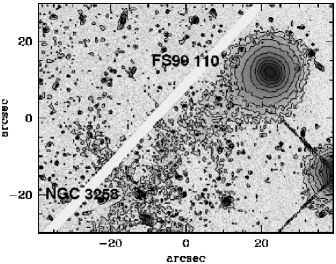
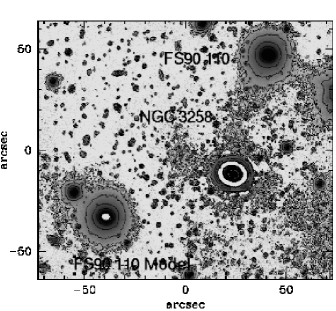
In the FORS1 and ACS images of FS90 110 and FS90 192 we have not detected outer structures different from those previously seen on the MOSAIC images. The very low surface brightness ‘bridge’ that seems to link FS90 110 to NGC 3258 is detected in both the and FORS1 images as well as in the F814W ACS frame. No comparable structures were found in the corresponding images of FS90 192. Its outer isophotes look quite regular without visible evidence of distortion.
In the top panel of Fig. 6 we show brightness contour levels superimposed on the F814W ACS frame of FS90 110 from which a model of NGC 3258 has been subtracted. In order to test if the low surface brightness structure could be just an artifact due to the subtraction of NGC 3258, we added to the original FORS1 image of NGC 3258, a model of FS90 110 obtained with BMODEL. This artificial galaxy with similar characteristics as FS90 110, was placed in a different position but keeping the original galactocentric distance to the centre of the dominant galaxy. We subtracted the light of NGC 3258 from this new image, and no low surface brightness ‘bridge’ was found at the location of the added object (see Fig. 6). This result can be understood as a proof that such ‘bridge’ is not a spurious detection due to image processing. Another argument supporting this statement is the fact that this low surface brightness structure does not connect the two galaxy centres, as can be seen in both panels of Fig.6.
4.2 Colour maps and unsharp masking
With the purpose of getting additional information on the possible internal structure of FS90 110 and FS90 192, we built and colour maps from the FORS1 and ACS images, respectively. We have also performed unsharp masking on those frames with the best signal-to-noise ratio, i.e. the FORS1 and ACS images. Elliptical masks were constructed in a similar way as those of MOSAIC.
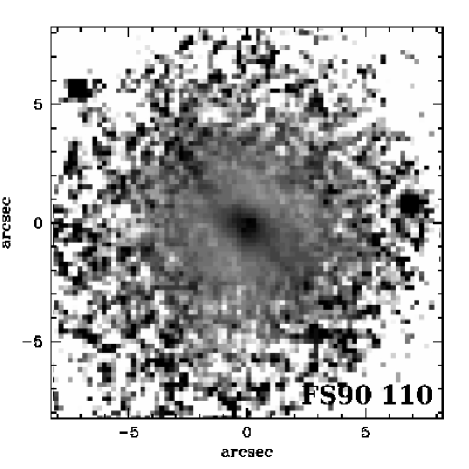
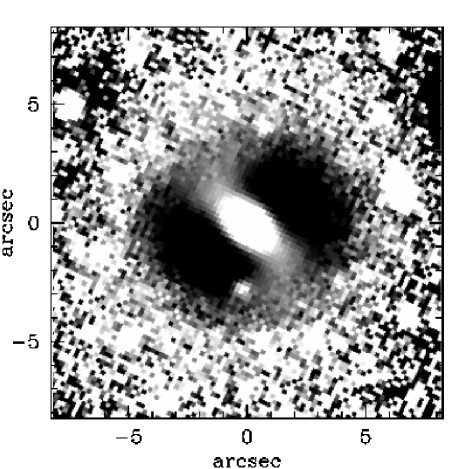
In Fig. 7 we show the ACS colour map of FS90 110 (left panel), which has a better spatial resolution than the FORS1 one. A FORS1 unsharp elliptical mask is also displayed (right panel), resulting from a value of 5 pixels (i.e. 1 arcsec). In the inner region of FS90 110, we see an embedded warped structure which is detected on both the colour map and the mask. This structure is redder than the rest of the galaxy.
Although the ACS images show a higher spatial resolution, we prefer to show a FORS1 mask, as the former contains an artifact in the same location where the inner structure is expected to show up. All bright point sources also show this artifact (note the bright star at the right side of the top panel of Fig. 6.)
In the colour maps and unsharp masks of FS90 192 (not shown) we have not found any structure different from what has been already seen in the MOSAIC data.
4.3 Brightness profiles
| FS90 | ||||||||||
|---|---|---|---|---|---|---|---|---|---|---|
| ID | mag | mag | mag arcsec-2 | arcsec | mag arcsec-2 | arcsec | ||||
| 110 | 16.41 | 1.14 | 27.7 | 12 | . | 3 | 18.8 | 1 | . | 2 |
| 192 | 18.00 | 1.21 | 27.3 | 8 | . | 6 | 21.0 | 1 | . | 6 |
Notes.- gives the surface brightness of the outermost isophote within which integrated magnitudes and colours are measured. is the equivalent radius () of that isophote. is obtained from . All these values were obtained from ELLIPSE.
Figure. 8 shows a comparison of the MOSAIC brightness profiles of FS90 110 and FS90 192, with the and ones obtained from FORS1 and ACS, respectively. The photometric parameters obtained from the VLT and profiles are listed in Table 4.
Most of the features observed in the MOSAIC profiles are confirmed through VLT and HST images, including the ellipticity and position angle variations. The exception is the ELLIPSE B4 coefficient behaviour in FS90 110, as it does not become positive at arcsec. The high central surface brightness displayed by FS90 110 in the ACS profile is noticeable, detected thanks to the low FWHM of these images.
In order to test the values of the Sérsic indices obtained for the brightness profile (see Sect. 3.2) of FS90 110, we have fitted two coupled general Sérsic laws to its ACS brightness profile, within the equivalent radius range 2.0 – 11.8 arcsec. The Sérsic index N (i.e. 1/n) for both components resulting from this new fit (1.80.2 and 1.250.05 for the outer and the inner components, respectively), are in quite good agreement with those obtained from the MOSAIC profile (see Table 2).
We intended to perform a two component fit over the whole useful range of the ACS profile, i.e. 0.3 – 11.8 arcsec, as the innermost 0.3 arcsec are expected to be affected by the seeing. However, no model could be obtained that properly fitted the whole profile considering an inner cut radius lower than 1.5 arcsec ( 2 FWHM). This indicates that two Sérsic laws can represent the light profile of the galaxy only if the central region is excluded from the fit. Such limitation of Sérsic profiles could not be avoided by, for example, performing a PSF convolution with the model.
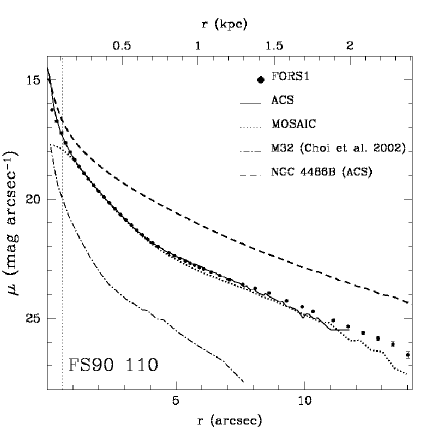
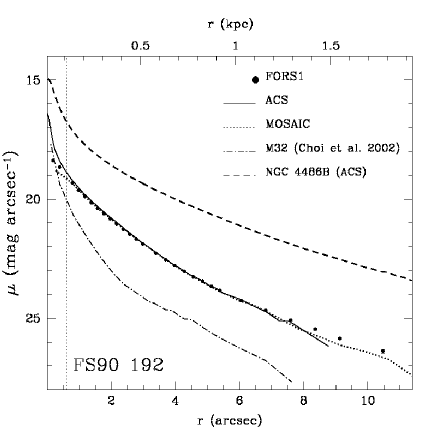
Choi et al. (2002) have obtained the profile of M32, which is shown in Fig. 8 with its equivalent radius re-scaled to the Antlia distance. In addition, we have obtained the ACS profile of NGC 4486B which is also shown re-scaled. The profiles of FS90 110 and M32 look quite similar both in shape and high central surface brightness, albeit the former extends over a larger galactocentric radius. M32 also displays significant changes both in ellipticity and in position angle (Choi et al. 2002), similar to those found in FS90 110. On the other hand, NGC 4486B is larger than FS90 110 and does not show a two component profile, similarly to FS90 192. This is in agreement with Ferrarese et al. (2006), who fitted a single component Sérsic law to the profile of NGC 4486B.
5 Discussion and Conclusions
5.1 FS90 165
From the analysis performed in the previous section, we conclude that FS90 165, an spectroscopically confirmed Antlia member, cannot be considered as a cE galaxy. It follows fundamental relations of low surface brightness early-type Antlia galaxies (see also Paper I), is larger than any confirmed cE object, and presents no compact morphology. It is also located far away in projection from any bright galaxy, and from the central cluster region, a characteristic shared by all confirmed cE galaxies. Its brightness profile is well fitted by a single Sérsic law along its whole radius range, i.e. it does not show two components. However, the S0 morphological classification assigned to this galaxy by FS90 is in agreement with the B4 coefficient values that point to disky isophotes, and with the red inner disc found in its colour map and confirmed through unsharp masking. There are no images from VLT or HST for this object.
5.2 FS90 208
Certainly, FS90 208 is not a cE galaxy either. It is a confirmed Antlia member that follows the same fundamental relations as FS90 165 and the rest of low surface brightness early-type galaxies, and it is not compact. Besides, it is not close in projection to any bright galaxy and is far from the centre of the cluster. However, it displays a two component brightness profile and presents important variations in ellipticity and position angle that resemble those shown by M32 (Choi et al. 2002), albeit stronger. Curiously, these variations arise at the same galactocentric radii than those displayed by FS90 110, and behave in a similar way. FS90 have classified this object as an S0 galaxy, which is in agreement with the two components present in its brightness profile, as well as with the B4 coefficient which indicates that the isophotes are nearly disky. Moreover, a process of unsharp masking reveals what seems to be an inner bar structure, slightly detected with the subtraction of a fixed ELLIPSE model of the galaxy from the MOSAIC image. However, a triaxial object in which the axial ratios vary with radius, could also display isophote twisting (Binney & Merrifield 1998).
5.3 FS90 192
There is no radial velocity available for FS90 192. It displays no perceptible colour gradients and, if it was an Antlia member, it would be as compact as other cE galaxies. Furthermore, its projected distance to NGC 3268 would be smaller than that between NGC 4486B and NGC 4486. Although it does not display two components in its brightness profile, it is worth noting that NGC 4486B in the Virgo cluster presents a single component profile as well and a similar n (i.e. 1/N) value.
Despite all the interesting features mentioned above, we cannot confirm nor rule out that this object is in the background. It does not follow the early-type Antlia members fundamental relations, as it appears shifted towards higher surface brightnesses, fainter magnitudes, or redder colours. M32 would hold a comparable position on the colour-magnitude diagram if it were placed at the Antlia distance. However, FS90 192 does not follow the relation between mean effective surface brightness and luminosity defined by the confirmed cEs. Under the hypothesis that it is a background object, FS90 192 would become an isolated elliptical galaxy of moderate luminosity (highly unlikely), as we have not found any concentration of galaxies in its neighbourhood.
5.4 FS90 110
There is no radial velocity available for FS90 110 and, as stated in Sect.3.4, it could be a background galaxy placed at 120 Mpc. However, it seems to be the most firm candidate for a cE galaxy.
If it was an Antlia member, its projected separation from NGC 3258 would be of the same order as those of M32 from M31, and NGC 5486A from NGC 5486. Moreover, it would be much closer to the dominant galaxy than NGC 4486B to NGC 4486, and its effective radius would be smaller than that of NCG 5846A.
It presents a high central surface brightness in the brightness profile obtained from the ACS image, and its and colour profiles are quite flat, in agreement with what is found for M32. Its brightness profile shows two components in the equivalent radius range 2 – 11.8 arcsec, that seems to be described by N 1 (i.e. n 1) Sérsic indices. It is tempting to suggest that such N index for the outer component might be linked to a truncation of the profile (Erwin, Pohlen & Beckman 2008), due to a possible interaction with NGC 3258. However, such hypothesis should be studied in the light of the confirmed membership status of FS90 110. Furthermore, it would be interesting to test if the outer component of confirmed cE galaxies displaying two components in their brightness profiles, could be fitted by a Sérsic law with N 1 (n 1).
The variation of the ellipticity and position angle vs. radius displayed by FS90 110, resemble those found in M32. These changes occur at a galactocentric radius at which the outer component seems to begin to dominate, in agreement with what Graham (2002) found for M32.
FS90 110 is the only FS90 cE candidate that follows the luminosity vs. mean effective surface brightness relation defined by bright ellipticals, which corresponds to the Kormendy (1977) scaling relation, towards fainter magnitudes, smaller radius, or higher mean effective surface brightness. It also seems to follow the Antlia members’ colour-magnitude relation, though it is located at the red border.
The elongation and twisting of FS90 110’s outermost isophotes in the direction of NGC 3258 are noticeable. That would be consistent with the extremely low surface brightness structure detected in the MOSAIC images, and confirmed with the FORS1 and ACS frames. Such kind of ‘bridge’ that seems to link FS90 110 with its bright partner, would be in agreement with the fact that most confirmed cE galaxies are located in the vicinity of brighter companions. In that sense, it is also remarkable the warped inner structure displayed in the ACS colour map, and confirmed through unsharp masks of FORS1. Quite similar stellar structures are found in numerical simulations (Bekki et al. 2001; Mayer et al. 2006) as a consequence of galaxy interactions.
5.5 Final remarks
A galaxy that is interacting with a more massive partner will feel tidal forces most strongly in its outskirts, while its central region will be less affected (see, for example, Bekki et al. 2001, for a model of the interaction between M32 and M31). As a consequence, it would not be surprising to observe asymmetric and ‘egg-shaped’ outer isophotes, or/and detect low surface brightness stellar ‘tails’, arising from the disruption of the outer regions of the satellite (Mayer et al. 2006). In particular, these faint structures could be observed either like one or two symmetric ‘tails’, depending on projection effects (see fig. 4 in Mayer et al. 2006). The distorted outermost isophotes of FS90 110, and the extremely faint structure detected in the HST, VLT and CTIO images fit quite well in such a scenario.
The similarities in the ellipticity and position angle variations against radius displayed by FS90 110 and FS90 208, which arise at a similar galactocentric radius of arcsec (i.e. in their inner regions), are also remarkable. These kind of variations have already been detected in M32, although not so strongly. All these pieces of evidence lead us to speculate about the possibility that, an object similar to FS90 208 might be the progenitor of a cE galaxy. Thus, it is tempting to look for possible links between these two kind of objects.
We may think that a system with similar characteristics as FS90 208 may lose its outermost regions due to the interaction with a bright companion, then becoming compact. As a consequence, it could also experience a redistribution of its stellar content, that might produce a warped inner structure, a higher central surface brightness, and an attenuation of its ellipticity and position angle variations with radius. Moreover, the bulge-to-disc ratio in such object could increase after losing its outer parts due to the interaction. With regard to this point, it should be noted that the inner component of FS90 110 seems to be 3 times brighter than the outer one, while that of FS90 208 is just 1.6 times brighter in relation with the outer component.
As an aditional point, we recall that the Antlia cluster seems to be particularly rich in S0 galaxies and FS90 208 seems to be one of them. If the evolutionary path of cE galaxies include this kind of objects, S0 rich clusters would arise as favorable environments for the formation of compact galaxies.
Dynamical simulations and the spectroscopically confirmed membership status of FS90 110 and FS90 192, will help to test if any of the above statements is indeed plausible.
Acknowledgements
We would like to thank the referee, Igor Chilingarian, for his useful comments which helped to improve this paper. We are also grateful to S. A. Cellone for valuable discussions and for kindly reading the original manuscript. This research has made use of the NASA/IPAC Extragalactic Database (NED) which is operated by the Jet Propulsion Laboratory, California Institute of Technology, under contract with the National Aeronautics and Space Administration. This work was funded with grants from Consejo Nacional de Investigaciones Científicas y Técnicas de la República Argentina, Agencia Nacional de Promoción Científica Tecnológica and Universidad Nacional de La Plata (Argentina). T.R. is grateful for support from the Chilean Center for Astrophysics, FONDAP No. 15010003.
References
- Alonso et al. (2003) Alonso M. V., Bernardi M., Da Costa L. N., Wegner G., Willmer C. N. A., Pellegrini P. S., Maia M. A. G., 2003, AJ, 125, 2307
- Bassino et al. (2008) Bassino L. P., Richtler T., Dirsch B., 2008, MNRAS, 386, 1145
- Bekki et al. (2001) Bekki K., Couch W. J., Drinkwater M. J., Gregg M. D., 2001, ApJ, 557, L39
- Binggeli et al. (1985) Binggeli B., Sandage A., Tammann G. A., 1985, AJ, 90, 1681
- Binney & Merrifield (1998) Binney J., Merrifield M., 1998, in Galactic Astronomy, Princeton Series in Astrophysics, Princeton University Press, 184
- Canterna (1976) Canterna R., 1976, AJ, 81, 228
- Cellone & Buzzoni (2001) Cellone S. A., Buzzoni A., 2001, A&A, 369, 742
- Cellone & Buzzoni (2005) Cellone S. A., Buzzoni A., 2005, MNRAS, 356, 41
- Chilingarian et al. (2007) Chilingarian I., Cayatte V., Chemin L., Durret F., Laganá T. F., Adami C., Slezak E., 2007, A&A, 466, L21
- Chilingarian et al. (2008) Chilingarian I., Cayatte V., Durret F., Adami C., Balkowski C., Chemin L., Laganá T. F., Prugniel P., 2008, A&A, 486, 85
- Choi et al. (2002) Choi P. I., Guhathakurta P., Johnston K. V., 2002, AJ, 124, 310
- Conselice et al. (2002) Conselice C. J., Gallagher J. S., Wyse R. F. G., 2002, AJ, 123, 2246
- Davidge (1991) Davidge T. J., 1991, AJ, 102, 896
- Djorgovski & Davis (1987) Djorgovski S., Davis M., 1987, ApJ, 313, 59
- de Vaucouleurs et al. (1991) de Vaucouleurs G., de Vaucouleurs A., Corwin H. G., Buta R. J., Paturel G., Fouque P., 1991, Third Reference Catalogue of Bright Galaxies (RC3), Springer-Verlag, New York
- Dirsch et al. (2003) Dirsch B., Richtler T., Bassino L. P., 2003, A&A, 408, 929
- Drinkwater et al. (2001) Drinkwater M. J., Gregg M. D., Holman B. A., Brown M. J. I., 2001, MNRAS, 326, 1076
- Erwin et al. (2008) Erwin P., Pohlen M., Beckman J. E., 2008, AJ, 135, 20
- Ferguson & Sandage (1990) Ferguson H. C., Sandage A., 1990, AJ, 100, 1
- Ferrarese et al. (2006) Ferrarese L. et al., 2006, AJSS, 164, 334
- Forbes & Forte (2001) Forbes D. A., Forte J. C., 2001, MNRAS, 322, 257
- Fukugita et al. (1995) Fukugita M., Shimasaku K., Ichikawa T., 1995, PASP, 107, 945
- Gavazzi et al. (2005) Gavazzi G., Donatti A., Cucciati O., Sabatini S., Boselli A., Davies J., Zibetti S., A&A, 430, 411
- Graham & Worley (2008) Graham A. W., Worley C. C., 2008, MNRAS, accepted (arXiv:0805.3565)
- Graham (2002) Graham A. W., 2002, AJ, 568, L13 (erratum 572, L121)
- Geisler (1996) Geisler D., 1996, AJ, 111, 480
- Jedrzejewski (1987) Jedrzejewski R. I., 1987, MNRAS, 226, 747
- Jerjen et al. (2000) Jerjen H., Kalnajs A., Binggeli B., 2000, A&A, 358, 845
- Kormendy (1977) Kormendy J., 1977, ApJ, 218, 333
- Lauer et al. (1996) Lauer T. R. et al., 1996, ApJ, 471, L79
- Lauer et al. (1998) Lauer T. R., Faber S. M., Ajhar E. A., Grillmair C. J., Scowen P. A., 1998, AJ, 116, 2263
- Lisker et al. (2006a) Lisker T., Glatt K., Westera P., Grebel E. K., 2006a, AJ, 132, 2432
- Lisker et al. (2006b) Lisker T., Grebel E. K., Binggeli B., 2006b, AJ, 132, 497
- MacArthur et al. (2003) MacArthur L. A., Courteau S., Holtzman J. A., 2003, ApJ, 582, 689
- Mahdavi et al. (2005) Mahdavi A., Trentham N., Tully R. B., 2005, AJ, 130, 1502
- Mateo (1998) Mateo M. L., 1998, ARA&A, 36, 435
- Mayer et al. (2006) Mayer L., Mastropietro C., Wadsley J., Stadel J., Moore B., 2006, MNRAS, 369, 1021
- Mieske et al. (2005) Mieske S., Infante L., Hilker M., Hertling G., Blakeslee J. P., Benítez N., Ford H., Zekser K., 2005, A&A, 430, L25
- Nakazawa et al. (2000) Nakazawa K., Makishima K., Fukazawa Y., Tamura T., 2000, PASJ, 52, 623
- Nieto & Prugniel (1987) Nieto J. -L., Prugniel P., 1987, A&A, 186, 30
- Pedersen, Yoshii & Sommer-Larsen (1997) Pedersen K., Yoshii Y., Sommer-Larsen J., 1997, ApJ, 485, L17
- Peletier (1993) Peletier R. F., 1993, A&A, 271, 51
- Rose et al. (2005) Rose J. A., Arimoto N., Caldwell N., Schiavon R., Vazdekis A., Yamada Y., 2005, AJ, 129, 712
- Sánchez-Blázquez, Gorgas & Cardiel (2006) Sánchez-Blázquez P., Gorgas J., Cardiel N., 2006, A&A, 457, 823
- Sandage & Binggeli (1984) Sandage A., Binggeli B., 1984, AJ, 89, 919
- Sirianni et al. (2005) Sirianni M. et al., 2005, PASP, 117, 1049
- Schlegel et al. (1998) Schlegel D., Finkbeiner D., Davis M., 1998, ApJ, 500, 525
- Sérsic (1968) Sérsic J. L., 1968, Atlas de Galaxias Australes (Córdoba: Obs. Astron., Univ. Nac. Córdoba)
- Smith Castelli et al. (2008) Smith Castelli A. V., Bassino L. P., Richtler T., Cellone S. A., Aruta C., Infante L., 2008, MNRAS, 386, 2311 (Paper I)
- Tonry et al. (2001) Tonry J. L., Dressler A., Blakeslee J. P., Ajhar E. A.,Fletcher A. B., Luppino G. A. Metzger M. R., Moore C. B., 2001, AJ, 546, 681
- Trujillo et al. (2001a) Trujillo I., Aguerri J., Cepa A. L., Gutiérrez C. M., 2001a, MNRAS, 321, 269
- Trujillo et al. (2001b) Trujillo I., Aguerri J., Cepa A. L., Gutiérrez C. M., 2001a, MNRAS, 328, 977
- Ziegler & Bender (1998) Ziegler B. L., Bender R., 1998, A&A, 330, 819