Tracking heterogeneous dynamics during the -relaxation of a simple glass-former
Abstract
We study the relaxation process in a simple glass-former - the KA lattice gas model. We show that, for this model, structural relaxation is due to slow percolation of regions of co-operatively moving particles, which leads to heterogeneous dynamics of the system. We find that the size distribution of these regions is given by a power-law and that their formation is encoded in the initial structure of the particles, with the memory of initial configuration increasingly retained with increasing density.
Glass-forming systems are disordered materials whose relaxation dynamics becomes extremely slow on decreasing the temperature or increasing the density. Despite intensive research in this domain, a proper understanding of these materials is still missing deben ; ediger . The observation, in experiments and simulations, of spatio-temporal dynamical heterogeneity in glass-formers has been an important step forward in elucidating the mechanism for relaxation processes and currently considerable research is being focused on understanding the lifetime and spatial extent of these dynamical heterogeneities.
A key question in this domain is the conundrum regarding whether or not there is a causal link between structural properties of glass-forming systems and their dynamical behavior. It has recently been shown harro that the spatial heterogeneity in the propensity of particles to move is correlated with the local environment of the particles, characterized by the local Debye-Waller factor. However, this influence seems to exist only over timescales which are much less than the structural relaxation time appi . It was also observed that structural properties are indeed correlated with collective dynamical fluctuations, but no quantitative analysis was made ludorob . More recently, it has also been reported harro1 that for a supercooled liquid configuration, its localized low-frequency normal modes correlate with the irreversible structural reorganization of its constituent particles.
In recent times, extensive studies of kinetically constrained models (KCM-s) kcm , which are one of the simplest models showing glassy dynamics, have been carried out in order to understand their relaxation process. These models, which are motivated by the hypothesis that the slow dynamics in glass-formers is only due to geometrical constraints, show heterogeneous dynamics similar to real glass-formers kcmdyn . In this Letter, we study one such KCM - the Kob-Andersen (KA) lattice gas kob in which particles are allowed to move on a lattice following certain dynamical rules and which at high densities shows signatures of apparently diverging relaxation times kob ; franz ; pitard . Recently it has been proven analytically toni and numerically ludofinite that for this model there exists no dynamical transition at finite density, , and it was argued toni that eventually, due to the presence of migrating macro-vacancies, the system relaxes, albeit extremely slowly. However, from a practical point of view this model still is a good model for a glass-forming systems. Using Monte Carlo simulations we show that its structural relaxation is related to the growth of mobile regions and that this process quickly slows down with increasing , resulting in the observed slow dynamics. We also demonstrate that the formation of the mobile regions is directly related to structural properties of the system.
We have studied the 3d version of the KA model: particles populate a cubic lattice of size with the constraint that a lattice site can be occupied by only one particle. All possible configurations have the same energy and thus the same Boltzmann weight. The imposed stochastic dynamics consists of the following process: A randomly selected particle can move to any one of the neighboring empty lattice site provided it has or fewer occupied nearest neighbor site and that the target empty site has or fewer occupied nearest neighbor sites. A choice of results in glassy dynamics for this model kob . For efficient sampling of the configuration space at high , we have carried out event-driven Monte Carlo kob simulations of the model. Using periodic boundary conditions, we have investigated system sizes , 30, and 50, which avoid finite size effects, with densities spanning from to .
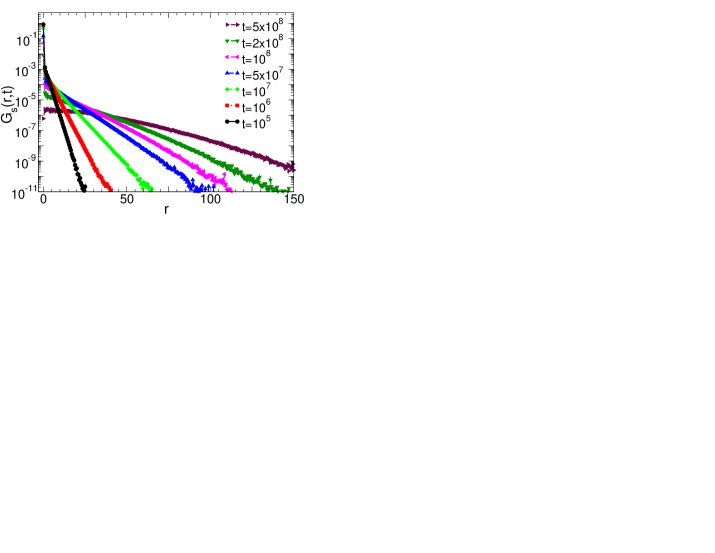
Experiments and simulations in which the motion of single particles were tracked have helped to demonstrate the existence of heterogeneous dynamics in glassy systems ediger . E.g., by measuring the self part of the van Hove function , i.e. the distribution of particle displacements (, where denotes the position of particle at time ), it has been possible to demonstrate that the particles have varying mobilities. In Fig. 1, we show for different times , measured in units of Monte Carlo steps, at . For diffusive motion, is a Gaussian and we observe that for the KA model, like other glass-formers szamel1 , this Gaussian behavior is only observed at times () that are much larger than the structural relaxation time (defined as the time at which the self-intermediate scattering function has decayed to , which at is ). At intermediates times, we see that has an exponential tail, a signature of the presence of rare events in the dynamics of the particles, similar to other glassy systems pinaki . Thus we can conclude that while most of the particles remain frozen at their initial positions (resulting in large values for ), there is a small population which is extremely mobile, i.e. the system has a very heterogeneous dynamics.
By tracking the mobile particles, i.e. particles which contribute to the tail of , we see that at short times they explore a compact region (a “blob”) around their initial locations. With increasing these blobs slowly expand and coalesce with other blobs to form a labyrinthine structure. This structure allows particles, which were hitherto confined to one blob, to travel longer distances. In Fig. 2 we have plotted the lattice sites (marked by green and black spheres) visited by two such mobile particles at and (at this density, ). It can be clearly seen that the dynamics is spatially heterogeneous since the trajectories consist of connected blobs. Note that initially each blob is a region of cooperative motion since all the particles which occupy these lattice points are found to be mobile. As the backbone is formed, particles from one blob begin to explore other blobs. The relaxation of the system thus happens with the slow growth of this backbone, within which the particles can move relatively quickly. This is demonstrated in Fig. 2 : indeed, the two trajectories overlap even though they originate from two different lattice sites which initially did not belong to the same blob.
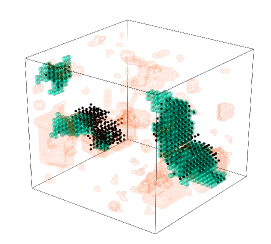
Further insight into the spatial nature of the relaxation process can be obtained by observing the so-called “mobility regions” pan ; gar2 ; lawlor : A lattice site is defined to be an “active site” if either a particle or a vacancy has moved out of it during the time of observation and the collection of these sites constitute the mobility regions. Earlier studies of KCM-s have shown that the active sites tend to cluster and act as seeds for subsequent mobility pan ; gar2 ; lawlor and that it is possible to extract from the mobility regions a lengthscale which increases with density pan . In Fig. 2 we have also included the location of the active sites and we can see that these lattice sites are indeed clustered in space (marked by the red blobby shapes) and have a labyrinthine structure. It gives us an idea of the structure of pathways, at high densities, available to the mobile particles for exploration. We can clearly see that, on this time-scale, the two mobile particles have only explored a part of the available volume and that the geometry of the mobility regions and the blob-structure of the trajectories are intimately connected to each other.
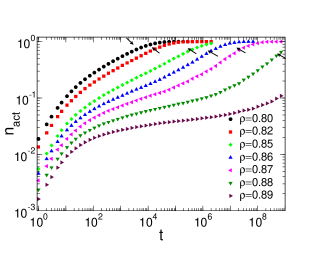
The number density of active sites, , allows us to estimate the volume accessible to the mobile particles and in Fig. 3 we plot for different . We see that, at short times, increases quickly and we find with , independent of . This regime corresponds to the initial growth of the blobs. Subsequently the shape of depends strongly on . For the number of inactive sites, , decays with a stretched exponential tail, with a stretching exponent of around , a functional form that is found for all . At even larger , shows three regimes, with the second regime being a period of extremely slow growth, almost logarithmic and thus similar to the coarsening process in disordered media logs . Note that at short the typical distance between the blobs increases with and the growth of the blobs slows down with increasing , since it needs the presence of active sites (which are rare at high density). This is the reason why the increase of at intermediate times becomes very slow with increasing . We also observe that at , which is higher than the density of at which an apparent divergence of relaxation timescales was observed kob , is still an increasing function, suggesting that the system will eventually relax toni . Note that although these three regimes are in qualitative agreement with the predictions of Ref. toni , there are important differences since, e.g., the diffusion of macro-vacancies discussed in Ref. toni would lead to a linear growth of at long times, a behaviour which is not seen in Fig. 3. This might be due to the fact that the calculations presented in Ref. toni apply only at densities that are extremely close to 1.0.
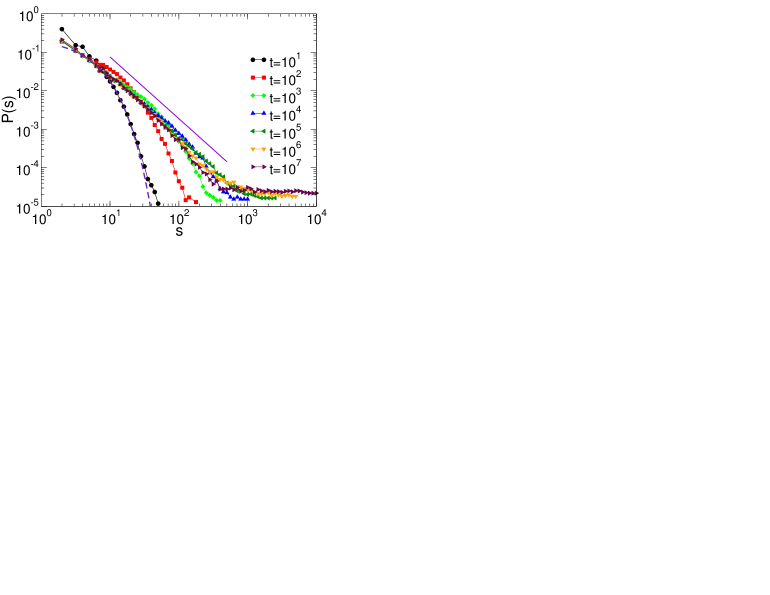
In order to characterize the geometry of the growing clusters of active sites we have calculated , the distribution of clusters that have exactly size . In Fig. 4, we have plotted for and different times. At short times, , has an exponential shape. This corresponds to the initial geometry of active sites at few random locations when particles explore their neighborhood. With increasing time quickly transforms into a power-law, , with an exponent . This indicates that the growth process is different from random percolation for which . This difference is likely related to the fact that there is a wide variation in the size of the cooperatively rearranging regions seen at short times. At even later times, the largest cluster starts growing and the tail in shifts to larger and larger sizes, until the entire space is filled up. Note that the observed largest cluster dependens on system-size and thus the tail of is affected by finite-size effects.
Finally we investigate to what extent the dynamics is encoded in the structure. We have seen that structural relaxation is correlated with the development of the mobile regions. Therefore it is interesting to check how the properties of these regions depend on the trajectories that start from the same initial configuration. For this, we check along several such trajectories how different are the configurations of active sites formed at the same observation time. To quantify that, we define the overlap function , where , with if site is active at time and otherwise. is the average over the isoconfigurational ensemble harro , i.e. the ensemble of all possible trajectories starting from the same configuration of which and are two different members. Defined in this way, if at time the configuration of active sites for two different trajectories are exactly the same and if the two configurations are totally different, apart from the trivial statistical overlap. Thus is a direct measure for the influence of the initial structure on the mobility regions.
In Fig. 5, we show the time dependence of for different . At short times is independent of and its value is small since the mobile particles can find random directions to explore, which result in different configurations of active sites and hence a small . Subsequently has a peak at a time which approximately corresponds to the time at which enters the final regime of growth, see Fig. 3, and which is much smaller than (marked by arrows). For large value of the height of this peak is close to unity and it becomes extremely broad so that is quite large even at . This shows that the configuration of active sites is, in a broad time window, basically independent of the trajectory and thus encoded in the initial structure, even for times of the order of (but depends of course on the initial configuration). Note that these results seem to be in contradiction to the claims made in Ref. appi since there it was argued that the structure influences the dynamics only on time scales much shorter than . However, in that work the authors considered this influence on the level of individual particles whereas the overlap considered here is a collective quantity. Therefore there is not necessarily a contradiction.
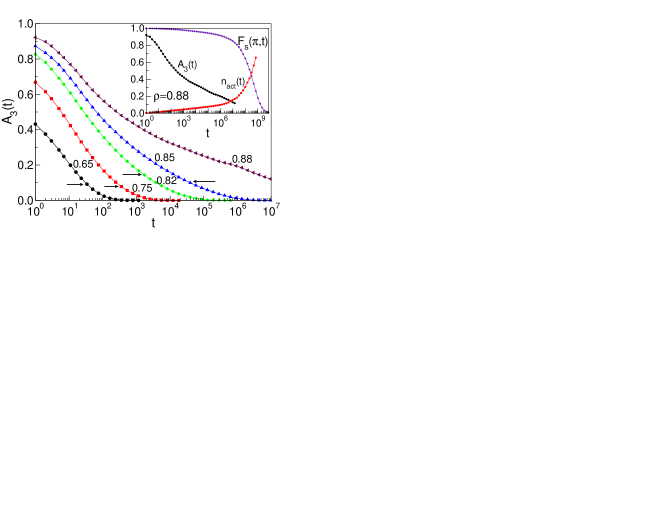
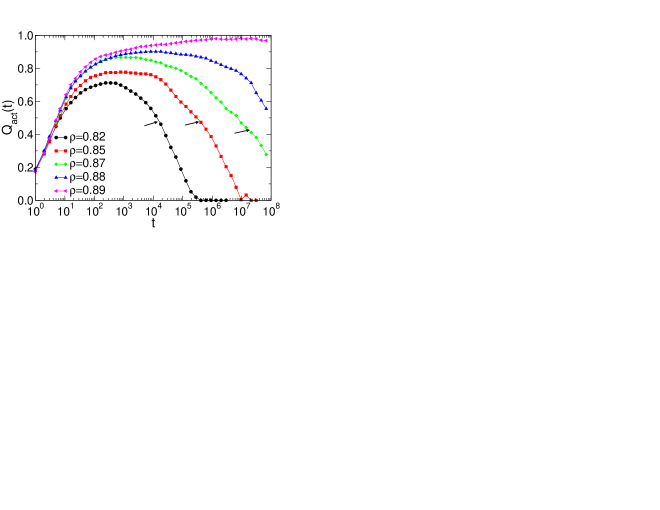
What structural property determines mobility? It is obvious that for a site to be active, it needs empty space in its neighborhood. Earlier work on lattice models has shown that the high propensity sites are located near clusters of empty sites gar2 . In order to investigate the relation between structure and mobility we define another overlap function. A lattice site is considered to be a generalized vacancy of type if the site and its six nearest neighbors contains a total of at least holes. Then we calculate, as a function of time, the overlap of the active sites with these generalized vacancies. The quantity we measure is . Here, if at the site is a generalized vacancy of type and otherwise. Thus, is the probability that a generalized vacancy of type in the configuration at is an active site at time , with the trivial overlap (the density of generalized vacancies of type in the configuration at ) subtracted. Such a quantity enables us to have a good measure of the correlation between structure and dynamics. For low density, i.e. , has a fast decay, see Fig. 6. (Other value of have a qualitatively similar behavior.) With increasing , the characteristic time-scale for the decay increases with the tail becoming stretched in shape, the underlying slowing down of the relaxation process resulting in the retention of the memory for longer time. In the inset of Fig. 6, we have plotted different correlation functions at : The overlap function , the self-intermediate scattering function and the fraction of active sites . At this density, the -relaxation time . For this time-scale, the fraction of active sites is . However, if one extrapolates to these time-scales, the overlap is small. Therefore, although measurement of showed that the configuration of active sites, at , is significantly determined by initial structure, the use of generalized vacancies does not fully demonstrate this strong dependence. Hence, a better characterization of initial structure is necessary for improving prediction for formation of mobile regions.
In conclusion, we have shown that, for the KA lattice gas, the relaxation occurs via the percolation of mobile regions in which particles move cooperatively. These regions are encoded in the initial structure of the system with a memory time that is on the order of . We emphasize, however, that the initial structure does not necessarily determine the trajectory of an individual particle but only the location and the shape of the regions in which cooperative dynamics is observed.
We thank L. Berthier and G. Biroli for useful discussions and acknowledge CEFIPRA Project 3004-1 and ANR Grant TSANET for financial support.
References
- (1) P. G. Debenedetti et al, Nature 410, 259 (2001).
- (2) M. A. Ediger, Annu. Rev. Phys. Chem. 51, 99 (2000).
- (3) A. Widmer-Cooper et al, Phys. Rev. Lett. 96, 185701 (2006).
- (4) G. A. Appignanesi et al, Phys. Rev. Lett. 96, 237803 (2006).
- (5) L. Berthier et al, Phys. Rev. E 76, 041509 (2007).
- (6) A. Widmer-Cooper et al, Nature Physics 4, 711 (2008).
- (7) F. Ritort and P. Sollich, Adv. Phys. 52, 219 (2003).
- (8) M. Foley et al, J. Chem. Phys., 98, 5069 (1993); J.P. Garrahan et al, Phys. Rev. Lett. 89, 035704 (2002); J. Jäckle, J. Phys.: Condens. Matt, 14, 1423 (2002); L. Berthier et al, Europhys. Lett. 69, 320 (2005).
- (9) W. Kob et al, Phys. Rev. E. 48 4364 (1993).
- (10) S. Franz et al, Phys. Rev. E 65 021506 (2002).
- (11) E. Marinari et al, Europhys. Lett. 69, 235 (2005).
- (12) C. Toninelli et al, Phys. Rev. Lett. 92, 185504 (2004); J. Stat. Phys. 120, 167 (2005).
- (13) L. Berthier, Phys. Rev. Lett. 91, 055701 (2003).
- (14) G. Szamel et al, Phys. Rev. E 73, 011504 (2006).
- (15) P. Chaudhuri et al, Phys. Rev. Lett. 99, 060604 (2007).
- (16) A. C. Pan et al, Phys. Rev. E. 72, 041106 (2005).
- (17) L. O. Hedges et al, J. Phys.: Cond. Matt. 19, 205124 (2007).
- (18) A. Lawlor et al, Phys. Rev. E 72, 021401 (2005).
- (19) A. J. Bray, Adv. in Phys., 43 357 (1994).