1–6
Star cluster evolution in the Magellanic Clouds revisited
Abstract
The evolution of star clusters in the Magellanic Clouds has been the subject of significant recent controversy, particularly regarding the importance and length of the earliest, largely mass-independent disruption phase (referred to as ‘infant mortality’). Here, we take a fresh approach to the problem, using a large, independent, and homogeneous data set of imaging observations, from which we obtain the cluster age and mass distributions in both the Large and Small Magelanic Clouds (LMC, SMC) in a self-consistent manner. We conclude that the (optically selected) SMC star cluster population has undergone at most 30% (1) infant mortality between the age range from about 3–10 Myr, to that of approximately 40–160 Myr. We rule out a 90% cluster mortality rate per decade of age (for the full age range up to yr) at a 6 level. Using a simple approach, we derive a ‘characteristic’ cluster disruption time-scale for the cluster population in the LMC that implies that we are observing the initial cluster mass function (CMF). Preliminary results suggest that the LMC cluster population may be affected by % infant mortality.
keywords:
globular clusters: general, open clusters and associations: general, galaxies: evolution, Magellanic Clouds, galaxies: star clusters1 Introduction
One of the most important diagnostics used to infer the formation history, and to follow the evolution of an entire star cluster population is the ‘cluster mass function’ (CMF; i.e., the number of clusters per constant logarithmic cluster mass interval, ). The initial cluster mass function (ICMF) is of particular importance. The debate regarding the shape of the ICMF, and of the CMF in general, is presently very much alive, both observationally and theoretically. This is so because it bears on the very essence of the star-forming processes, as well as on the formation, assembly history, and evolution of the clusters’ host galaxies on cosmological time-scales. Yet, the observable at hand is the cluster luminosity function (CLF; i.e., the number of objects per unit magnitude, ).
The discovery of star clusters with the high luminosities and the compact sizes expected for (old) globular clusters (GCs) at young ages facilitated by the Hubble Space Telescope (HST) has prompted renewed interest in the evolution of the CLF (and CMF) of massive star clusters. Starting with the seminal work by Elson & Fall (1985) on the young Large Magellanic Cloud (LMC) cluster system (with ages yr), an ever increasing body of evidence seems to imply that the CLFs of young massive clusters (YMCs) are well described by a power law of the form , equivalent to a cluster luminosity spectrum , with a spectral index (e.g., Whitmore & Schweizer 1995; Elmegreen & Efremov 1997; Miller et al. 1997; Whitmore et al. 1999; Whitmore et al. 2002; Bik et al. 2003; de Grijs et al. 2003; Hunter et al. 2003; Lee & Lee 2005; see also Elmegreen 2002). Since the spectral index, , of the observed CLFs resembles the slope of the high-mass regime of the (lognormal) old GC mass spectrum (; McLaughlin 1994), this observational evidence has led to the popular theoretical prediction that not only a power law, but any initial CLF (and CMF) will be rapidly transformed into a lognormal distribution because of (i) stellar evolutionary fading of the lowest-luminosity (and therefore lowest-mass, for a given age) objects to below the detection limit; and (ii) disruption of the low-mass clusters due to both interactions with the gravitational field of the host galaxy, and internal two-body relaxation effects leading to enhanced cluster evaporation (e.g., Elmegreen & Efremov 1997; Gnedin & Ostriker 1997; Ostriker & Gnedin 1997; Fall & Zhang 2001; Prieto & Gnedin 2007).
However, because of observational selection effects it is often impossible to probe the CLFs of YMC systems to the depth required to fully reveal any useful evolutionary signatures. As such, the young populous cluster systems in the Magellanic Clouds are as yet the best available calibrators for the canonical young CLFs that form the basis of most theoretical attempts to explain the evolution of the CLF and CMF.111We point out, however, that with the latest HST/Advanced Camera for Surveys observations of the Antennae interacting galaxies, we are now finally getting to the point where the young (power-law) CLF shape appears to be confirmed independently down to sufficient photometric depths and for larger samples containing more massive clusters than in the Magellanic Clouds (B. Rothberg, priv. comm.). It is therefore of paramount importance to understand the Magellanic Cloud cluster systems in detail.
2 Early cluster evolution in the Magellanic Clouds
The early evolution of the star cluster population in the Small Magellanic Cloud (SMC) has been the subject of considerable recent interest (e.g., Rafelski & Zaritsky 2005; Chandar, Fall & Whitmore 2006; Chiosi et al. 2006; Gieles, Lamers & Portegies Zwart 2007; de Grijs & Goodwin 2008). The key issue of contention is whether the SMC’s star cluster system has been subject to the significant early cluster disruption processes observed in ‘normal’, interacting and starburst galaxies, commonly referred to as ‘infant mortality’. Chandar et al. (2006) argue that the SMC has been losing up to 90% of its star clusters per decade of age, at least for ages from up to yr, whereas Gieles et al. (2007) conclude that there is no such evidence for a rapid decline in the cluster population, and that the decreasing number of clusters with increasing age is simply caused by evolutionary fading of their stellar populations in a magnitude-limited cluster sample.
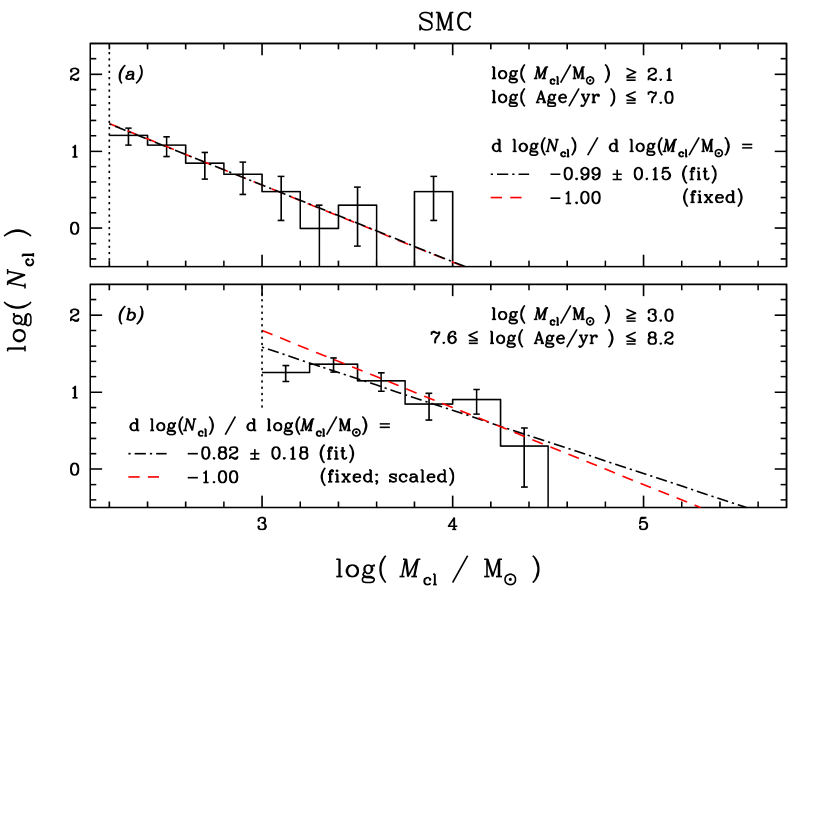
In de Grijs & Goodwin (2008) we set out to shed light on this controversy. We adopted a fresh approach to the problem, using an independent, homogeneous data set of imaging observations (cf. Hunter et al. 2003), from which we obtained the cluster age distribution in a self-consistent manner. In Fig. 1 we present the CMFs for two subsets of our SMC cluster sample, selected based on their age distributions. In all panels of Fig. 1, we have overplotted CMFs with the canonical slope of (corresponding to a slope of in units of , used in these panels).
The rationale for adopting as our youngest subsample (Fig. 1a) all clusters with ages Myr is that at these young ages, the vast majority of the star clusters present will still be detectable, even in the presence of early gas expulsion (e.g., Goodwin & Bastian 2006) – as long as they are optically conspicuous. Fig. 1b includes our sample clusters with ages from 40 Myr to 160 Myr. While the upper age limit ensures the full inclusion of the clusters affected by the onset of the AGB stage, its exact value is rather unimportant. The lower age limit of this subsample is crucial, however. As shown by Goodwin & Bastian (2006), most dissolving clusters will have dispersed by an age of Myr, while the surviving clusters will have returned to an equilibrium state by Myr, when some of the early expansion will have been reversed, depending on the effective star-formation efficiency. This latter age is therefore a good lower boundary to assess the surviving star cluster population.
We explicitly exclude any star clusters aged between 10 and 40 Myr from our analysis. In this age range, it is likely that dissolving star clusters that will not survive beyond about 30–40 Myr might still be detectable and therefore possibly contaminate our sample. In addition, this is the age range in which early gas expulsion causes rapid cluster expansion, before settling back into equilibrium at smaller radii; because of the expanded nature of at least part of the cluster sample, we might not be able to detect some of the lower-luminosity (and hence lower-mass) clusters that would again show up beyond an age of Myr.
In the simplest case, in which the cluster formation rate has remained roughly constant throughout the SMC’s evolution (see, e.g., Boutloukos & Lamers 2003, their fig. 10; see also Gieles et al. 2007), the number of clusters would simply scale with the age range covered. In Fig. 1b we show the canonical CMF scaled from the best-fitting locus in Fig. 1a by the difference in (linear) age range between the panels (see de Grijs & Goodwin 2008 for details). The scaled canonical CMF in Fig. 1b is an almost perfect fit to the observational CMF (irrespective of the mass binning employed). This implies that the SMC cluster system has not been affected by any significant amount of cluster infant mortality for cluster masses greater than a few M⊙. Based on a detailed assessment of the uncertainties in both the CMFs and the age range covered by our youngest subsample, we can limit the extent of infant mortality between the youngest and the intermediate age range to a maximum of % (). We rule out a % (infant) mortality rate per decade of age at a level. This result is in excellent agreement with that of Gieles et al. (2007).
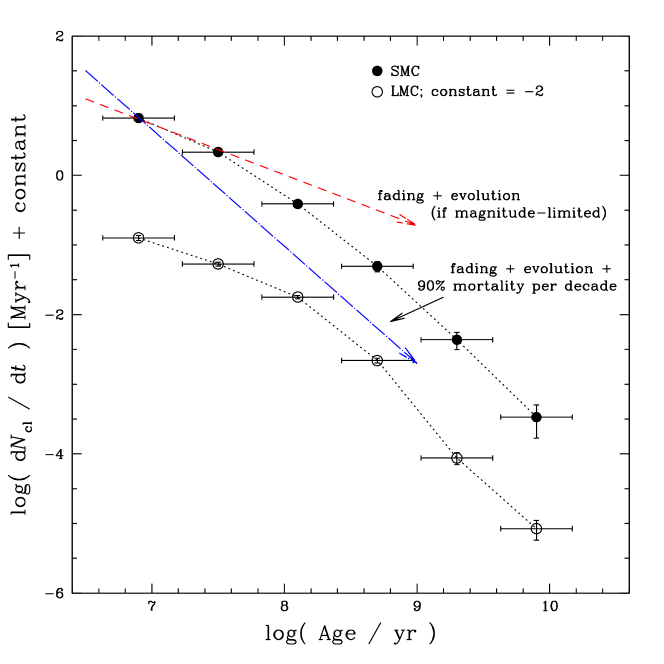
Moreover, Gieles et al. (2007) derived that for a magnitude-limited sample the decline in the number of observed clusters per unit age range, , as a function of age is graphically described by a slope of . In Fig. 2, we show the expected effects of evolutionary fading of a magnitude-limited cluster population as the dashed arrow. It is immediately clear that, for the SMC cluster population analysed in de Grijs & Goodwin (2008), the decline in the age distribution up to can indeed be entirely attributed to evolutionary fading. The expected effects of evolutionary fading combined with a 90% disruption rate are shown as the dash-dotted arrow in Fig. 2. The arrow clearly does not fit the observed age distribution, if we require it to pass through our youngest data point. We note, however, that the slope of this latter arrow is very similar to that of the age distribution of the full SMC sample for ages in excess of a few yr, when secular disruption is likely to take over.
3 Cluster disruption in the LMC
To derive the CMF of mass-limited LMC cluster subsamples, de Grijs & Anders (2006) re-analysed the UBVR broad-band data of Hunter et al. (2003). They derived that the timescale on which a cluster is expected to disrupt is , as recently confirmed by Parmentier & de Grijs (2008) based on a detailed comparison with numerical simulations.222In fact, Parmentier & de Grijs (2008) concluded that the data do not allow us to constrain the characteristic cluster disruption timescale for a M⊙ cluster to better than . Such a long cluster disruption timescale results from the low-density environment of the Magellanic Clouds. It guarantees that the observed cluster mass distributions have not yet been altered significantly by secular dynamical evolution, i.e. clusters already affected by ongoing disruption have faded to below the completeness limit (see de Grijs & Anders 2006, their fig. 8). As a result, the observed mass distributions are the initial distributions.
We will investigate the possible effects of infant mortality among the LMC cluster population in detail in a forthcoming paper (Goodwin et al., in prep.). However, a first glance at the LMC cluster population’s age distribution in Fig. 2 indicates that the number of clusters populating the first yr can likely be fully explained by simple evolutionary fading of a magnitude-limited cluster sample, as we also concluded for the SMC, without the need to invoke infant mortality for masses M⊙.
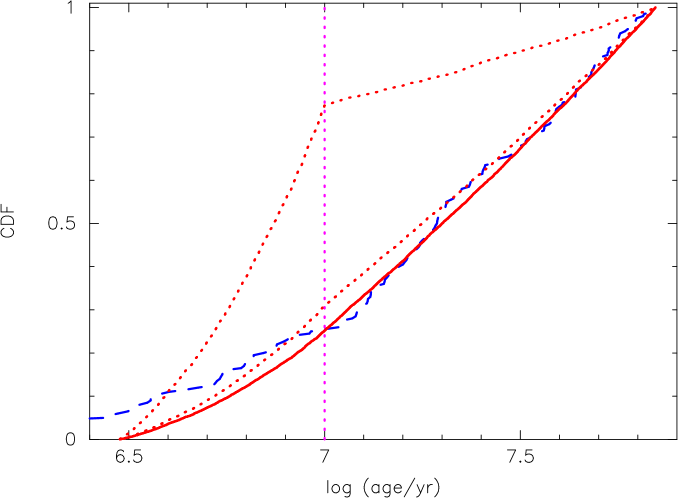
In Fig. 3 we display the LMC cluster population’s cumulative distribution function (CDF) as a function of age (dashed line). This CDF has been smoothed by the uncertainties in the cluster ages determined for each cluster individually by de Grijs & Anders (2006). We compare the observed CDF to that of a model with a constant cluster-formation rate with and ICMF index of . These clusters are evolved according to the Lamers et al. (2007) disruption scenario without invoking infant mortality, assuming standard stellar evolution. Since cluster ages Myr are highly uncertain, only the fit beyond 10 Myr should be considered (solid line).
The red dotted lines illustrate what would be expected for 25% (bottom) and 90% (top) sudden infant mortality at an age of 10 Myr (slightly extended mortality would result in a more smoothed appearance of these lines). The best-fit model at 10 Myr and afterwards suggests, for a constant cluster-formation rate, % mass-independent infant mortality.
We are currently investigating a number of possible caveats that may be associated with this preliminary analysis. In particular, could the apparent absence of infant mortality be hidden by our assumption of a constant cluster-formation rate? Alternatively (or additionally), could mass-dependent infant mortality be at work in the LMC (and possibly the SMC)?
Acknowledgements.
We are grateful to Peter Anders and Geneviève Parmentier for essential contributions.References
- [] Bik A., Lamers H. J. G. L. M., Bastian N., Panagia N., Romaniello M., 2003, A&A, 397, 473
- [] Boutloukos S. G., Lamers H. J. G. L. M., 2003, MNRAS, 338, 717
- [] Chandar R., Fall S. M., Whitmore B. C., 2006, ApJ, 650, L111
- [] Chiosi E., Vallenari A., Held E. V., Rizzi L., Moretti A., 2006, A&A, 452, 179
- [] de Grijs R., Anders P., 2006, MNRAS, 366, 295
- [] de Grijs R., Anders P., Lynds R., Bastian N., Lamers H. J. G. L. M., O’Neill E. J. Jr., 2003, MNRAS, 343, 1285
- [] de Grijs R., Goodwin S. P., 2008, MNRAS, 383, 1000
- [] Elmegreen B. G., 2002, ApJ, 564, 773
- [] Elmegreen B. G., Efremov Y. N., 1997, ApJ 480, 235
- [] Elson R. A. W., Fall S. M., 1985, ApJ, 299, 211
- [] Fall S. M., Zhang Q., 2001, ApJ, 561, 751
- [] Gieles M., Lamers H.J.G.L.M., Portegies Zwart S.F., 2007, ApJ, 668, 268
- [] Gnedin O. Y., Ostriker J. P., 1997, ApJ, 474, 223
- [] Goodwin S. P., Bastian N., 2006, MNRAS, 373, 752
- [] Hunter D. A., Elmegreen B. G., Dupuy T. J., Mortonson M., 2003, AJ, 126, 1836
- [] Lamers H. J. G. L. M., Gieles M., Bastian N., Baumgardt H., Kharchenko N. V., Portegies Zwart S., 2005, A&A, 441, 117
- [] Lee H. J., Lee M. G., 2005, JKAS, 38, 345
- [] McLaughlin D. E., 1994, PASP, 106, 47
- [] Miller B. W., Whitmore B. C., Schweizer F., Fall S. M., 1997, AJ, 114, 2381
- [] Ostriker J. P., Gnedin O. Y., 1997, ApJ, 487, 667
- [] Parmentier G., de Grijs R., 2008, MNRAS, 383, 1103
- [] Prieto J. L., Gnedin O. Y., 2006, ApJ, submitted (astro-ph/0608069)
- [] Rafelski M., Zaritsky D., 2005, AJ, 129, 2701
- [] Whitmore B. C., Schweizer F., 1995, AJ, 109, 960
- [] Whitmore B. C., Schweizer F., Kundu A., Miller B.W., 2002, AJ, 124, 147
- [] Whitmore B. C., Zhang Q., Leitherer C., Fall S. M., Schweizer F., Miller B. W., 1999, AJ, 118, 1551