12000 Jefferson Avenue, Newport News, VA23606
E-mail: burkert@jlab.org
Electromagnetic Transition Form Factors of Nucleon Resonances.
Abstract
Recent measurements of nucleon resonance transition form factors with CLAS at Jefferson Lab are discussed. The new data resolve a long-standing puzzle of the nature of the Roper resonance, and confirm the assertion of the symmetric constituent quark model of the Roper as the first radial excitation of the nucleon. The data on high production confirm the slow fall off of the transition form factor with , and better constrain the branching ratios and . For the first time, the longitudinal transition amplitude to the was extracted from the data. Also, new results on the transition amplitudes for the resonance are presented showing a rapid transition from helicity 3/2 dominance seen at the real photon point to helicty 1/2 dominance at higher .
pacs:
13.60.le, 13.88.+e1 Introduction
Electroexcitation of nucleon resonances has long been recognized as a sensitive tool in the exploration of the complex nucleon structure at varying distances scales. Resonances play an important role in fully understanding the spin structure of the nucleon. More than 80% of the helicity-dependent integrated total photoabsorption cross section difference (GDH integral) are the result of the transition buli ; mami , and at a photon virtuality GeV2 more than 50% of the first moment of the spin structure function for the proton are due to contributions of the resonance region at GeV fatemi03 , and are crucial for describing the entire range of and for the proton and proton-neutron difference respectively prok08 ; ioffe ; deur .
Nucleon resonances are of high interest in their own rights. Electroexcitation of resonances allows us to probe the internal structure of the excited state knowing the structure of the ground state. The most comprehensive predictions of the resonance excitation spectrum come from the various implementation of the symmetric constituent quark model based on broken symmetry isgur . Other models predict a different excitation spectrum, e.g. through a diquark-quark picture, or through dynamical baryon-meson interactions. The different resonance models not only predict different excitation spectra but also different dependence of transition form factors. Mapping out the transition form factors will tell us a great deal about the underlying quark or hadronic structure.
CLAS is the first full acceptance instrument with sufficient resolution to measure exclusive electroproduction of mesons with the goal of studying the excitation of nucleon resonances in detail. The entire resonance mass region, a large range in the photon virtuality can be studied, and many meson final states are measured simultaneously burkert-lee . In this talk I discuss recent results from the electroproduction of single pions to study several well-known excited states.
2 The transition
An interesting aspect of nucleon structure at low energies is a possible quadrupole deformation of the nucleon’s lowest excited state, the . Such a deformation would be evident in non-zero values of the quadrupole transition amplitude from the nucleon to the buchmann . In models with spherical symmetry, the transition is simply due to a magnetic dipole mediated by a spin flip, and . Dynamically, quadrupole deformations may arise through the interaction of the photon with the pion cloud sato ; yang or through the one-gluon exchange mechanism koniuk . At asymptotic momentum transfer, a model-independent prediction of helicity conservation requires . An interpretation of in terms of a quadrupole deformation can thus only be valid at low momentum transfer.
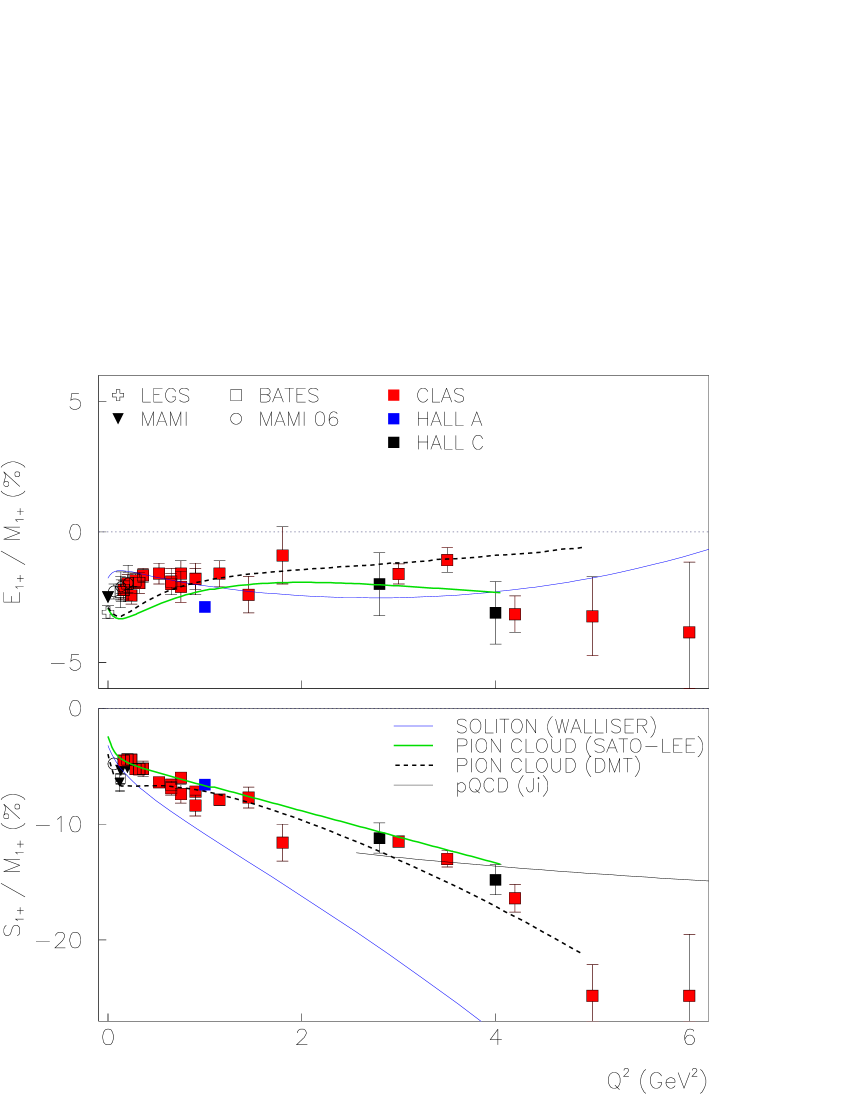
Results of the multipole analysis of the JLab data kjoo ; frolov ; ungaro ; kelly as well as low data from MAMI mami-delta ; beck , Bates bates-delta and LEGS legs are shown in Fig.1. A consistent picture emerges from these precise data.
-
•
remains negative, small and nearly constant in the entire range GeV2.
-
•
There are no indications that leading pQCD contributions are important as they would result in carlson .
-
•
also remains negative, but its magnitude strongly rises with .
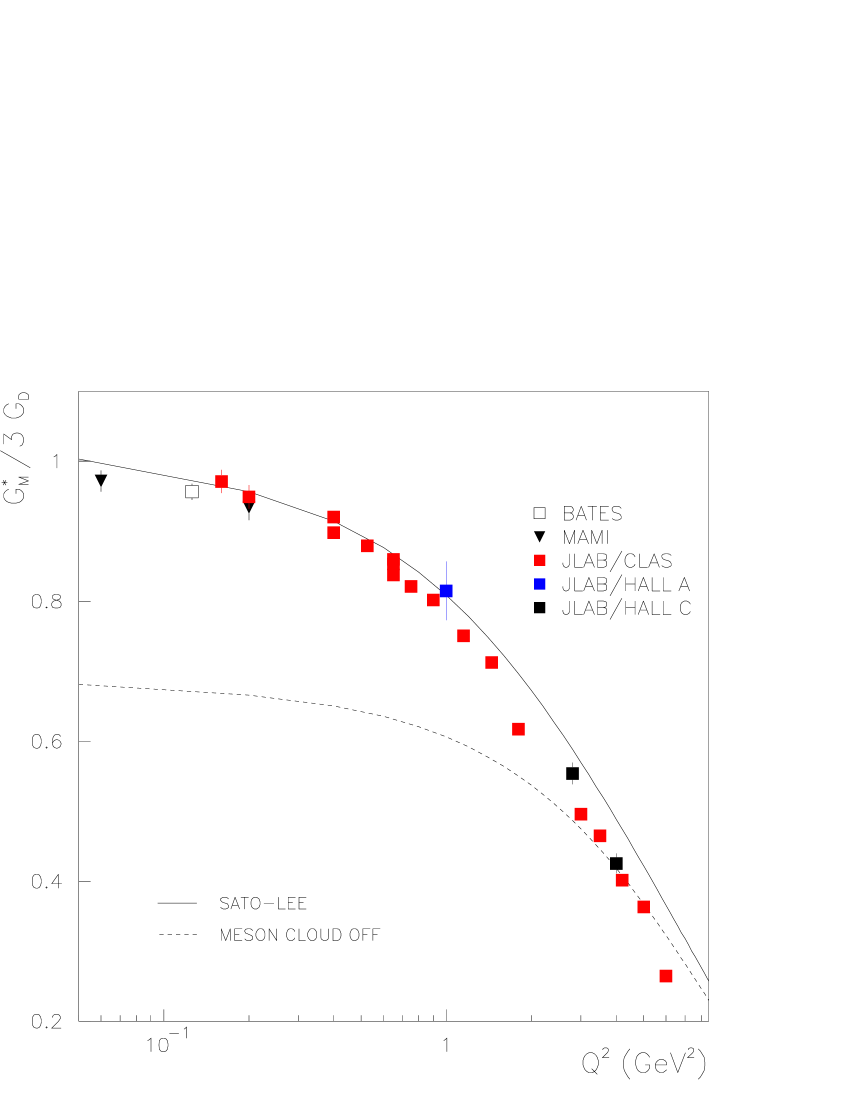
Comparison with microscopic models shows that simultaneous description of both and is achieved with dynamical models that include pion-nucleon interactions explicitly. This supports the claim that most of the quadrupole strength in the transition is due to meson effects which are usually not included in quark models. From Fig. 2 we conclude that at the real photon point 1/3 of the transition strength is due to pion effects, which extends to rather high , although with decreasing relative strength.
The MAID unitary isobar model has been frequently used in the analysis of pion electroproduction data. I want to comment on one aspect of the 2007 version MAID07 that has generated some confusion regarding the results of analysis compared to the 2003 version MAID03.
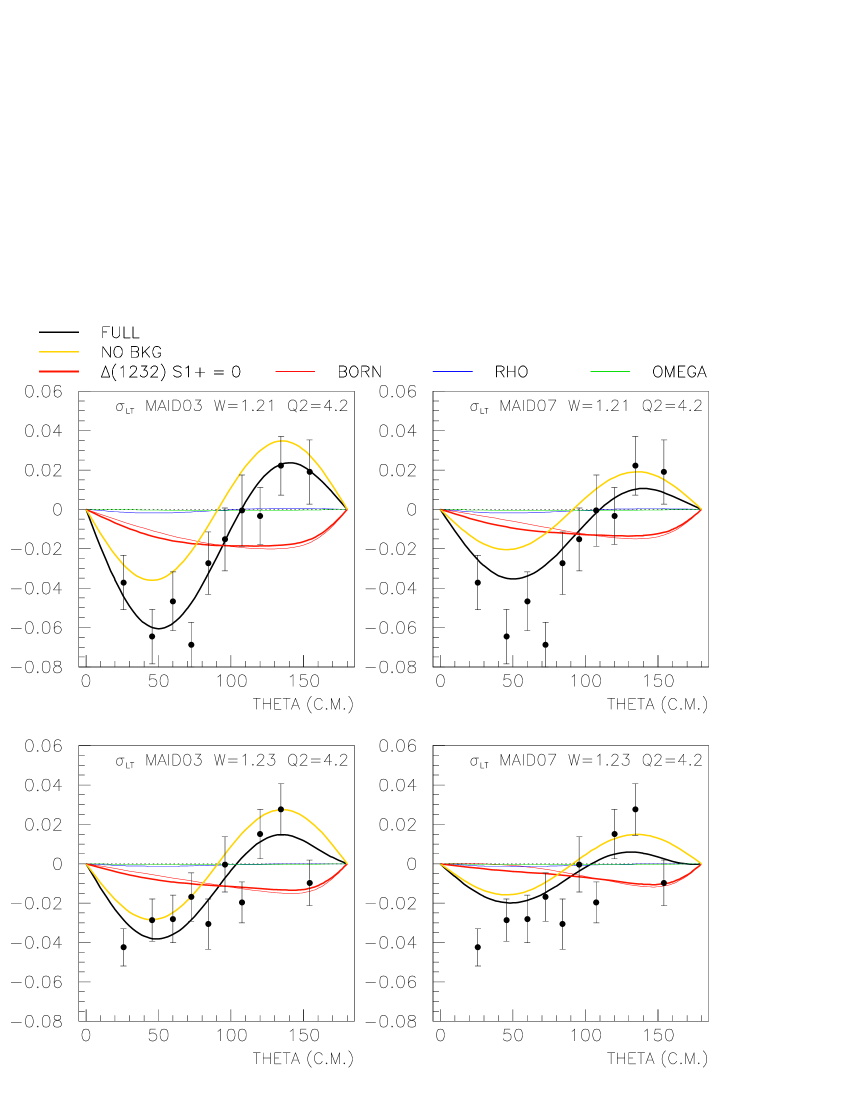
Independent analyses of the JLab data from CLAS and Hall C have been carried out within the MAID framework of MAID03 maid03 and MAID07 maid07 . MAID03 parameters were adjusted by analysing the 2001 CLAS cross section data kjoo and the higher Hall C data frolov . In Fig. 3 the MAID03 parameters are used and the predictions compared with the CLAS data published in 2006 ungaro for the response function in the mass region showing excellent agreement. The extracted ratio showed a strong rise in magnitude with consistent with the values shown in Fig. 1 from the CLAS 2006 data that were not included in the fit. In MAID07 a new fit was made that now included the CLAS 2006 data but did not include the previously used Hall C data. The results of that fit are shown in the right panels in Fig. 3, and clearly compares much less favorably with the measured resonse function. It also results in an almost -independent behavior at high , in clear contradiction to the previously obtained strong rise in magnitude with . It appears that this discrepancy is an artifact of the parameterization used in MAID07 for the ratio, which includes the constraint , the asymptotic limit for . However, this constraint is not justified as there are no indications that asymptotic behavior is relevant either in (which would require , while the data show ), or in the extraction of when not constraint by the presumed asymptotic behavior.
Ultimately, we want to come to a QCD description of these important nucleon structure quantities. In recent years significant effort has been extended towards a Lattice QCD description of the transition alexandrou1 ; alexandrou2 . Within the still large error bars, both quenched and unquenched calculations at GeV2 with pion masses of 400 MeV are consistent with a constant negative value of , in agreement with the data. For the ratio there is a clear discrepancy at low in both quenched and unquenched QCD calculation while the rise in magnitude of with observed in the data is quantitatively reproduced in full QCD at the GeV2.
The measured transition form factors extend to GeV2, and show no sign of the expected asymptotic behavior. It would be very interesting to see if LQCD calculations can describe the observed strong dependence of , and the near lack of dependence of at high .
3 The second resonance region
Three states, the “Roper” , and two strong negative parity states, , and make up the second enhancement seen in inclusive electron scattering.

3.1 The Roper resonance - a puzzle resolved
The resonance has been a focus of attention for the last decade, largely due to the inability of the standard constituent quark model to describe basic features such as the mass, photocouplings, and evolution. This has led to alternate approaches where the state is treated as a gluonic excitation of the nucleon libuli , or has a small quark core with a large meson cloud cano , or is a hadronic molecule of a nucleon and a meson krewald . Quenched lattice QCD calculations lattice-1 indicate that the state has a significant 3-quark component, and calculate the mass to be close to the experimental value.
Given these different theoretical concept for the structure of the state, the question “what is the nature of the Roper state?” has been a focus of the program with CLAS. The state couples to both and final states. It is also a very wide resonance with about 350 MeV total width. Therefore single and double pion electroproduction data covering a large range in the invariant mass W, with full center-of-mass angular coverage are crucial in extracting the transition form factors in a large range of . As an isospin state, the couples more strongly to n than to p. Also contributions of the high energy tail of the are much reduced in that channel due to the of the .

Over 33,000 differential cross section data points and polarized beam asymmetries from CLAS park08 have been analyzed using a fixed-t dispersion relations approach and a unitary isobar model (UIM) janr . Some of the features of the data may best be seen in the Legendre moments. Response functions can be expressed in terms of Legendre polynomials, e.g. the azimuthal angle independent part of the differential cross section can be written as:
Figure 4 shows the lowest Legendre moments for this response functions. The transverse and longitudial electro-coupling amplitudes and of the transition to the resonance are extracted from fits to the data aznauryan-2 . They are shown in Fig. 5. At the real photon point is negative. The CLAS results show a fast rise of the amplitude with and a sign change near GeV2. At GeV2 the amplitude has about the same magnitude but opposite sign as at . It slowly falls off at high . This remarkable behavior of a sign change with has not been seen before for any nucleon transition form factor or elastic form factor. The longitudinal amplitude is large at low and drops off smoothly with increasing . The bold curves are all relativistic light front quark model calculations aznauryan-qm . The thin solid line is a non-relativistic quark model with a vector meson cloud cano , and the thin dashed line is for a gluonic excitation libuli . The first results for the transition form factors of the Roper have recently been obtained in unquenched QCDroper-lqcd .
The hybrid baryon model is clearly ruled out for both amplitudes. At high both amplitudes are qualitatively described by the light front quark models, which strongly suggests that the Roper is indeed a radial excitation of the nucleon. The low behavior is not well described by the LF models and they fall short of describing the amplitude at the photon point. This indicates that important contributions, e.g. meson-baryon interactions at large distances may be missing.
3.2 The state
The state was found to have an unusually hard transition formfactor, i.e. the evolution shows a slow fall-off. This state has mostly been studied in the channel where the appears as a rather isolated resonance near the threshold and with very little non-resonant background. Data from JLab using CLAS thompson ; denizli and Hall C armstrong instrumentation, have provided a consistent picture of the evolution obtained from electroproduction data alone, confirming the hard form factor behavior with precision. There are two remaining significant uncertainty in the electromagnetic couplings of the that need to be examined. The first one is due to the branching ratio of the , the second one is due to the lack of precise information on the longitudinal coupling, which in the channel is usually neglected.
The data have been normalized using a branching ratio , while the PDG gives a range of . Since this state practically does not couple to other channels than and , a measurement of the reaction will reduce this uncertainty. Also, the final state is much more sensitive to the longitudinal amplitude due to a strong interference term present in the channel. With these goals in mind the CLAS data have been used to determine the electrocoupling amplitudes for the . Using the average values and , the data fall systematically above the data set. Adjusting and brings the two data sets into excellent agreement for the higher data, as shown in Fig. 6. The diamond symbols show the results in the channel. The full circles are from the analysis of the CLAS data aznauryan-2 . The square symbols are from the analysis of earlier CLAS , and data aznauryan-1 with adjusted . The theory curves are from various constituent quark models quark model capstick ; salme ; merten ; santopinto ; warns . There could be a 10-20% difference between the and for the GeV2 points. This indicates that meson-cloud effects may play some role at low , possibly affecting the results differently in the two channels. Analyses that take coupled channel effects into account are needed to fully clarify the low behavior.

As mentioned above an advantage of the channel in studying the is that it is also sensitive to the longitudinal transition amplitude, while the channel has little sensitivity and requires a Rosenbluth separation to separate the transverse and longitudinal terms. In the case, the sensitivity is due to a significant wave interference with the nearby -wave amplitude of the . This can be seen in the multipole expansion of the lowest Legendre moment for the response function:
The second term is very sensitive to the multipole of the due to the strong transverse Roper multipole (), especially at high . Preliminary results show significant negative values for the amplitude of .
3.3 Helicity structure of the
A longstanding prediction of the dynamical constituent quark model is the rapid helicity switch from the dominance of the at the real photo point to the dominance of the amplitude at GeV2. In the simple non-relativistic harmonic oscillator model with spin and orbit flip amplitudes only, the ratio of the two amplitudes is given by:
where is a constant adjusted to reproduce the ratio at the photon point where is very small. Is is clear that the model predicts a rapid rise of the ratio with . Figure 7 shows the results for the two transverse amplitudes. We see the amplitude decreasing rapidly in strength with increasing . The amplitude increases rapidly in magnitude with increasing , before falling off slowly at GeV2. completely dominates at GeV2.

4 Conclusions
With the recent precise data on pion and eta electroproduction, combined with the large coverage in , W, and center-of-mass angle, the study of nucleon resonance transitions has become an effective tool in the exploration of nucleon structure in the domain of strong QCD and confinement. We have learned that the exhibits an oblate deformation. The multipole ratios an show no sign of approaching the predicted asymptotic behavior, which provides a real challenge for model builders. The latest data from CLAS on charged pion production reveal a sign change of the transverse amplitude for the N-Roper transition near GeV2, and give strong evidence for this state as the first radial excitation of the nucleon. The hard transition form factor of the previously observed only in the channel is confirmed in the channel, which also allows us to extract the so far unmeasured longitudinal amplitude . The clearly exhibits the helicity flip behavior long ago predicted by the constituent quark model.
References
- (1) V.D. Burkert, Zh. Li, Phys. Rev. D47, 46, 1993.
- (2) J. Ahrens et al., Phys. Rev. Lett.87, 022003, 2001.
- (3) R. Fatemi et al., Phys. Rev. Lett. 91, 222002, 2003.
- (4) Y. Prok et al., arXiv:0802.2232 [nucl-ex]
- (5) V.D. Burkert and B.L. Ioffe, Phys. Lett. B296, 223, 1992; J. Exp. Theor. Phys. 78, 619, 1994.
- (6) A. Deur et al., Phys. Rev. Lett. 93, 212001, 2004; A. Deur et al., arXiv:0802.3198
- (7) V. Burkert, T.-S. H. Lee, Int. J. Phys.E13, 1035, 2004.
- (8) N. Isgur and G. Karl, Phys. Rev. D18, 4187, 1978; Phys. Rev. D19, 2653, 1979.
- (9) R. Koniuk and N. Isgur, Phys. Rev. D21, 1868, 1980.
- (10) A. Buchmann and E. Henley, Phys. Rev. D65, 073017, 2002.
- (11) T. Sato and T.S. Lee, Phys. Rev. C63, 055201, 2001.
- (12) S.S. Kamalov and S.N. Yang, Phys. Rev. Lett. 83, 4494, 1999.
- (13) S. Stave et al., arXiv:0803.2496 [hep-ex], N.F. Sparveris et al., Phys. Lett. B561, 102, 2007.
- (14) N.F. Sparveris et al., Phys. Rev. Lett. 94, 022003, 2005.
- (15) S.S. Kamalov et al., Phys. Rev. C64, 033201, 2001.
- (16) L. Tiator et al., Eur. Phys. J. A19, 55, 2004.
- (17) D. Drechsel, et al., Eur. Phys. J.A34, 69, 2007.
- (18) K. Joo, et al, Phys. Rev. Lett. 88, 122001, 2002.
- (19) M. Ungaro et al., Phys. Rev. Lett.97, 112003, 2006.
- (20) J.J. Kelly et al., Phys. Rev. Lett.95, 102001, 2005.
- (21) R. Beck et al., Phys. Rev. C61, 035204, 2000.
- (22) G. Blanpied et al., Phys. Rev. C64, 025203, 2001.
- (23) V.V. Frolov et al., Phys.Rev.Lett.82:45-48, 1999.
- (24) G. A. Warren, C.E. Carlson, Phys. Rev. D42, 3020, 1990.
- (25) I.G. Aznaurian, Z. Phys. A346, 297, 1993.
- (26) C. Alexandrou et al., Phys. Rev. Lett. 94, 021601, 2005.
- (27) C. Alexandrou et al., Phys. Rev. D77, 085012, 2008.
- (28) Z.P. Li, V. Burkert, Zh. Li; Phys .Rev. D46, 70, 1992.
- (29) F. Cano and P. Gonzales, Phys. Lett. B431, 270, 1998.
- (30) O. Krehl, et al., Phys.Rev.C62,025207, 2000.
- (31) H. Egiyan at al., Phys.Rev.C73,025204, 2006.
- (32) I. Aznauryan, Phys.Rev.C67,015209, 2003.
- (33) K. Park et al., Phys.Rev.C77,015208, 2008.
- (34) I. Aznauryan et al., arXiv:0804.0447
- (35) I. Aznauryan et al., Phys. Rev. C71, 015201; Phys. Rev. C72, 045201, 2005.
- (36) N. Mathur et al, Phys.Lett.B605,137, 2005.
- (37) For an overview, see: I. Aznauryan, Phys. Rev. C76, 025212, 2007.
- (38) H.-W. Lin et al, arXiv:0803.3020 [hep-lat]
- (39) R. Thompson et al., Phys. Rev. Lett. 86, 1702, 2001,
- (40) H. Denizli, Phys. Rev. C76, 015204, 2007.
- (41) C.S. Armstrong et al., Phys. Rev. D60, 052004, 1999.
- (42) S. Capstick and B.D. Keister, Phys. Rev. D51, 3598, 1995.
- (43) E. Pace, G. Salmé, and S. Simula, Few Body Syst. Suppl. 10, 407, 1999.
- (44) D. Merten et al., Eur.Phys.J A14,477, 2002.
- (45) M. Aiello, M.M. Giannini, and E. Santopinto, J. Phys. G24, 753, 1998.
- (46) M. Warns, et al., Z. Phys. C45, 627, 1990.