X-ray pulsars through the eyes of INTEGRAL
Abstract
Recent results of the spectral and timing analysis of X-ray pulsars in hard X-rays with the INTEGRAL observatory are reviewed. The evolution of the cyclotron line energy with the source luminosity was studied in detail for the first time for several sources. It was shown that for V0332+53 this dependence is linear, but for 4U0115+63 and A0535+262 it is more complicated. There are some evidences of the ”reverse” evolution for GX301-2 and Her X-1, and no evolution was found for Vela X-1, Cen X-3, etc. A strong dependence of the pulse fraction on the energy and source luminosity was revealed and studied in detail. A prominent feature in the pulse fraction dependence on the energy was discovered near the cyclotron frequency for several bright sources. The obtained results are compared with results of observations in standard X-rays and briefly discussed in terms of current models; some preliminary explanations are proposed.
Keywords:
X-ray pulsars, neutron stars, accretion:
95.85.Nv, 97.60.Jd, 97.80.Jp1 Introduction
According to the simple theory of accretion onto a rapidly rotating neutron star with a strong magnetic field, the matter from the normal star is stopped near the Alfven surface by the magnetic field pressure, trapped into it and moved along the field lines to small ringing regions on the neutron star surface, emitting X-rays. Due to the dipole structure of the neutron star magnetic field two hot spots will be formed on the surface. In such a case, for a rotating neutron star, the observer will detect on the source light curve pulses of different forms depending on the physical and geometrical conditions as near the neutron star surface, where these pulses are formed, as on the line of sight. The corresponding pulse fraction depends on the configuration of the emitted regions, relative position of the dipole to the observer and the energy.
As it was shown in several early papers wangwel81 ; white83 , observed pulse profiles are essentially differed for different sources; moreover, they demonstrate the wide variety of the forms depending on the energy and can shift, in some cases, up to 180∘on the pulse phase. There is also a strong pulse profile dependence on the source luminosity, which can be connected with changes of the beam function from the pencil-beam to the fan-beam ones with increasing luminosity from to ergs s-1 bs1976 . The presence of the strong ( G) magnetic field near the emitting regions on the surface of the neutron star can be an origin of additional peculiarities in the observed properties of X-ray pulsars, e.g. the presence of the cyclotron resonance absorption features in the X-ray pulsar spectra, whose energy is directly connected with the value of the magnetic field. Moreover, properties of the accreting plasma are significantly changed at the cyclotron frequency, that can leads to changes in the emission beam function mesnag81 . The corresponding changes of the pulse profile near the cyclotron energy were detected from several sources (see, e.g., tsy06 ).
Obviously, such strong changes in the beam function, conditions and geometry of the emission formation regions should lead to strong dependence of the pulse fraction on the energy and source luminosity. This fact was recognized as early as 80-90’s, but only with launches of the orbital observatories RXTE and INTEGRAL, which have high timing and energy resolution (especially at high energies, where the observed emission isn’t subject of the influence of photoabsorption and depends only on the system geometry and physical conditions in the formation regions) has it been possible to carry out systematic investigations in this field. In particular, Tsygankov et al. tsy07 showed that the pulse fraction of the X-ray pulsar 4U0115+634 is decreased with the source luminosity increase and increased with the energy, having maximums near harmonics of the cyclotron absorption line. The pulse fraction increase with the energy was also found for several other X-ray pulsars (see, e.g. fer07 ; barn08 ). Using INTEGRAL data, Tsygankov & Lutovinov tsylut08 studied in detail the pulse fraction dependence on the energy and luminosity for ten bright X-ray pulsars in hard X-rays.
Here we summarize and briefly review current results of observations of X-ray pulsars with the INTEGRAL observatory, drawing the main attention to the cyclotron line energy, pulse profiles and pulse fraction dependences on the luminosity and energy band.
2 Spectra
The INTEGRAL observatory win03 has observed more than 70 X-ray pulsars (including several new ones) during years of operation in orbit; 38 of them were detected at a high significance level, that gave us a possibility to reconstruct their spectra in hard X-rays. For several sources it was possible to perform a search for cyclotron absorption features and carry out detailed analysis of the spectral variability depending on its luminosity (see, e.g., fil05 ). The list of bright X-ray pulsars ( mCrab in the keV energy band) with corresponding energies of the cyclotron line and its harmonics is presented below:
| 4U 0115+63 | 11, 22, 34, 44 keV |
|---|---|
| V 0332+53 | 28, 55 keV |
| A 0535+262 | 45, 100 keV |
| Her X-1 | 38 keV |
| Vela X-1 | 26, 56 keV |
| GX 301-2 | 50 keV |
| Cen X-3 | 31 keV |
| 4U 0352+30∗ | 30 keV |
| GX 1+4 | –a |
| OAO 1657-415 | – |
| EXO 2030+375 | – |
| ∗ – | maximum source flux was mCrab, but the cyclotron line was detected in its spectrum (lut04 ) |
| a – | no cyclotron line detected with INTEGRAL |
In Fig.1 the spectra of eight X-ray pulsars of the different nature are presented for illustration: two of these objects (AX J1820.5-1434 and AX J1841.0-0535) were registered in hard X-rays for the first time; in spectra of several other sources the cyclotron absorption features were clearly detected; strong variability of the spectral shape of the X-ray pulsars GX1+4 and GX301-2 with the luminosity was observed. Note the first detection of the hard X-ray emission from Vela X-1 during the eclipse and its spectrum reconstruction.


For several X-ray pulsars it was known before that the energy of the cyclotron line can somehow depend on the source luminosity (see, e.g., mih98 ). Using INTEGRAL and RXTE data Tysgankov et al. tsy06 showed for the first time that the energy of the main harmonic of the cyclotron line in the V0332+53 spectrum grows approximately linearly with the decrease of the source luminosity. Such a behaviour was predicted by theoreticians about 30 year ago, and now it was firstly observed (see Fig.2a). In approaching the dipole magnetic field of the neutron star, the maximum measured change of the cyclotron line energy corresponds to m of the relative change of the height above the neutron star surface. This height may be considered as an averaged or “effective” height of the formation of the cyclotron feature tsy06 . Moreover, for the first time it was shown that the behaviour of the second harmonics energy is qualitatively similar to the main one. Altogether in a high luminosity state 3 harmonics of the cyclotron line were detected (see Fig.1).
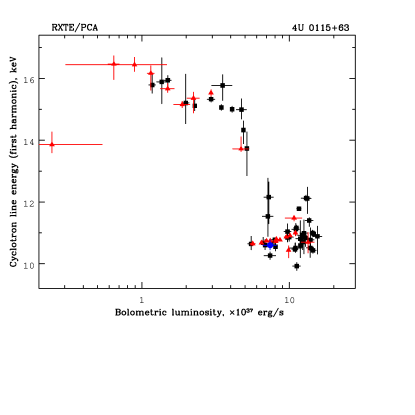
Another well known transient X-ray pulsar 4U 0115+63 was analysed with INTEGRAL and RXTE observatories during its intense outbursts in 1999 and 2004 tsy07 . Due to the high source brightness and relatively low magnetic field of the neutron star four harmonics of the cyclotron line were detected near 11, 22, 33 and 44 keV. But, in contrast to V0332+53, the cyclotron energy dependence on the pulsars’ luminosity could not be approximated by a simple linear law in a wide luminosity range. In the high luminosity state ( – erg s-1) the energy of the fundamental harmonic is practically constant ( 11 keV); when the pulsar luminosity falls below erg s-1, the energy of the fundamental harmonic is displaced sharply toward the high energies, up to keV (Fig.2b). Under the assumption of a dipole magnetic field configuration, this change in the cyclotron energy corresponds to the decrease of the height of the emitting region by km. Note, that such a behaviour was observed during both outburst, indicating that it can be a fundamental property of the pulsar.
Similar investigations were performed for most of bright X-ray pulsars with cyclotron lines and was found that: the complex behaviour of the cyclotron line energy was detected in the spectrum of A0535+262 during the powerful outburst cab08 ; a positive correlation between the cyclotron line energy and source luminosity was found for Her X-1, contrary to what is observed in the transient pulsar V0332+53 staub07 ; some evidences of similar behaviour was registered also for GX301-2 fil05 ; no evolution of the cyclotron line was found for other sources, like Vela X-1, Cen X-3, etc.
An interesting feature is a nonequidistance of the cyclotron line harmonics, which was observed in spectra of X-ray pulsars (see table above). The theory predicts that the accretion column emits harder radiation from regions closer to the neutron star surface, where the magnetic field strength is higher. Thus, we assumed that deviations of energies of the fundamental and higher harmonics in the spectrum of 4U0115+63 from a linear law can be used to compare the effective sizes of the emitting regions at 11, 22, 33, and 44 keV, respectively. Due to a higher magnetic field near the neutron star surface the energies of the higher harmonics should lie above the harmonic law. At the luminosity of erg s-1, four almost equidistant cyclotron line harmonics were clearly detected in the spectrum of 4U0115+63. This suggests that either the region where the emission originates is compact or the emergent spectrum from different (in height) segments of the accretion column is uniform. At higher luminosity ( erg s-1), where the strong nonequidistance was observed, the possible scatter of heights, at which the emission with different energies is produced, was found to be comparable with the height variability obtained from variations of fundamental harmonic energy with the luminosity tsy07 .
3 Timing analysis
We performed an analysis of bright X-ray pulsars to search pecularities of hard X-ray emission at different time scales and to trace changes of its timing properties. As a result of this analysis a number of pulse profiles in several energy bands, 2D-maps of the emission intensity in the coordinates of energy and pulse phase and pulse fraction (calculating as , where and are the maximum and minimum intensities of the pulse profile) dependence on the energy were obtained for each of pulsars. The description of applied methods and technique can be found in tsy06 ; tsylut08 . In Fig.3 the pulse period histories and corresponding light curves in the 20-60 keV energy band, obtained during INTEGRAL observations, are presented for several of the pulsars. It is clearly seen that for some of pulsars there is a clear correlation between the source flux and pulse period, especially during the outbursts, when the accretion rate onto the neutron star is increased significantly. Such a correlation can be roughly explained within the theory of magnetic moment transfer ghosh79 , which connects the neutron star magnetic moment, the pulse period and its change, source flux and distance to the system. To take an illustration, applying this theory to the X-ray pulsar A0535+262 we can obtain the estimation of the distance to the system, kpc, that is in agreement with results of optical observations (pacheco87 ).
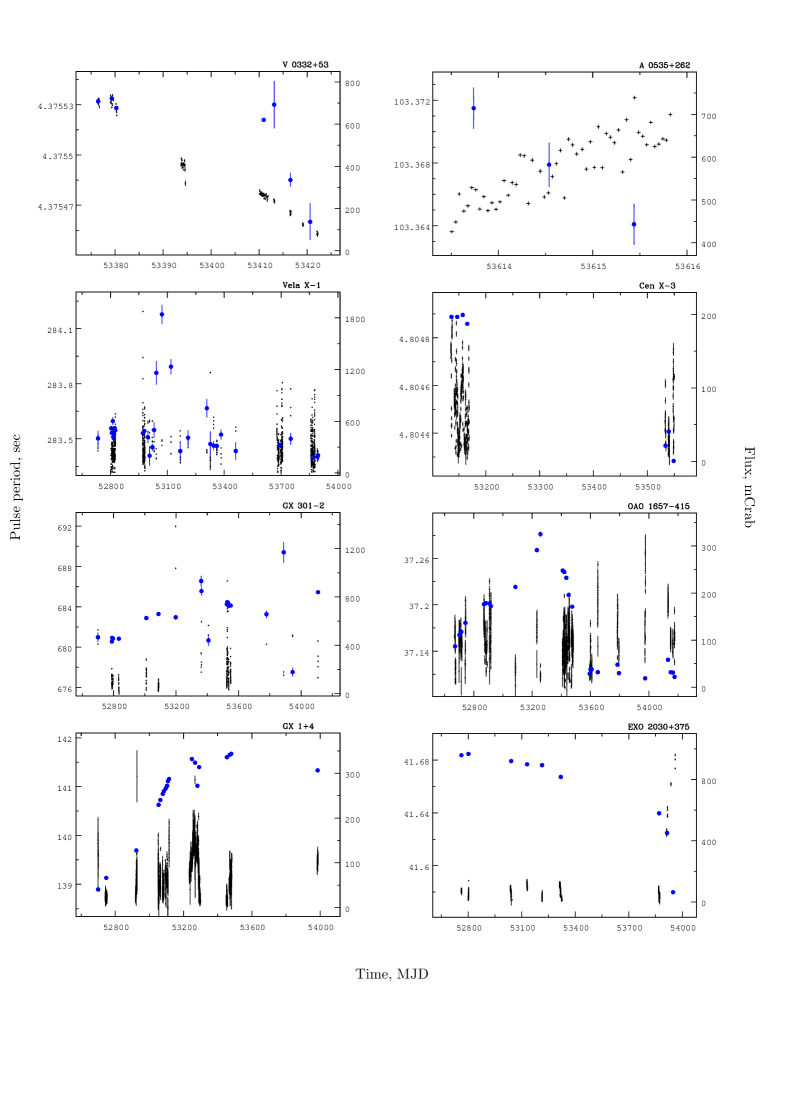
To check the accuracy and correctness of the performed analysis we compared results of observations of the Crab pulsar by the INTEGRAL and Jodrell Bank observatories in hard X-ray and radio bands, respectively, and found that with high accuracy (a typical difference s) they agree well.
3.1 Pulse Profiles
In spite of a few decades of observations there is no self consistent model of pulse profile formation still proposed. Therefore it was very important to find out some new features responsible for specific physical processes in the accretional region near the neutron star surface which should be taken into account for correct simulations of pulse profiles. Particularly, for several of the brightest X-ray pulsars it was possible for the first time to study in hard X-rays the pulse profile changes depending on the energy and source luminosity and compare them with results in standard X-rays. As an example of such an analysis Fig.4 shows the background-corrected pulse profiles of 4U0115+63 at different source luminosities in different energy bands. It is interesting to trace the evolution of the pulse profile with energy and luminosity: at the soft energies the profile is double-peaked with a tendency for the second peak to disappear with the pulsar luminosity decreases; as the energy increases, the second peak also disappears and the profile becomes virtually single-peaked above 20 keV.

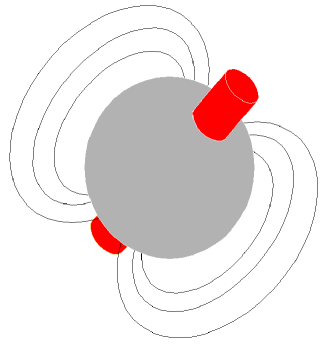
The decrease in the intensity of the second peak with decreasing luminosity and increasing energy can be qualitatively explained by a simple, purely geometrical model that is capable of describing the main observed trends in the pulse profile in general terms (see Fig.5). The rotation axis of the neutron star is inclined with respect to its magnetic field axes in such a way that the accretion column at one of the poles is seen over its entire (or almost entire) height when the pole falls on the observer’s line of sight. Only the upper part emitting softer photons is seen in the second column, while the emission region of hard photons is screened by the neutron-star surface (hence the observed decrease in the intensity of the second peak with increasing energy); as the accretion rate and, accordingly, the source luminosity decrease, the column height decreases, the intensity of the second peak falls, and we will cease to see it altogether at some time.
Naturally, this is only a simple ”toy” model and, to describe the observed behavior of the pulse profiles more or less accurately, we must include to the model the temperature distribution along the accretion column, the shape of the beam function, its dependence on the object’s luminosity and the energy band, the light bending, etc.
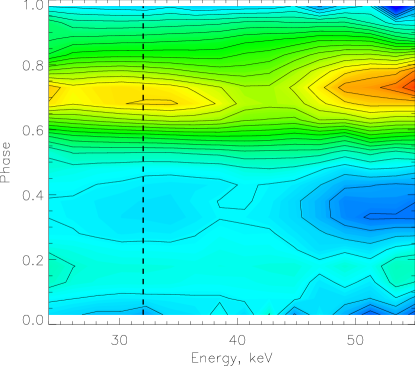
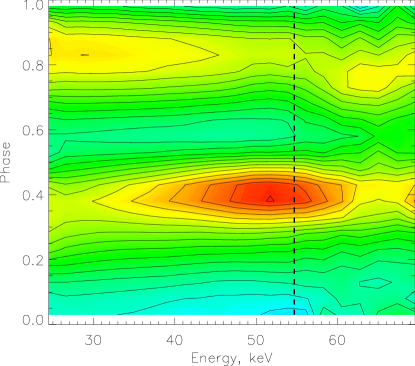
In the analysis of pulse profiles we also widely applied the intensity maps, constructed in a 2-dimensional plane: energy and pulse phase. This method suggested by Tsygankov et al.tsy06 allows one to trace large-scale variations and ratios of peaks in the pulse profile with the energy and pulse phase. In Fig.6 the pulse profiles in several energy bands and corresponding intensity maps are shown for X-ray pulsars Her X-1 and Vela X-1. For Vela X-1, it is interesting to note the increase of the relative intensity of a second peak near 56 keV, where the harmonic of the cyclotron line is registered; also, it is clearly seen that peaks of the Vela X-1 pulse profile come together with the energy.
At the moment a number of pulse profiles and corresponding relative intensity maps are constructed and studied for all states of bright X-ray pulsars which were observed with the INTEGRAL observatory (tsylut08 ).


3.2 Pulse Fraction
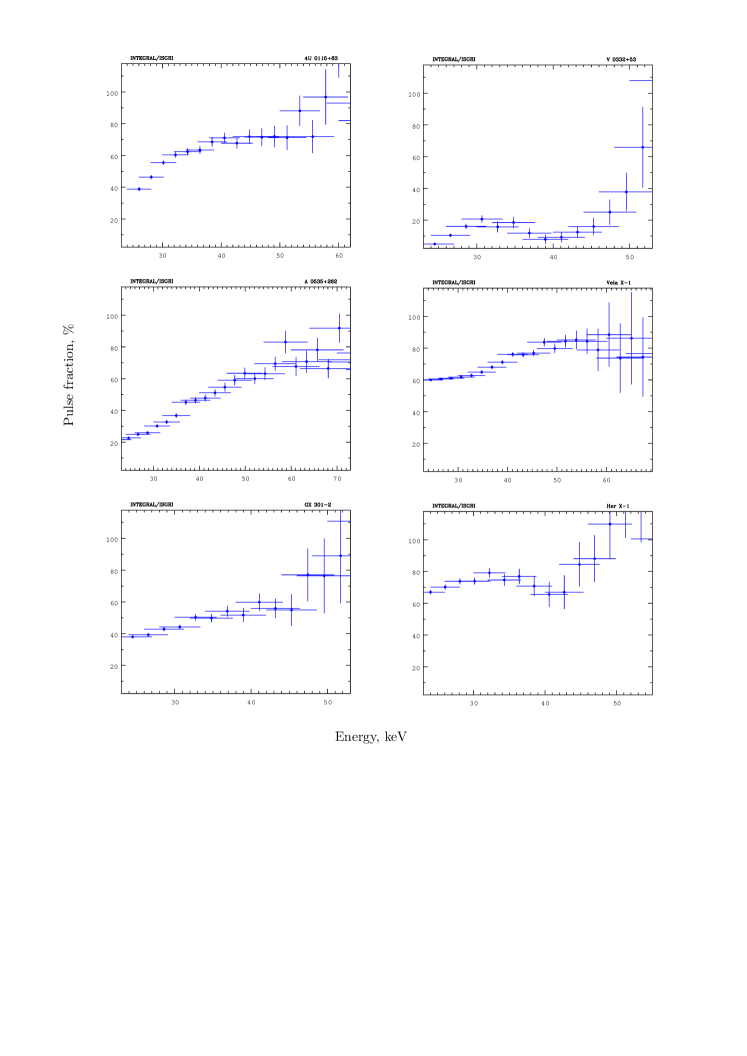
The important and still poorly studied observational characteristic of the X-ray pulsars radiation is the pulse fraction and its dependence on the energy and luminosity. Firstly, it was shown for 4U0115+63 that the pulse fraction increases both with decreasing of the intrinsic source luminosity and increasing energy tsy07 . This result can be qualitatively explained and understood in terms of the ”toy” model suggested above. As the luminosity rises, the geometrical sizes of the emitting regions increase and, accordingly, the pulsations are ”smeared”. The increase of the pulse fraction with energy can also be explained by the fact that the emitting regions are become more compact. In the same work tsy07 it was shown that the growth of the pulse fraction with energy is not homogeneous – near the cyclotron energy and its harmonics a significant increase of the pulse fraction was revealed both with INTEGRAL and RXTE observatories. The value of the increase is near proportional to the depth of the cyclotron line. This nontrivial effect was confirmed now for several other X-ray pulsars (see tsylut08 and Fig.7). The rise of the pulsation amplitude with energy can be connected with the shape of X-ray pulsars’ spectra, as the intensity in the Wien tails will be strongly modulated. The large modulation of the signal in the cyclotron line can be caused by the strong dependence of the opacity on the angle with the magnetic field.
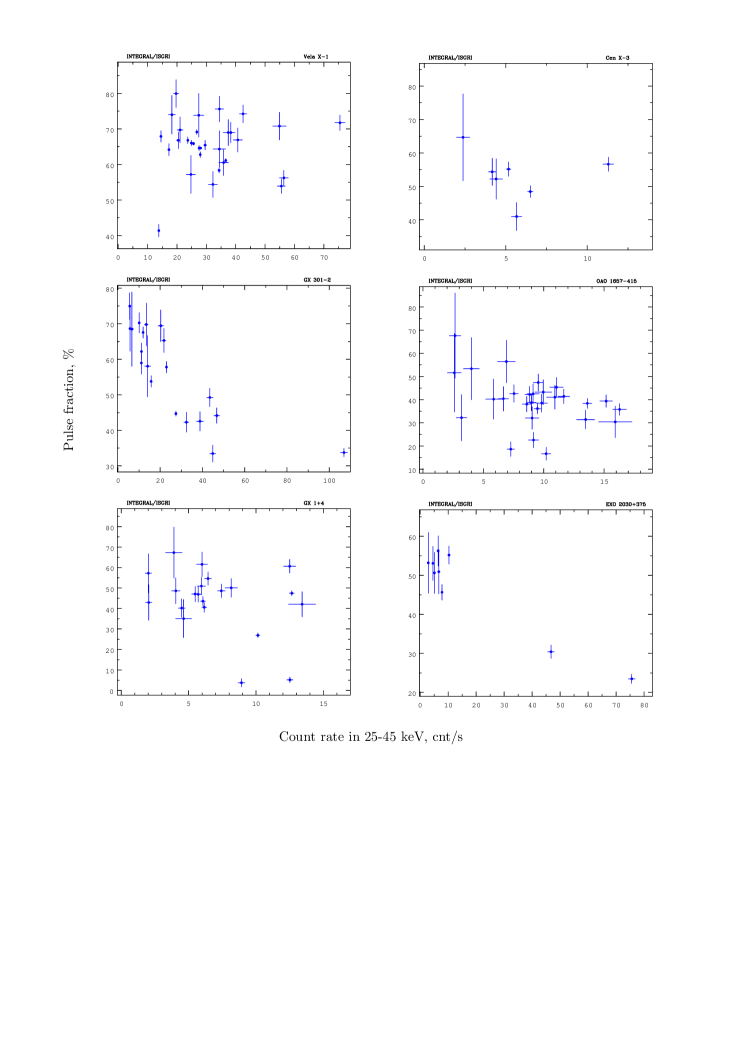
As mentioned above the pulse profiles offen depend on the source intensity, which can lead to variations of the pulse fraction. To check this assumption we also built the pulse fraction dependence on the source intensity in the 25-45 keV energy band, where source fluxes are maximum (Fig.8). For several sources (GX301-2, possibly OAO 1657-415, EXO 2030+375) the pulse fraction is decreased with the growth of the source intensity, which can be understood and explained in terms of the above ”toy” model, when the increase of the accretion rate cause an increase of the accretion column height. Another group of sources is the X-ray pulsars, for which a significant scatter of pulse fraction values is observed for close luminosities, but the general trend in a wide dynamical range of observed fluxes is absent (Vela X-1, Cen X-3, GX1+4). In this case, most probably, the source luminosity is not enough for the formation of accretion columns and the emission is formed near the neutron star surface (this is cicumstantially confirmed by the absence of the cyclotron line energy changes with the luminosity for these sources). The observed scatter of pulse fraction values is possibly connected with local inhomogeneities of the stellar wind or accretion flows.
4 Summary
-
•
Most accurate results of the spectral and timing analysis of several dozens X-ray pulsars in hard X-rays are obtained at the moment with the INTEGRAL and RXTE observatories.
-
•
The evolution of the cyclotron energy with the source luminosity was studied in detail for the first time. It was shown that for V0332+53 this dependence is linear (the cyclotron line energy is increased with the luminosity decrease), but for 4U0115+63 and A0535+262 it is more complicated; the ”reverse” behaviour is detected for Her X-1 and GX301-2.
-
•
The strong dependence of the pulse fraction on the energy and source luminosity is revealed and study in detail.
-
•
The prominent feature in the dependence of the pulse fraction on energy band was revealed near the cyclotron frequency for several bright sources.
-
•
There are preliminary ideas how to explain the above, but the additional theoretical studies and simulations are needed for resolving the puzzles.
References
- (1) Wang Y.-M., Welter G. Astron. Astrophys. 102, 97 (1981)
- (2) White N., Swank J., Holt S. Astrophys. J. 270, 771 (1983)
- (3) Basko M.M., Sunyaev R.A. Astron. Astrophys. 42, 311 (1975)
- (4) Meszaros P., Nagel W. Astrophys. J. 299, 138 (1981)
- (5) Tsygankov S., Lutovinov A., Churazov E., Sunyaev R. MNRAS 371, 19 (2006)
- (6) Tsygankov S., Lutovinov A., Churazov E., Sunyaev R. Astronomy Letters 33, 368 (2007)
- (7) Ferrigno C., Segreto A., Santangelo A., et al. Astron. Astrophys. 462, 995 (2007)
- (8) Barnstedt J., Staubert R., Santangelo A., et al. arXiv:0805.1811 (2008)
- (9) Tsygankov S., Lutovinov A. Astronomy Letters, 34, in press (2008)
- (10) Winkler C., Courvoisier T., Di Cocco G., et al. Astron. Astrophys. 411, L1 (2003)
- (11) Filippova E., Tsygankov S., Lutovinov A., Sunyaev R. Astronomy Letters 31, 729 (2007)
- (12) Lutovinov A., Tsygankov S., Revnivtsev M., et al. The INTEGRAL Universe, edited by V. Schönfelder, G. Lichti & C. Winkler, Proceedings of the 5th INTEGRAL Workshop, ESA-552, 253 (2004)
- (13) Mihara T., Makishima K., Nagase F. Adv. Space Res. 22, 987 (1998)
- (14) Caballero I., Santangelo A., Kretschmar P., et al. Astron. Astrophys. 480, L17 (2008)
- (15) Shtaubert R., Shakura N., Postnov K., et al. Astron. Astrophys. 465, L25 (2007)
- (16) Ghosh P., Lamb F. Astrophys. J. 234, 296 (1979)
- (17) Janot-Pacheco E., Motch C., Mouchet M. Astron. Astrophys. 177, 91 (1987)