Determination of the single-ion anisotropy energy in a = 5/2 kagome antiferromagnet using x-ray absorption spectroscopy.
Abstract
We report x-ray absorption and x-ray linear dichroism measurements at the Fe edges of the geometrically frustrated systems of potassium and hydronium iron jarosite. Comparison with simulated spectra, involving ligand-field multiplet calculations modelling the - hybridization between the iron ion and the oxygen ligands, has yielded accurate estimates for the ligand metal-ion hybridization and the resulting single-ion crystal field anisotropy energy. Using this method we provide an experimentally verified scenario for the appearance of a single-ion anisotropy in this nominally high-spin orbital singlet system, which accounts for features of the spin-wave dispersion in the long-range ordered ground state of potassium iron jarosite.
pacs:
75.25.+z, 71.70.Ch, 71.70.Ej, 75.10.DgI Introduction
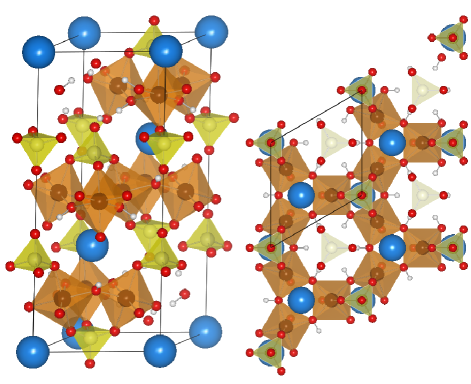
The jarosite group of minerals has received much attention for being close to ideal realizations of the kagome antiferromagnet. The kagome topology, which is named after a Japanese basket weaving pattern, frustrates the antiferromagnetic Néel ordering Diep:04 . Due to the resulting “underconstraint” neither in the quantum case of = 1/2 nor in the classical limit is the kagome antiferromagnet expected to show a symmetry-breaking transition, even at K Reimers:91 ; Chalker:92 ; Reimers:93 . Physical realizations of this system are highly valued because they allow for the investigation of the Mott insulating phase in the absence of Néel-like magnetic order. The jarosite group of general stoichiometry (SO4)2(OH)6, where can be—amongst others—K, Na, Rb, Ag, NH3, or H3O, provides physical models for the kagome antiferromagnet with spin = 3/2 and 5/2, where the site is occupied by trivalent Cr KerenJar:96 ; Inami:01 ; Morimoto:03 and Fe Takano:68 ; Townsend:86 ; Wills:96 ; WillsThesis ; KerenJar:96 ; WillsKjar:00 ; WillsKjar:01 ; Grohol:05 , respectively. V is a = 1 system with ferromagnetic near-neighbor interactions Grohol:02 ; Grohol:03van . Fig. 1 illustrates the jarosite structure of well separated kagome layers consisting of O6 octahedra. Potassium iron jarosite is representative for most of the iron analogues. In this system a transition to a non-collinear long-range ordered state is observed at 64 K, despite that the magnitude of the Curie-Weiss temperature, , is as high as 800 K Grohol:03 ; WillsKjar:00 . The ground state has shown to be a so-called state of positive chirality, in which the spins lie within the kagome plane and all point either in or out of each shared kagome triangle Townsend:86 ; Inami:00 ; WillsKjar:01 ; Inami:03 ; Grohol:05 . The large figure is an indication of relatively strong geometric frustration Ramirez:94 , but clearly the observed long-range ordered ground state points to additional terms in the Hamiltonian of this kagome antiferromagnet, beyond near-neighbor exchange. It has been shown that the ground state can arise due to magnetic anisotropies such as easy-plane single-ion crystal field (CF) anisotropy Nishiyama:03 ; Yildirim:06 where is the zero-field splitting parameter, or a Dzyaloshinsky-Moriya interaction (DMI) Elhajal:02 ; Yildirim:06 . The DMI term has shown to be symmetry allowed on the kagome lattice and has been argued to prevail over the CF anisotropy in the spherical () 3 Fe3+ ion Elhajal:02 . Fits to the spin-wave dispersion curves measured with neutron spectroscopy on single crystal Matan:06 and powder samples Coomer:06 of potassium jarosite have found to be slightly better in a model with DMI compared to the model with CF anisotropy. The evidence so far has, however, been inconclusive.
Given the similarity in crystal structure of potassium (iron) jarosite and hydronium (iron) jarosite the above effects could expected to be equally important in the latter. However, hydronium jarosite has a spin-glass ground state with a freezing temperature of K Bisson:unpub07 . The Weiss temperature for hydronium jarosite is less accurately known (700 to 1400 K) because the inverse susceptibility does not enter a linear regime sufficiently far below the decomposition temperature of the compound Wills:96 . It has been suggested that the spin-glass state is the result of proton transfer from the hydronium groups to the Fe-(OH)-Fe super-exchange mediating hydroxy groups Grohol:03 . One indication that this could happen might be that the OH groups at the crystallographically analogous location in the related kagome compound zinc paratacamite can form a muonium state by chemically binding a positive muon Mendels:07 . The aim of the work described here is to investigate the origins of the magnetic anisotropy (of either single-ion or DMI character) in the iron jarosites, and to understand the essential differences between the salts such as potassium jarosite with a long range ordered ground state and hydronium jarosite.
Using Mössbauer spectroscopy Afanasev:74 ; Bonville:06 the spin state of the Fe3+ in the iron jarosites was found to be = 5/2, thus nominally high-spin . The free-ion 3 state is , i.e. . Hence, there is no orbital angular momentum due to the spin-orbit coupling in the presence of a crystal field as long as the system is high-spin 3. This holds at least up to third order perturbation theory of the trigonal crystal-field distortions, spin-spin and spin-orbit couplings111It has been shown Watanabe:57 that in 4th, 5th and 6th order perturbation theory of the crystal field and spin-spin interactions a small orbital angular momentum and single-ion anisotropy arises.. Even in a crystal field the 3 = 5/2 spin should therefore be practically isotropic apart from the possible effects of dipole-dipole interactions. Both DMI and single-ion anisotropy arise only when the spin-orbit operator can induce a finite orbital angular momentum Moriya:60 ; Watanabe:57 . That in the iron jarosites is clear from Curie-Weiss fits to the high temperature magnetic susceptibility which indicate between 6.2 and 6.7 in potassium iron jarosite Grohol:05 and 6.6(2) in the hydronium analogue Wills:96 ; WillsH3Ojar:00 (compared to a spin only value of the effective moment of 5.92 ). Clearly, this opens up the possibility for both DMI and single ion anisotropies. However, the origin of the orbital angular momentum itself has so far received little attention.
A very strong crystal field, such as in iron phthalocyanine Thole:88Spinmix can give rise to a low-spin ground state in which the spin-orbit coupling will in general reinstate part of the orbital angular momentum of the free-ion configuration which is, in zero order, quenched by the crystal field. It could be that in weaker crystal fields, such as those present in iron oxides, some orbital angular momentum appears due to a mixing in of the low-spin state into the ground state. The crystal field alone does, however, not provide matrix elements between high-spin and low-spin states. The most likely explanation is therefore that an Fe2+ configuration mixes in due to charge transfer Zaanen:85 from the surrounding ligands. For hematite, e.g., the effective valence of the Fe ion has been estimated at 2.43 due to charge transfer from the oxygen ligands Coey:71 . These effects have earlier been shown to explain zero field splitting in Mn2+ and Fe3+ substituted crystals Wan-Lun:89 ; Wan-Lun:94 and in the Mn2+ compounds MnF3 Fransisco:88 , MnPS3 and MnPSe3 Jeevanandam:99 , despite the lower covalence of the fluoride and phosphorus-containing ligands compared to oxygen.
Transition metal x-ray spectroscopy studies have played a key role in the understanding of the effect of charge-transfer and crystal-field in determining the electronic and magnetic properties in transition metals and their compounds Zaanen:85 ; vanderLaan:86 ; FdG:94Rev ; FdG:05Rev . We have measured the x-ray absorption and x-ray linear dichroism (XLD) at the Fe () edges on single-crystalline and powder samples of potassium and hydronium iron jarosite. By comparison with atomic multiplet calculations, taking into account ligand-field effects and multiple ionic configurations, we obtain accurate values for the charge transfer and single-ion anisotropy in the = 5/2 kagome antiferromagnet. The results are compared to magnetic susceptibility and neutron spectroscopy measurements on in particular potassium iron jarosite.
II Experimental
Single crystals of potassium iron jarosite, KFe3(OH)6(SO4)2, were grown using a hydrothermal reduction-oxidation method as described in Ref. Grohol:03, ; 4.88 g (28.0 mmol) K2SO4 and 2.2 mL (40 mmol) H2SO4 were dissolved in 50 mL distilled water, and transferred into a 125 mL PTFE liner of a stainless steel bomb. 0.56 g (10 mmol) iron wire with a diameter of 2 mm was added to the solution. The bomb was placed in an oven at 202∘C for 4 days, then cooled down to room temperature at a rate of 0.3∘C/min. The precipitate was washed, filtered and dried, yielding 0.37 g, which is 22% based on Fe. In order to obtain sufficiently large crystals it was important that the surface area of the solution exposed to air inside the vessel was minimized. This was achieved using a glass container which fitted inside the PTFE liner, with only a small hole at the top. Using this method single crystals of up to 0.7 mm in diameter were obtained, which was sufficiently large for the application in polarized x-ray spectroscopy. A number of crystals were characterized using single-crystal x-ray diffraction. These crystals were identified as potassium iron jarosite and face-indexed.
The original solvothermal synthesis method Dutrizac:76 ; WillsThesis for the jarosites was used for the preparation of H3OFe3(OH)6(SO4)2. In this preparation 6.6 g (22 mmol) of Fe2(SO4)5H2O was dissolved in 50 mL water. This solution was transferred to a 125 mL PTFE liner of a stainless steel bomb. The solution was heated in the bomb to 140∘C for 12 hours. The hydronium iron jarosite which precipitated during the reaction was washed, filtered and dried, yielding 0.27 g of product.
Polarized soft x-ray absorption measurements were carried out using the liquid helium cryostat, housed in the high-field superconducting magnet on ID08 at the European Synchrotron Radiation Facility (ESRF) in Grenoble, France. Total-electron-yield spectra were measured by recording the drain current from the sample as a function of photon energy in the region of the Fe absorption edges. Potassium iron jarosite is strongly insulating, so the resonance enhanced total-electron-yield signal at the iron edge is much smaller than the signal from the surrounding metal of the sample holder. To avoid this source of background intensity a potassium iron jarosite single crystal of 0.7 mm diameter was attached using silver glue to the end of a graphite tip, which in turn was glued to the end of a standard ESRF sample holder. The sample was aligned in the x-ray beam with the crystallographic axis pointing in the horizontal plane and perpendicular to the incident beam. This allowed us to measure absorption spectra with the incident x-ray polarization both perpendicular and parallel to the axis. Spectra were recorded with alternating horizontal and vertical polarization, and for each polarization averages were taken over at least eight scans. In this way the polarization dependent spectra were taken at a number of temperatures between 20 and 290 K, in zero external field.
Isotropic absorption spectra at the Fe edges were obtained on beamline 5U.1 of the Synchrotron Radiation Source (SRS) at Daresbury Laboratory, UK, using potassium and hydronium iron jarosite powder dispersed over double-sided UHV-compatible carbon tape.
III Results
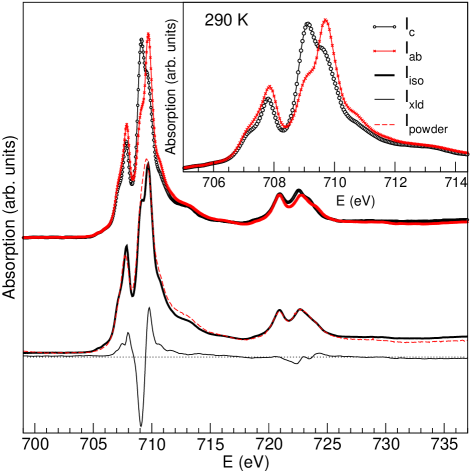
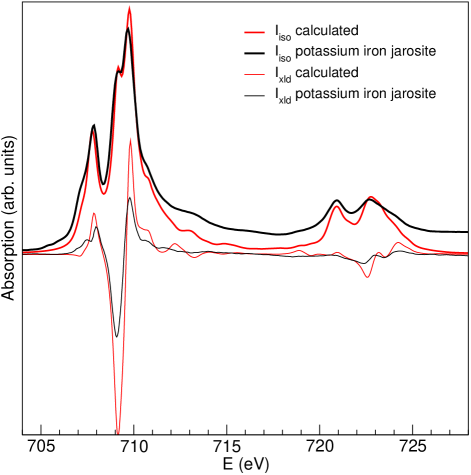
Figure 2 shows the spectra obtained from single-crystal and powder samples of potassium iron jarosite at 290 K. The upper curves in Fig. 2 display the x-ray absorption spectra from a single crystal measured on beamline ID08 at the ESRF, with the incident x-ray polarization parallel to the axis, (black circles), and perpendicular to the axis, (red crosses). The curves in the middle of the figure give the corresponding isotropic absorption spectrum (black line) and the isotropic spectrum directly measured from a powder sample on station 5U.1 at the SRS (broken red line). The curve at the bottom gives the x-ray linear dichroism defined as (thin black line). The transition consists of two edges, the first one at eV ( edge) corresponds to the creation of a core hole. The transition giving rise to a core hole ( edge) is at eV higher photon energy due to the spin-orbit coupling. The inset of Fig. 2 shows the and spectra in close up at the edge, which is the most significant region of the spectrum.
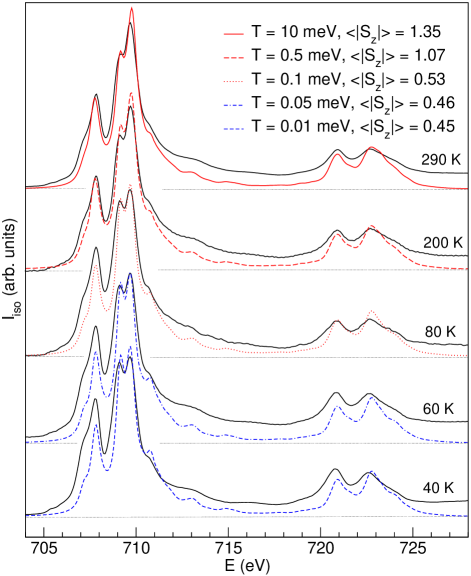
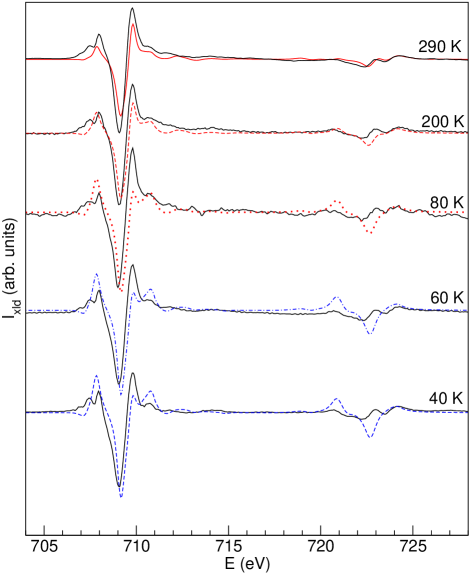
As seen in Fig. 3, the structure at the edge becomes more prominent in the isotropic spectrum as the temperature is lowered. At each stabilized temperature, the reproducibility of up to eight spectra demonstrated the absence of any temporal variation in the spectral line shape or intensity, therefore charging effects and drift in sample alignment can be eliminated as the cause of the observed temperature dependence. These isotropic spectra obtained by weighted averaging of and are in good agreement with the spectra from powder samples measured for the SRS at all temperatures. That this change in line shape occurs in the powder averaged spectrum might be an indication of a slight change in the electronic structure as the temperature is lowered. Only very small changes were observed in the XLD spectral line shape on cooling the sample, as shown in Fig. 4. This change in the spectral line shape is accompanied by a slight reduction in the integrated XLD spectrum Scho:98
| (1) |
corresponding to a small change of the total quadrupole moment of 0.05(2). This might be interpreted as that the Fe shell gains between 3 and 7% net character at base temperature.
The room temperature spectra of hydronium iron jarosite were identical to the spectra obtained on potassium iron jarosite within the experimental resolution as measured at the SRS (the red, broken line in the main panel of Fig. 2 for comparison).
IV Ligand-field multiplet calculations
Due to the strong electrostatic interactions between the core hole and the levels in the final state, the absorption spectrum is not simply proportional to the density of unoccupied levels vanderlaan:91 as a function of energy. For ferromagnets and magnetically soft materials, where all the magnetic moments can be aligned by applying an external field, the x-ray magnetic circular dichroism (XMCD) and x-ray magnetic linear dichroism (XMLD) sum rules can be applied to obtain the expectation values of the orbital and spin magnetic moments Thole:92 and the magneto-crystalline anisotropy vanderlaan:99 , respectively. In the case of the jarosites it is not possible to align the magnetic moments parallel with an external field due to the large energy scale of the antiferromagnetic interactions ( K). The only way to obtain accurate information about the relevant expectation values is by explicitly calculating the transition probabilities
| (2) |
between the ground state and excited state , where is the electric-dipole operator for x-ray absorption with polarization , and is the lifetime broadening, which is treated as a fitting parameter. The experimental x-ray spectra were used to obtain good approximations for and with the aid of the Hilbert++ code Mirone:00 ; Mirone:code . The Hilbert space for is spanned by determinants of the lowest atomic configurations of and , where denotes a ligand hole. Likewise, the Hilbert space for is spanned by determinants of the atomic configurations of and . The Slater integrals for the - and - interactions and the and spin-orbit parameters for the ground state and final state configurations calculated using Cowan’s atomic multiplet program Cowan:81 are tabulated in Ref. vanderlaan:92, . Approximate solutions for the eigenfunctions of the iron ion in the compound are then obtained by diagonalization of the Hamiltonian including charge-transfer and crystal-field terms arising from the surrounding oxygen ligands Mirone:code
| (3) | |||||
In this Hamiltonian, the first term represents the atomic Hamiltonian. The second term gives the hybridization between metal and oxygen orbitals, where and are the Slater-Koster hopping parameters. For each bond, are rescaled with the bond length using where is the normalized length of Fe-O bond and the rescaling exponent is treated as a free parameter. The third term gives the contribution of the electrostatic crystal field which was not used in our case. The last term gives the energy of the electrons in the oxygen valence band, where is a simulation parameter related to the charge-transfer gap via . The total Coulomb energy for the addition of a sixth electron in the Fe shell was found to be 44.3 eV by considering the case , where no charge transfer occurs unless the Fe2+ configuration has a lower energy than the Fe3+ configuration. The sum is made over all bonds , where the local coordinate frame is oriented with the axis along the bond direction. Numerous comparisons between experiment and theory Thole:PRB85 ; FdG:05Rev have shown that this approach works well, provided that the Slater integrals for the Coulomb interactions and spin-orbit couplings are reduced to 70-80% of the atomic Hartree-Fock values Thole:88Spinmix . Here, all and Slater integrals were reduced to 80% of the atomic values calculated using Cowan’s program. The lifetime broadening was set to eV for the edge and eV for the edge. These are values as commonly used in the calculation of x-ray absorption spectra, with always slightly larger than . This spectral broadening is due to the coupling with the (infinite dimensional) electromagnetic field.
The crystal field at the iron atom in potassium iron jarosite is approximately of symmetry, with an elongation of the bond length along the fourfold symmetry axis () of 4% with respect to the bond length in the equatorial plane Grohol:03 . The local symmetry axes of the FeO6 octahedra are canted with respect to the crystallographic axis by an angle of 19.2∘, resulting in buckled FeO4 planes forming the kagome layers.
Our simulation shows that the spectra are mainly determined by the strongly anisotropic -type hybridization between the iron and oxygen orbitals. The electrostatic part of the crystal field could be left out. An excellent agreement between experimental and simulated spectra for was obtained using only four simulation parameters, namely the charge-transfer gap , , and the rescaling constant as defined in (with in the present case). When the simulated isotropic spectra is in good agreement with the experimental spectrum, at the same time optimal agreement is obtained for the linear dichroism spectrum. At high temperature there is good agreement between the experimental and simulated linear dichroism spectrum, apart from an intensity scaling factor of 0.5 as shown in Figs. 4 and 5. With the fitting parameters for the simulation there is no way to reduce the overall intensity of the linear dichroism without radically modifying the isotropic spectrum. For up to 6% the intensity difference might be attributable to the local canting of the FeO6 octahedra with respect to the -plane. In addition to this there is an inevitable loss of intensity in the XLD due to misalignments and sample imperfection. Reduced energy resolution can also lead to a reduction of the measured XLD. We conclude that the difference in overall intensity of the experimental and calculated is not due to fundamental shortcomings of the simulation. For reasons we do not quite understand, the agreement between theory and experiment as evident in the temperature dependence of the isotropic spectra is not reflected in the XLD spectra at lower temperatures. We expect that these spectra, which are averages over increasingly fewer states, are also increasingly sensitive to shortcomings in our simulations. Since the XLD is an orientational energy dependence it will be particularly sensitive for any shortcomings in our theoretical model. It should be emphasised that, despite the differences between the experimental and simulated spectra at low temperatures, the overall agreement between experiment and simulation as obtained here is remarkably good. The parameters as found in our simulation are given in Table 1 (left-hand side). The large error bar on the value for the charge-transfer gap of 3.5(2.0) eV reflects the adjustment of the total Coulomb energy on the iron site to any increase in by transfer of additional electron weight into the Fe ion. This is reflected in the total error in of 0.1 electron.
The values found here for and are similar to those found previously for other Fe3+ compounds FdG:03JACS ; FdG:05Rev . Fe2O3, which is in many respects probably the compound most closely related to iron jarosite, was previously found to have a band gap of predominantly charge-transfer character of 2 to 2.5 eV Ciccacci:91 . With an unusually small value for of 0.3(2) eV the lowest energy peak, at 707.8 eV is reproduced in the simulated spectrum. The main peak at 709 eV splits into two peaks with the introduction of a trigonal distortion of the FeO6 octahedron. A common value for the rescaling exponent is 3 and the small value found here (7.5) is an indication that the charge anisotropy is larger than the crystal field anisotropy as defined by the oxygen positions around the iron. The lowest energy low-spin configuration, corresponding to the free-ion configuration, lies 1.2 eV higher in energy and is not found to mix into the ground state.
| Simulation pars. | Expectation values | ||
|---|---|---|---|
| (eV) | 3.5(2.0) | (meV) | 0.5(1) |
| (eV) | 0.3(2) | 2.77(6) | |
| (eV) | 3.0(2) | ||
| 7.5 | 1.5(2) | ||
| but | 0.008(3) | ||
| 5.39(7) | |||
| From and : | (in eV) | Using we obtain | |
| 3.0(2) | 2.3 | ||
| 2.3(2) | |||
| and using | |||
| 3.4 | |||
| 1.67(5) | |||
The single-ion anisotropy is obtained as the difference between the energy of the = and levels and was found to be of the easy-plane type. This easy-plane anisotropy was also confirmed by rotating the spin quantisation axis to various directions with respect to the crystal field. In this way we have also attempted to obtain estimates for . The symmetry of the ligand field was lowered to , to model the actual positions of the oxygen anions around the cation as obtained from crystallographical data Grohol:03 ; WillsKjar:00 . However, this had no effect on the agreement of the calculated spectra with experiment, nor on the values as listed in Table 1 and hence we consider an estimate for from our data presently not attainable. It should in this respect be noted that the value for was found to change with the splitting of the main peak at 709 meV, introduced by the trigonal distortion of the ligand field. Its value is therefore tightly constrained by the experimentally obtained spectra and the 3d spin-orbit coupling strength. As is detailed in Table 1 our calculation indicates that for the isolated FeO6 cluster most of the orbital angular momentum of the Fe 3 configuration is quenched by the ligand field, with while the maximum orbital angular momentum which could in this case be realised as .
Due to the lower resolution at which the hydronium jarosite powder spectrum has been measured we cannot provide detailed information about this system, apart from a confirmation that the general crystal field is similar, with comparable charge-transfer and (-type) hybridization. This is a good indication that the magnetic exchange in hydronium jarosite is likely to be comparable with that of the other jarosites, i.e. with a Weiss temperature around 800 K. There is also a slight evidence that the ligand-field anisotropy and hence the zero-field splitting, is slightly smaller in hydronium jarosite.
V Discussion
The expectation values of the ground-state obtained in our calculation are given in Table 1 (right-hand side). The corresponding free-ion configuration is with an additional electron weight of 0.4 electron that is mainly in the orbital. The spin-orbit coupling is much smaller than the hopping bandwidth and hence the fraction of the electron transferred to the ligands to the Fe cation is only very weakly orbitally polarized, with . This value is much smaller than the orbital angular momentum as inferred from high-temperature magnetic susceptibility data, which indicate that Grohol:05 . As shown in the lower panel of Table 1 (right-hand side) the experimental value is remarkably close to the case where the added electron weight due to charge transfer is fully orbitally polarized. It is not expected that in this transition metal compound and are good quantum numbers, but there is sufficient evidence that is significantly larger than zero 222Iron jarosite is in this sense not a unique case. For transition metal compounds with more than half-filled shells (such as e.g. Herbertsmithite deVries:07 ) the effective moments are in general significantly larger than the spin-only moment.. It might be that comparison of experimental results with the Mott-Hubbard-like calculations as described here, but with larger clusters containing two or three iron centres, can provide an explanation for the discrepancy between the calculated and experimentally obtained orbital angular momentum.
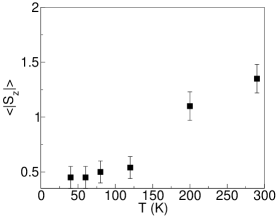
The energy of = 0.5(1) meV for the easy-plane single-ion anisotropy is in good agreement with the values found by Matan et al. Matan:06 (0.428(5) meV) and Coomer et al. Coomer:06 (0.47(2) meV) in their spin-wave analysis of inelastic neutron data from single crystals and powders, respectively. This implies that an easy-plane anisotropy, along with further neighbor interactions, can explain the magnetic ground state in potassium iron jarosite. Further evidence might be found in the temperature dependence of the experimental and calculated isotropic spectra. The spectra in Fig. 5 were taken at room temperature and were compared with the calculated spectra for the Boltzmann averaged configurations of the FeO6 cluster. As is visible in Fig. 3 the relative intensity of the two maxima in the split peak at 709 eV changes in a similar way as was observed in the experimentally obtained spectra. At the same time an (unexplained) increase in intensity of the peak at 707.8 eV peak relative to the intensity of the main peak is observed in the experimental spectra. We have not been able to account for the latter (which was also observed in powder samples) either by changing the temperature of the calculated spectra or with simulations with new values for , and . The change in the main peak at 709 eV where we obtain good agreement, is a direct result of the spin-orbit coupling which causes a change in the shape of the electronic orbital as the spins align in the easy plane. The change in shape of the main peak in the experimental spectra was found to occur between 200 K and 40 K. This is in agreement with previous experiments which have shown that in potassium jarosite the alignment of spin with the kagome planes sets in above 120 K, i.e. well above the transition temperature of 65 K Grohol:05 . The temperature dependence in the experimentally obtained spectra was simulated with the temperature (given in units of eV) used for the Boltzmann averaging over excited states as the only extra parameter, as shown in Fig. 3. All other simulation parameters were fixed to the values given in Table 1. In this way we found the expectation values for at each corresponding experimental temperature, arising from the thermal population of the levels in the multiplet. The temperature dependence of (Fig. 6) shows a gradual alignment of the spins into the kagome planes, at temperatures well above the transition temperature to a long-range ordered state at 64 K. This is in rough agreement with the degree of co-planarity of the spins as measured using neutron diffraction on large single crystals Grohol:05 .
The simulated linear dichroism spectra at the lowest temperatures, corresponding to states with the spins aligned in the equatorial plane (the states ) do not agree well the experimentally obtained spectra as shown in Fig. 4, although some features in the temperature dependence of the XLD are reproduced in the simulated spectra. Without success we have attempted to improve on this situation by calculating the spectra for the Fe spin aligned along the axis in the equatorial plane (i.e. ) which resembles more closely the actual ground state in potassium jarosite. The remaining disagreement could be in part due to experimental error due to sample imperfections and in part due to intrinsic limitations of the simulation.
It might be naive to expect that the ligand-field can be inferred from crystallographic data alone. A first indication for this is the large value of obtained here, which amplifies the effect of the crystallographic trigonal distortion of the FeO6 octahedra. Even when the symmetry of the ligand field is further lowered from and accurately modelled on the locations of the oxygen anions around the central iron 333Though all Fe-O bond lengths are the same, the equatorial plane is rectangular rather than square, with the short side pointing into the kagome triangles. Furthermore, the Fe-O axis is canted by away from the local axis. neither the calculated spectra nor the simulation parameters change significantly. Therefore, it is possible that the actual charge anisotropy follows more closely the plane rather than the equatorial oxygens. The easy-plane magnetic anisotropy of meV found here (see Table 1), is then not directly related to the trigonal distortion of the crystal field but more to the 2D character of the electronic hopping and magnetic exchange, the virtual absence of symmetry hybridization and the Fe spin-orbit coupling strength. In that case the easy plane could coincide more closely with the kagome plane. The strong 2D character can in part be attributed to the sulphate groups separating the kagome layers. The formal valence of the sulphur cation is 6+ with the [Ne] electronic configuration, but this large electrostatic charge is likely to attract electron weight from the neighboring oxygen anions, including the oxygens apical in the FeO6 octahedra. The hopping parameters from these oxygens to the iron is then further reduced with respect to the in-plane hopping. This translates into the large value for found here.
The large difference between and obtained here might be explained by the triangular arrangement of the neighboring FeO6 octahedra. This dramatically lowers the symmetry of the local crystal field around the oxygen ligands and reduces the symmetry overlap of the oxygen orbitals with the iron orbitals. Due to the low symmetry of the oxygen sites the symmetry of the crystal field can be expected to be even lower than indicated by the crystallographic positions of the anions. It is in this sense fortunate that the situation can be modelled so well by the anisotropic and hopping whose ratio is equal for all six anions around the central iron. It could well be that the last differences between the calculated and experimental spectra, such as the low temperature x-ray linear dichroism, some of the difference in the overall intensity of the XLD and the missing bump just above 707 eV, could be brought into agreement by allowing a different balance between and for the apical oxygen anions.
In neutron spin-wave studies Matan:06 ; Yildirim:06 ; Coomer:06 the crystal field anisotropy scenario has been compared in close detail with that of DMI. In the present context such a discussion would require calculations on clusters containing two to three iron centres. Such a calculation would certainly be of great interest, but has not been attempted here, since the present approach already accounts so well for the experimental observations on potassium iron jarosite. The present result closes the last missing causal link, from electronic structure to collective magnetic ground state.
VI Conclusion
The isotropic and x-ray linear dichroism spectra taken at the Fe edges in potassium iron jarosite indicate that an orbital angular momentum and zero-field splitting arise due to an anisotropic, mainly type, charge-transfer from the oxygen ligands. This closely resembles the scenario described in Ref. Wan-Lun:94, to explain the zero-field splitting as observed in Mn2+ salts.
The zero-field splitting parameter of the crystal field anisotropy of 0.5 meV as found here is in excellent agreement with the value found from fits of a crystal field anisotropy model to the spin-wave spectrum in the ground state of potassium iron jarosite Matan:06 ; Yildirim:06 ; Coomer:06 . However, the most important result obtained here is that we have verified in detail the mechanism by which this magnetic anisotropy arises, closing the remaining missing link between the electronic structure in potassium iron jarosite and its magnetic ground state. We have even measured a change in the electronic structure as the magnetic ground state becomes co-planar, with the change of the isotropic line shape over the relevant temperature range. Of course, an additional in-plane anisotropy and further- neighbor interactions are needed to fully explain the magnetic ground state. The present study does not provide more hints to the origin of the glassy state in hydronium jarosite. We found that the energy scale of the magnetic interaction in hydronium jarosite should be comparable to that in potassium jarosite. It might be that temperature dependent spectra taken at a higher resolution could provide new insights in the case of hydronium jarosite. A final interesting observation is that the maximum orbital angular momentum polarization possible for the amount of charge-transfer observed here, but not the actually calculated orbital polarization, is in rough agreement with the experimentally observed effective moment.
VII Acknowledgement
Simon Parsons and Clivia Hejny (Edinburgh University) are acknowledged for their help with the characterization and alignment of single crystals of potassium jarosite. We would like to thank Nicholas Harrison (Imperial College, London and Daresbury Laboratory) and Barry Searle (Daresbury Laboratory) for fruitful discussions about LSDFT calculations on potassium jarosite. Peter Bencok (ESRF and Diamond) and Nicola Farley (Daresbury Laboratory) are acknowledged for their help during x-ray spectroscopy measurements. We further thank Claudine Lacroix (CNRS, Grenoble), Andrew Wills (UCL), Frank de Groot (Utrecht University) and Paul Attfield (Edinburgh University) for fruitful discussions. MdV gratefully acknowledges financial support from the Centre for Materials Physics and Chemistry (Science and Technology Facility Council, UK) and the Highly Frustrated Magnetism network of the European Science Foundation.
References
- (1) Frustrated spin systems, Ed. H. T. Diep (World Scientific, Singapore, 2004).
- (2) J. N. Reimers, A. J. Berlinsky, and A.-C. Shi, Phys. Rev. B 43, 865 (1991).
- (3) J. T. Chalker, P. C. W. Holdsworth, and E. F. Shender, Phys. Rev. Lett. 68, 855 (1992).
- (4) J. N. Reimers and A. J. Berlinsky, Phys. Rev. B 48, 9539 (1993).
- (5) A. Keren, K. Kojima, L. P. Le, G. M. Luke, W. D. Wu, Y. J. Uemura, M. Takano, H. Dabkowska, and M. J. P. Gingras, Phys. Rev. B 53, 6451 (1996).
- (6) T. Inami, T. Morimoto, M. Nishiyama, S. Maegawa, Y. Oka, and H. Okumura, Phys. Rev. B 64, 054421 (2001).
- (7) T. Morimoto, M. Nishiyama, S. Maegawa, and Y. Oka, J. Phys. Soc. Jpn 72, 2085 (2003).
- (8) M. Takano, T. Shinjo, M. Kiyama, and T. Takada, J. Phys. Soc. Jpn 25, 902 (1968).
- (9) M. G. Townsend, G. Longworth, and E. Roudaut, Phys. Rev. B 33, 4919 (1986).
- (10) A. S. Wills and A. Harrison, J Chem. Soc. Faraday Frans. 92, 2161 (1996).
- (11) A. S. Wills, A. Harrison, C. Ritter, and R. I. Smith, Phys. Rev. B 61, 6156 (2000).
- (12) A. S. Wills, Phys. Rev. B 63, 064430 (2001).
- (13) D. Grohol, K. Matan, J. H. Cho, S. H. Lee, J. W. Lynn, D. G. Nocera, and Y. S. Lee, Nature Materials 4, 323 (2005).
- (14) D. Grohol and D. Nocera, J. Am. Chem. Soc. 124, 2640 (2002).
- (15) D. Grohol, Q. Huang, B. H. Toby, J. W. Lynn, Y. S. Lee, and D. G. Nocera, Phys. Rev. B 68, 094404 (2003).
- (16) D. Grohol, D. G. Nocera, and D. Papoutsakis, Phys. Rev. B 67, 064401 (2003).
- (17) T. Inami, M. Nishiyama, S. Maegawa, and Y. Oka, Phys. Rev. B 61, 12181 (2000).
- (18) M. Nishiyama, S. Maegawa, T. Inami, and Y. Oka, Phys. Rev. B 67, 224435 (2003).
- (19) A. P. Ramirez, S.-W. Cheong, and M. L. Kaplan, Phys. Rev. Lett. 72, 3108 (1994).
- (20) N. Nishiyama and S. Maegawa, Physica B 329-333, 1065 (2003).
- (21) T. Yildirim and A. B. Harris, Phys. Rev. B 73, 214446 (2006).
- (22) M. Elhajal, B. Canals, and C. Lacroix, Phys. Rev. B 66, 014422 (2002).
- (23) K. Matan, D. Grohol, D. G. Nocera, T. Yildirim, A. B. Harris, S. H. Lee, S. E. Nagler, and Y. S. Lee, Phys. Rev. Lett. 96, 247201 (2006).
- (24) F. C. Coomer, A. Harrison, G. S. Oakley, J. Kulda, J. R. Stewart, J. A. Stride, B. Fåk, J. W. Taylor, and D. Visser, J. Phys.: Condens. Mat. 18, 8847 (2006).
- (25) W. G. Bisson and A.S. Wills, to be published (2008).
- (26) P. Mendels, F. Bert, M. A. de Vries, A. Olariu, A. Harrison, F. Duc, J. C. Trombe, J. S. Lord, A. Amato, and C. Baines, Phys. Rev. Lett. 98, 077204 (2007).
- (27) A. M. Afanasev, V. D. Gorobchenko, D. S. Kulgawczuk, and I. I. Lukashevich, Phys. Status Solidi (A) 26, 697 (1974).
- (28) P. Bonville et al., Hyperfine Interact. 168, 1085 (2006).
- (29) T. Moriya, Phys. Rev. 120, 91 (1960).
- (30) H. Watanabe, Progr. Theor. Phys. 18, 405 (1957).
- (31) A. S. Wills, V. Dupuis, E. Vincent, J. Hammann, and R. Calemczuk, Phys. Rev. B 62, R9264 (2000).
- (32) B. T. Thole, G. van der Laan, and P. H. Butler, Chem. Phys. Lett. 149, 295 (1988).
- (33) J. Zaanen, G. A. Sawatzky, and J. W. Allen, Phys. Rev. Lett. 55, 418 (1985).
- (34) J. M. D. Coey and G. A. Sawatzky, J. Phys. C: Solid St. Phys. 4, 2386 (1971).
- (35) YuWan-Lun, Phys. Rev. B 39, 622 (1989).
- (36) YuWan-Lun and TanTao, Phys. Rev. B 49, 3243 (1994).
- (37) E. Francisco and L. Pueyo, Phys. Rev. B 37, 5278 (1988).
- (38) P. Jeevanandam and S. Vasudevan, J. Phys.: Cond. Mat. 11, 3563 (1999).
- (39) G. van der Laan, J. Zaanen, G. A. Sawatzky, R. Karnatak,, and J. M. Esteva, Phys. Rev. B 33, 4253 (1986).
- (40) F. de Groot, J. El. Spec. Rel. Phen. 67, 529 (1994).
- (41) F. de Groot, Coordination Chemistry Reviews 249, 31 (2005).
- (42) J. E. Dutrizac and S. Kaiman, Canadian Mineralogist 14, 151 (1976).
- (43) A. S. Wills, Ph.D. thesis, The University of Edinburgh, 1996.
- (44) P. F. Schofield, G. van der Laan, C. M. B. Henderson, and G. Cressey, Mineralogical Magazine 62, 65 (1998).
- (45) G. van der Laan and B. T. Thole, Phys. Rev. B 43, 13401 (1991).
- (46) B. T. Thole, P. Carra, F. Sette, and G. van der Laan, Phys. Rev. Lett. 68, 1943 (1992).
- (47) G. van der Laan, Phys. Rev. Lett. 82, 640 (1999).
- (48) A. Mirone, M. Sacchi, and S. Gota, Phys. Rev. B 61, 13540 (2000).
- (49) A. Mirone, Hilbert++ manual, arXiv:0706.4170v1, 2007.
- (50) R. D. Cowan, The Theory of Atomic Structure and Spectra (University of California Press, Berkeley, 1981).
- (51) G. van der Laan and I. W. Kirkman, J. Phys.: Condens. Mat. 4, 4189 (1992).
- (52) B. T. Thole, G. van der Laan, J. C. Fuggle, G. A. Sawatzky, R. C. Karnatak and J.-M. Esteva, Phys. Rev. B 32, 5107 (1985).
- (53) E. C. Wasinger,F. M. F. de Groot, B. Hedman, K. O. Hodgson, and E. I. Solomon, J. Am. Chem. Soc. 125, 12894 (2003).
- (54) F. Ciccacci, L. Braicovich, E. Puppin, and E. Vescovo, Phys. Rev. B 44, 10444 (1991).
- (55) M. A. de Vries, K. V.Kamenev, W. A. Kockelmann, J. Sanchez-Benitez, and A. Harrison, Phys. Rev. Lett. 100, 157205 (2008).