Narrowband spectroscopy by all-optical correlation of broadband pulses
Abstract
High peak power ultrafast lasers are widely used in nonlinear spectroscopy but often limit its spectral resolution because of the broad frequency bandwidth of ultrashort laser pulses. Improving the resolution by achieving spectrally narrow excitation of, or emission from, the resonant medium by means of multi-photon interferences has been the focus of many recent developments in ultrafast spectroscopy. We demonstrate an alternative approach, in which high resolution is exercised by detecting narrow spectral correlations between broadband excitation and emission optical fields. All-optical correlation analysis, easily incorporated into the traditional spectroscopic setup, enables direct, robust and simultaneous detection of multiple narrow resonances with a single femtosecond pulse.
pacs:
82.53.Kp,78.47.N-,39.30.+wWith recent advances of ultrafast laser sources, featuring high optical field amplitudes at low average power, coherent nonlinear spectroscopy with femtosecond (fs) pulses has been recognized as a promising tool for time-resolved chemical analysis Joo et al. (1991); Schmitt et al. (1997); Lang et al. (1999), remote sensing of complex molecules Scully et al. (2002); Ooi et al. (2005) and non-invasive imaging of biological objects Zumbusch et al. (1999); Potma et al. (2001); Cheng and Xie (2004). Due to the broad spectral width of ultrashort pulses, femtosecond spectroscopy often lacks spectral resolution. The latter can be recovered by complementing the frequency resolved measurement with the time-delay scanning Heid et al. (2001); Xu et al. (2007), or by combining the broadband fs excitation with the narrowband probing by picosecond pulses from a separate laser source Cheng et al. (2002) or a spectral slice of a femtosecond source Oron et al. (2003); Lim et al. (2005) (“multiplex cars”). Alternatively, higher resolution can also be achieved without resorting to narrowband pulses and without the time-consuming delay scans. As many nonlinear optical methods involve interferences between multiple photons of different frequencies from under the same pulse bandwidth, improving the resolution is possible by controlling these interferences with spectral pulse shaping Weiner (2000). Spectral resolution, significantly better than the broad bandwidth of ultrashort laser pulses, has been achieved in second harmonic generation Zheng and Weiner (2001), multi-photon absorption Meshulach and Silberberg (1998); Pastirk et al. (2003); Lozovoy et al. (2003) and coherent Raman scattering Dudovich et al. (2002); Oron et al. (2002) of shaped femtosecond pulses.
In this work we focus on Coherent Anti-Stokes Raman Scattering (cars) which has become a popular method in nonlinear optical spectroscopy and microscopy because of its high sensitivity to molecular structure Zheltikov (2000). In cars, two laser photons, “pump” and “Stokes”, excite the coherent molecular vibrations, which then scatter a third, “probe”, photon generating the anti-Stokes signal. Despite the broad spectrum of the femtosecond pump and Stokes pulses, their collective two-photon field can be spectrally narrowed by means of the pulse chirping Nibbering et al. (1992) or shaping Dudovich et al. (2002), providing selectivity of Raman excitation. On the other hand, shaping of the probe pulse have been used for narrowing the spectrum of the anti-Stokes emission Oron et al. (2002). In both cases, the spectral line narrowing is a result of a delicate interference of the input fields inside the Raman medium. As such, it is sensitive to the proper choice of the pulse shapes, non-resonant background and interferometrically stable time delays.
In the recently demonstrated method of noise-autocorrelation spectroscopy Xu et al. (2008), we have eliminated the requirement of an accurate pulse shaping, while achieving high spectral resolution without delay scanning and bandwidth multiplexing. The method is based on the detection of optical field correlations in the coherently scattered light. The correlations are induced by the vibrational resonances, and therefore carry the information about the Raman spectrum of the medium. The auto-correlation of the Raman spectrum has been extracted via computer post-processing of the measured data, which involved numerical correlation analysis with averaging over multiple noise realizations.
Here, we show that spectral correlations in the coherently scattered broadband anti-Stokes radiation can produce a narrowband optical Raman spectrum similar to that obtained with spontaneous Raman or multiplex cars, yet without the narrowing of the pulse bandwidth. We take advantage of the possibility to detect optical correlations between two broadband pulses by means of the non-resonant interferences in the sum-frequency generation (sfg) of those pulses in the external nonlinear crystal Diels and Rudolph (2006). We start with the two pulses (hereafter called “conjugate” probe, , and reference, ) designed to exhibit narrow single-peak sfg spectrum,
| (1) |
where is the Dirac -function and represents the central frequency of the probe/reference sfg spectrum. The probe pulse is then scattered off the molecular vibrations, generating the anti-Stokes pulse. Finally, the resonance-induced correlations in the anti-Stokes light are optically processed by mixing the cars signal with the reference pulse. The measured cars/reference sfg spectrum, , reflects the narrow vibrational modes of the medium as described below.
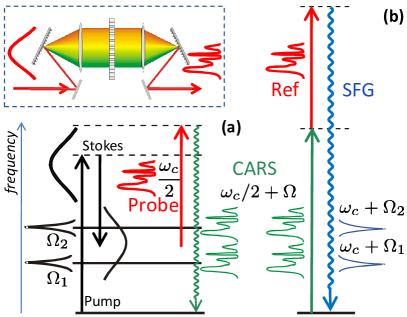
In cars, coherent molecular vibrations are excited by a two-photon field of the simultaneously applied transform-limited pump and Stokes pulses, and , respectively (black lines in Fig.1(a)). The induced vibrational coherence can be expressed as a product of the excitation spectrum and the spectrum of the Raman modes Xu et al. (2007):
| (2) |
where , represents the contribution of the th resonance, and the non-resonant background is denoted . Anti-Stokes scattering of the probe field, , off the molecular vibrations results in the cars signal, , which in the time domain can be written as:
| (3) |
with being the Fourier transform of the spectral response, . The sum-frequency generation field of the cars and reference pulses is, therefore:
| (4) |
which in the frequency domain corresponds to the convolution of the probe/reference sfg spectrum, , and the vibrational spectrum of the medium:
| (5) |
Thus, by narrowing the spectrum of (Eq.1), one can establish an exact correspondence between and , retrieving the Raman frequency shifts directly from the measured sfg signal.
Unlike the all-optical processing used in multiplex cars and based on the resonant interference between the excited vibrational states and their precise amplitude and phase shaping Oron et al. (2004), our approach does not require any prior knowledge on the vibrational frequencies of the molecules. It is also not sensitive to the particular spectral shape of the probe pulses as long as the conjugation condition of Eq.1 is satisfied. The conjugate probe and reference pulses can be generated by various means, including simple frequency chirping or frequency down conversion Dayan et al. (2004). Here, we employ spectral pulse shaping to create a “self-conjugate” pulse, i.e. a broadband pulse with a narrowband second harmonic, . The self-conjugate field serves both as the probe and the reference, thus eliminating the need of dealing with two separate pulses and simplifying the experimental setup. This result, shown schematically in Fig.1(b), provides the basis for the experimental method demonstrated in this work.
Self-conjugate pulses can be generated by shaping the original transform-limited femtosecond pulse with a pseudo-random binary phase mask Comstock et al. (2004). As a two-photon process, second harmonic generation (shg) at any given frequency is defined by the interference of multiple photon pairs, whose total frequency adds up to . For this to result in a narrowband spectrum, the interference must be constructive at and destructive everywhere else. The first requirement is known to be satisfied by the condition Meshulach and Silberberg (1998), which can be realized by applying an anti-symmetric spectral phase shaping around . Destructive interference can be achieved by randomizing the spectral phase of the pulse while preserving the anti-symmetric property Zheng and Weiner (2000); Comstock et al. (2004).
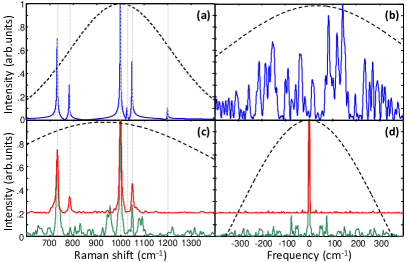
Calculations of the sum-frequency mixing of the probe and cars pulses (Eq.5), and its correspondence to the model vibrational spectrum of the medium, are shown in Fig.2(a,c). First, an uncorrelated white noise, anti-symmetrized around the central frequency, has been added to the phase of the originally transform-limited probe field through a model pulse shaper. Owing to the presence of Raman resonances and despite the uncorrelated noise in the probe, spectral correlations are created in the cars field. Though not apparent in the cars signal itself (Fig.2(b)), they produce sharp peaks in the cars/probe sfg spectrum (Fig.2(c)), which can be clearly assigned to the corresponding Raman lines.
Unfortunately, residual correlations in the random phase give rise to the artificial lines and lower signal-to-noise ratio, seen both in the cars/probe sfg and probe/probe shg spectra (Fig.2(c) and (d),respectively). To improve the quality of the signal, we performed a numerical optimization based on the genetic algorithm search of a pseudo-random binary phase mask (constrained to and radian only Comstock et al. (2004)) resulting in the narrowest calculated probe shg spectrum. Due to the finite spectral resolution of the pulse shaper and, therefore, finite width of the optimized shg, the correspondence between and in Eq.5 is not exact. Hence, using the cars/probe sfg line width as a fitness parameter improved the performance of the method even further, but required a priori assumption about the line width of the Raman resonances. The resulting pseudo-random binary masks were used in the experiments described below.
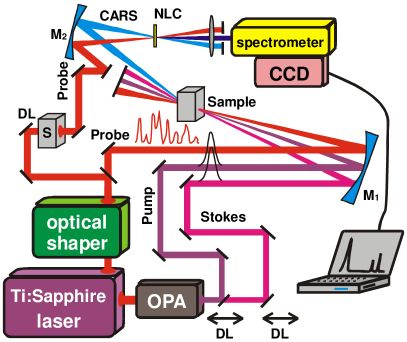
The experimental setup (Fig.3) was based on a standard Ti:Sapphire regenerative amplifier, producing 40 fs probe pulses at the central wavelength of 800 nm and 1 KHz repetition rate. An optical parametric amplifier generated the pump and Stokes beams at 1111 and 1250 nm, respectively. Pre-calculated spectral phase has been applied to the probe pulses by means of a home-made pulse shaper based on a liquid-crystal spatial light modulator (see inset in Fig.1) and provided spectral resolution of 10 cm-1. Pump, Stokes and probe pulses, about 2 J each, have been focused by a silver coated mirror into a quartz cuvette with liquid toluene, where they overlapped in time and space in the standard boxcars phase-matching geometry. cars signal has been then collimated and focused onto a 100 m BBO crystal, together with the reference pulse which has been split off the shaped probe pulse in front of the sample. Sum-frequency signal from the nonlinear mixing of the cars and reference pulses has been coupled into a high-resolution spectrometer equipped with a CCD camera, and typically accumulated for about 1 minute.
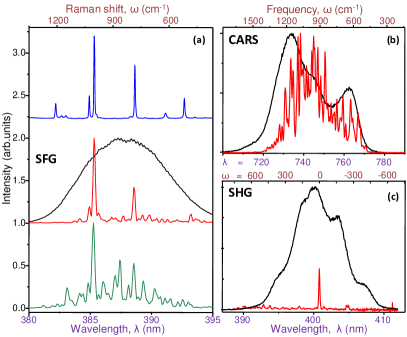
Experimental sfg spectra are presented in Fig.4(a). The spontaneous Raman spectrum of toluene, measured separately, is shown at the top of the plot for reference. Below it, the two signals with sharp peaks of much narrower width than the bandwidth of the probe pulse, attest to the high resolution of the proposed method. The position of the two peaks of the center curve match the frequencies of the two strong Raman modes of toluene around 1000 and 784 cm-1, covered by the broad bandwidth of the pump/Stokes pulse pair. The latter is demonstrated by the observed cars signal, with and without phase shaping, in plot (b). The apparently random cars intensity distribution in the shaped case results from the presence of Raman modes and carries the information about their frequencies, which is revealed in the cars/probe sfg spectrum.
The sfg spectrum at the bottom of Fig.4(a) exhibits low signal-to-noise ratio as a result of the lack of the phase mask optimization. An optimized mask has resulted in higher quality spectrum shown in the middle of the plot. Note that the optimization has not been performed during the experiment in an adaptive feedback-controlled fashion, in which the observed spectral contrast would have been used as a fitness parameter. Instead, we have pre-calculated our binary phase masks for the anticipated resonance line width and the measured characteristics of the probe pulse (i.e. its spectral intensity and phase before shaping). The latter proves critical for the quality of the observed sfg signal. We therefore attribute the unequal performance of different masks to the uncertainty in characterizing the probe pulse, which will be improved in the future.
As expected, spectral narrowing of the cars/probe sfg signal is accompanied by the corresponding narrowing of the probe’s second harmonic, shown in Fig.4(c). We have found that for our experimental parameters, better peak-to-background contrast in the sfg always corresponds to the better contrast of the shg peak. The reason for this is the insufficient resolution of our pulse shaper for resolving the line width of the observed Raman modes (10 cm-1 vs 3 cm-1, respectively). As a result, the optimization is almost insensitive to the width of the resonant lines and works equally well for both the sfg and shg narrowing. This however, may not be true for the case of higher resolution shaping.
The demonstrated approach presents an alternative to the existing methods of high-resolution Raman spectroscopy with ultrashort pulses, which typically rely on the delay scanning, interferometric stability, or post-processing of the acquired data. All-optical correlation analysis is performed separately from the resonant medium of interest, reducing the sensitivity of the method to non-resonant background, precise time delays, and other laser parameters. The ability to detect Raman peaks directly in the measured sfg spectrum may prove invaluable for the applications in microscopy. For instance, sensitive detection of the integral sfg signal, passed through an appropriate frequency filter, could quickly identify the presence of a certain Raman mode without the need of a spectrometer. Though this type of detection is similar to the traditional spontaneous Raman or multiplex cars spectroscopy, the proposed method utilizes the whole spectral bandwidth and high peak power of femtosecond pulses, thus suggesting the possibility for higher sensitivity or faster data retrieval. In the proof-of-principle work presented here, the speed was limited by the low efficiency of the sum-frequency generation. This can be improved by using thicker nonlinear crystals with optimized dispersion properties, and by increasing the power of a reference pulse. Pre-calculated phase masks may enable selective detection of resonances with the specified line width, while avoiding time consuming feedback-controlled optimization.
Acknowledgements.
This work has been supported by the CFI, BCKDF and NSERC.References
- Joo et al. (1991) T. Joo, M. A. Dugan, and A. C. Albrecht, Chem. Phys. Lett. 177, 4 (1991).
- Schmitt et al. (1997) M. Schmitt et al., Chem. Phys. Lett. 270, 9 (1997).
- Lang et al. (1999) T. Lang, K.-L. Kompa, and M. Motzkus, Chem. Phys. Lett. 310, 65 (1999).
- Scully et al. (2002) M. O. Scully et al., PNAS 99, 10994 (2002).
- Ooi et al. (2005) C. H. R. Ooi et al., Phys. Rev. A 72, 023807 (2005).
- Zumbusch et al. (1999) A. Zumbusch, G. R. Holtom, and X. S. Xie, Phys. Rev. Lett. 82, 4142 (1999).
- Potma et al. (2001) E. O. Potma et al., PNAS 98, 1577 (2001).
- Cheng and Xie (2004) J. X. Cheng and X. S. Xie, J. Phys. Chem. B 108, 827 (2004).
- Heid et al. (2001) M. Heid et al., Journal of Raman Spectroscopy 32, 771 (2001).
- Xu et al. (2007) X. G. Xu et al., J. Chem. Phys. 126 (2007).
- Cheng et al. (2002) J. X. Cheng et al., J. Phys. Chem. B 106, 8493 (2002).
- Oron et al. (2003) D. Oron, N. Dudovich, and Y. Silberberg, Phys. Rev. Lett. 90, 213902 (2003).
- Lim et al. (2005) S.-H. Lim, A. G. Caster, and S. R. Leone, Phys. Rev. A 72, 041803 (2005).
- Weiner (2000) A. M. Weiner, Rev. Sci. Instrum. 71, 1929 (2000).
- Zheng and Weiner (2001) Z. Zheng and A. M. Weiner, Chem. Phys. 267, 161 (2001).
- Meshulach and Silberberg (1998) D. Meshulach and Y. Silberberg, Nature 396, 239 (1998).
- Pastirk et al. (2003) I. Pastirk et al., Opt. Express 11, 1695 (2003).
- Lozovoy et al. (2003) V. V. Lozovoy et al., J. Chem. Phys. 118, 3187 (2003).
- Dudovich et al. (2002) N. Dudovich, D. Oron, and Y. Silberberg, Nature 418, 512 (2002).
- Oron et al. (2002) D. Oron et al., Phys. Rev. Lett. 88, 063004 (2002).
- Zheltikov (2000) A. M. Zheltikov, Journal of Raman Spectroscopy 31, 653 (2000).
- Nibbering et al. (1992) E. T. J. Nibbering, D. A. Wiersma, and K. Duppen, Phys. Rev. Lett. 68, 514 (1992).
- Xu et al. (2008) X. G. Xu et al., Nat Phys 4, 125 (2008).
- Diels and Rudolph (2006) J.-C. Diels and W. Rudolph, Ultrashort Laser Pulse Phenomena (Elsevier, 2006), 2nd ed.
- Oron et al. (2004) D. Oron, N. Dudovich, and Y. Silberberg, Phys. Rev. A 70, 023415 (2004).
- Dayan et al. (2004) B. Dayan et al., Phys. Rev. Lett. 93, 023005 (2004).
- Comstock et al. (2004) M. Comstock et al., Opt. Express 12, 1061 (2004).
- Zheng and Weiner (2000) Z. Zheng and A. M. Weiner, Opt. Lett. 25, 984 (2000).