Modification of the aging dynamics of glassy polymers due to a temperature step
Abstract
Molecular dynamics simulations are used to investigate the connection between thermal history and physical aging in polymer glasses, in particular the effects of a temperature square step. Measurements of two-time correlation functions show that a negative temperature step causes “rejuvenation” of the sample: the entire spectrum of relaxation times appears identical to a younger specimen that did not experience a temperature step. A positive temperature step, however, leads to significant changes in the relaxation times. At short times, the dynamics are accelerated (rejuvenation), whereas at long times the dynamics are slowed (over-aging). All findings are in excellent qualitative agreement with recent experiments. The two regimes can be explained by the competing contributions of dynamical heterogeneities and faster aging dynamics at higher temperatures. As a result of this competition, the transition between rejuvenation and over-aging depends on the length of the square step, with shorter steps causing more rejuvenation and longer steps causing more over-aging. Although the spectrum of relaxation times is greatly modified by a temperature step, the van Hove functions, which measure the distribution of particle displacements, exhibit complete superposition at times when the mean-squared displacements are equal.
pacs:
81.40.Lm, 81.40.Lg, 83.10.Rs1 Introduction
Glassy systems include such diverse materials as network glasses, polymer glasses, spin glasses, disordered metals and many colloidal systems. These materials present great challenges to theory and simulation due to a lack of long-range order and very slow, non-equilibrium dynamics. An intriguing consequence of these “glassy dynamics” is that the properties of glasses are not stationary but depend on the wait time elapsed since vitrification: this phenomenon is usually called physical aging. Polymer glasses are particularly suited to studies of aging, since they exhibit comparatively low glass transition temperatures, and therefore thermally activated aging dynamics are measurable over typical experimental timescales. One of the most comprehensive studies of aging in polymer glasses was presented by Struik [1], who showed that after a rapid quench from the melt state, there is a particularly simple evolution of the properties of the glass. The thermodynamic variables such as the energy and the density evolve logarithmically with wait time, whereas the dynamical properties such as the creep compliance exhibit scaling with the wait time , where the exponent is approximately unity. This scaling law has also been confirmed for many other glassy systems [2], but a clear molecular level explanantion of this behavior is still being sought.
The intrinsic aging dynamics can be modified through the influence of stress and temperature [1, 3, 4, 5, 6, 7, 8]. In polymer glasses, application of a large stress usually has the effect of “rejuvenating” the glass: the entire spectrum of relaxation times is rescaled to shorter times, and closely resembles the spectrum of a younger state of the unperturbed glass [1, 9, 4]. The term rejuvenation originated with Struik’s hypothesis that the application of stress increases the free-volume available for molecular rearrangements and actually results in an erasure of aging [1]. This hypothesis is still somewhat controversial [3, 10], however the term persists and has come to denote any acceleration of the intrinsic aging dynamics. In colloidal systems, it has recently been shown that stress can lead to an apparent slowing down of the dynamics (over-aging) as well [6, 8]. The effects of temperature on the aging dynamics are similarly complex. It is well known that glasses age faster at higher temperatures; however, simply taking this fact into account is not sufficient to explain the modifications of the dynamics due to changes in temperature in the glassy state [1]. Glasses have been shown to retain a memory of previous annealing temperatures [11], therefore, the aging dynamics generally depends on the entire thermal history of the sample [12]. Recently, a set of detailed experiments were performed on polymer glasses that experienced a temperature square step after a quench to the glassy state [7]. Results showed that the simple rescaling of time with no longer described the creep compliance curves, and there are significant changes to the entire spectrum of relaxation times in comparison to a sample that did not experience a temperature step.
In a previous paper, we used molecular dynamics simulations to investigate the dynamics of a model polymer glass under a simple temperature quench followed by a creep experiment [4]. It was shown that the model qualitatively reproduces the effects of aging on the creep compliance, including the phenomenon of mechanical rejuvenation at large stresses. Additionally, through measurements of the two-time particle correlation functions, we showed that the aging dynamics of the creep compliance exactly corresponds to the evolution in the cage-escape time (the time-scale for particles to undergo a significant rearrangement leading to a new local environment). In this work, we extend our investigation of the dynamics of aging in polymer glasses by examining the effects of a short temperature square step, modeled after the protocol of the experiments presented in ref. [7]. In agreement with experiment, our simulations indicate that a downward temperature step causes rejuvenation of the relaxation times, but an upward step yields rejuvenation (faster dynamics) at short timescales, and over-aging (slower dynamics) at long timescales. In addition, we investigate the microscopic dynamics behind these relaxation phenomena through measurements of the two-time particle correlation functions and the van Hove distribution functions.
2 Methodology
We perform molecular dynamics (MD) simulations on a “bead-spring” polymer model that has been studied extensively for its glass-forming properties [13, 14]. Beads interact via a non-specific van der Waals potential (Lennard-Jones), and bonds are modeled as a stiff spring (FENE) that prevents chain crossing. The reference length-scale is , the diameter of the bead; the energy scale, , is determined by the strength of the van der Waals potential; and the time scale is , where is the mass of a bead.
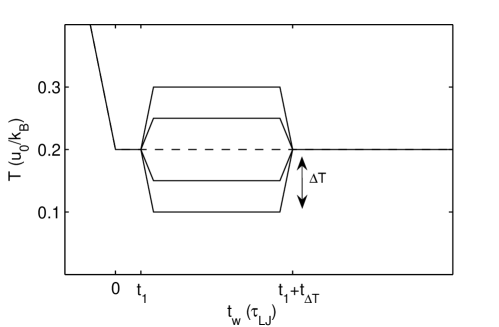
Our simulation method is similar to the one discussed in ref. [4]. We simulate 85500 beads in a cubic box with periodic boundary conditions. All polymer chains have 100 beads each. This length is not much greater than the entanglement length; however as the dynamics in glasses are very slow, reptation effects are minimal over the timescale of our simulations. The thermal procedure is detailed in Fig. 1, and is very similar to the protocol used in ref. [7] except for the obvious difference in timescales due to the limitations of molecular dynamics simulations. The glass is formed by a rapid quench at constant volume from an equilibrated melt at to a glassy temperature of ( for this model [15]). It is then aged at zero pressure and for , when the temperature is ramped to over a period of , held there for , and then returned to at the same rate. We monitor the dynamics of the system at wait times since the initial temperature quench.
3 Results
3.1 Dynamics
Two-time correlation functions are often used to measure the structural relaxations in aging glassy systems. In this study, we measure the incoherent scattering function,
| (1) |
( is the wave vector, and is the displacement vector of the atom) as well as the mean squared displacement,
| (2) |
as functions of the time after the wait time since the glass was quenched. The two-time correlation functions have two regimes:
| (3) |
describes the unconstrained motion of particles over their mean-free path; describes the dynamics at much longer timescales, where particle motions arise due to the collective relaxations of groups of particles. Only the slow part of the correlation function experiences aging, therefore discussion of the aging dynamics of refer to .
In ref. [4], we showed that if , both the incoherent scattering factor and the mean squared displacement exhibit superposition with wait time: a simple rescaling of the time variable by a shift factor causes complete collapse of the curves at different wait times, i. e.
| (4) |
and
| (5) |
The shift factor varies with the wait time in a simple power law,
| (6) |
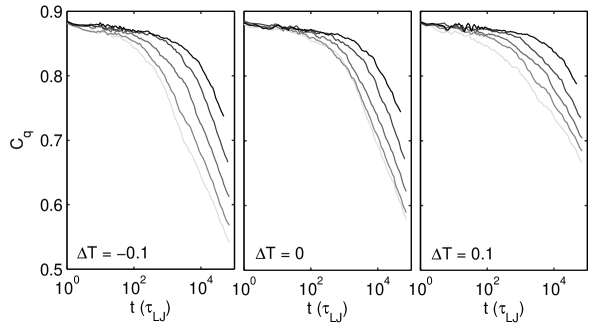
and agrees exactly with the shifts obtained from superimposing the creep compliance curves. Such a power law in the shift factors is characteristic of the aging process under a simple quench; however, ref. [7] found that the power law does not hold for a temperature square step protocol. Figure 2 shows for three temperature jumps, -0.1, 0 and 0.1. All curves exhibit a flat region at short times where atoms are relatively immobile due to the caging effect of their neighbours, followed by a rapid roll-off at longer times where atoms begin to escape from the local cages. For the negative temperature step, the curves have the same shape as the reference curves for . Superposition with wait time continues to apply and the curves are simply shifted forward in time with increasing , although the shifts are clearly different from the reference case. A positive temperature jump, however, causes a notable modification of the shape of the correlation function. The curves roll off more slowly at short wait times than long wait times, and superposition with wait time is no longer possible.
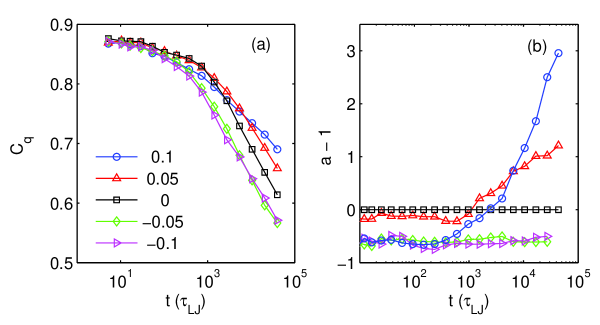
The changes in the relaxation time spectrum due to a temperature step can clearly be seen in Fig. 3(a), where is plotted for each of the temperature steps at a wait time of . Compared to the case with , a step down in temperature causes a constant shift in the correlation function toward shorter times. The glass is said to be “rejuvenated”. A positive temperature step, however, seems to cause faster relaxations (rejuvenation) at short times, and slower relaxations (over-aging) at long times. For each of these curves, we define a shift factor with respect to the sample that depends on time,
| (7) |
This quantity is exactly analogous to the effective time, , that was used to analyze the changes in the creep compliance curves after a temperature square step in ref. [7]:
| (8) |
is plotted in Fig. 3(b) for the correlation data in Fig. 3(a). These results for the incoherent scattering factor are in excellent qualitative agreement with the data obtained from the experimental creep compliance [7]. A step down in temperature causes a relatively constant, negative shift in the relaxation times, whereas a step up in temperature shows an effective time that is negative for short times, but eventually transitions to positive values for longer times.
3.2 Negative temperature step
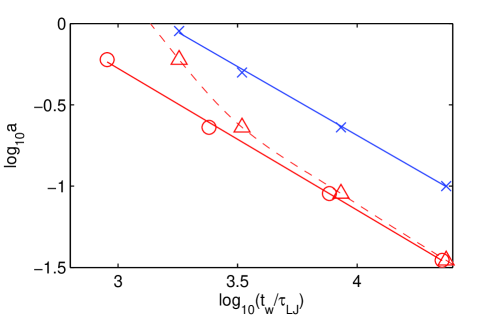
As superposition of the incoherent scattering factor with wait time continues to hold after a step down in temperature, we can monitor the aging dynamics through the standard procedure of rescaling the time variable to make a master curve of the correlation functions. Figure 4 shows the shift factors versus wait time for the data from Fig. 2 for and . The sample with no temperature step ages with the characteristic power law in , however, the sample that experienced a negative temperature step clearly does not. However, if we correct the wait time using the assumption that there is no aging at the lower temperature, , then the power law is restored. The aging exponents for these samples agree within the uncertainty of the fit at . A downward temperature step of seems to induce a trivial rejuvenation brought about by effectively “freezing” the dynamics at the lower temperature.
3.3 Positive temperature step
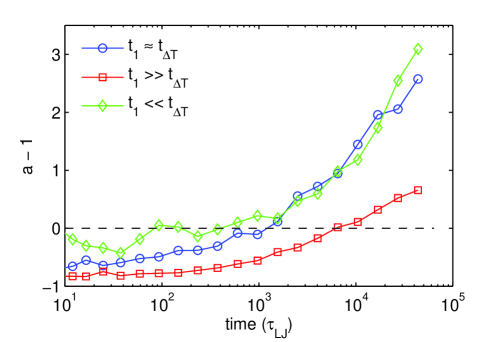
The effect of an increase in temperature cannot be described as either simple rejuvenation or over-aging, but instead the dynamics are accelerated at short times and slowed at long times. To understand the origin of the rejuvenation to over-aging transition, the relevant timescales in the protocol, and , are varied for a constant step up in temperature of . We investigate three cases: (1) , (2) and (3) . The effective time with respect to the sample with no temperature step is shown for these simulation parameters at in Fig. 5. To simplify the analysis, and were chosen such that in each of the three cases, the dynamics are measured at the same time since the end of the step. In cases (1) and (2), we clearly see rejuvenation of the short time region of the relaxation-time spectrum and a transition to over-aging at longer times; however, the transition from rejuvenation to over-aging occurs later for case (2) (shorter ). In case (3), there is no clear rejuvenation region at all, and at long times, the relaxation spectrum is almost identical to case (1).
These results may be understood based on the transient dynamics at the higher temperature. The aging dynamics in glassy systems consist of spatially and temporally heterogeneous relaxation events, whereby collective motions in a group of particles lead to small rearrangements of the cage [16, 17]. These relaxations are often called dynamical heterogeneities [18, 19]. After a first relaxation event (cage escape), it has been shown that the timescale for subsequent relaxations is shorter, and a typical group of atoms will experience many such events before finding a stable configuration [20]. Because the aging dynamics are thermally activated, immediately after the temperature of the glass is raised, the total rate of relaxation events rapidly increases and persists for a time which is related to the “life-time” of the mobile regions. Once these regions finally stabilize, the resulting structure has a lower energy than before, or an over-population of long relaxation times. Overall, as also pointed out in ref. [7], the greater rate of transitions at this temperature leads to accelerated aging with respect to a glass at the lower temperature. The results of our simulations after a temperature square step can then be understood as a competition between the initial rejuvenation due to the dynamical heterogeneities, and the over-aging that results when once they have stabilized. Therefore, a short temperature square step causes mostly rejuvenation, and long temperature steps show primarily over-aging. This picture is generally consistent with that of trap models [21] that generate glassy dynamics through a wide distribution of relaxation times. However, ref. [7] found that such models do not explain all aspects of the thermal cycling experiment since they do not address the spatial arrangement of the relaxation processes.
It is curious that the long time part of the relaxation spectrum is the same for case (1) and case (3). This may indicate the end of the rapid transient effects, and the beginning of more steady aging in the glass at the higher temperature. It would be useful to expand the study to even longer to investigate this finding.
3.4 Particle displacement distributions
In addition to the correlation functions, which provide an average picture of the particle dynamics with and , molecular dynamics simulations allow us to obtain the full distribution of displacements , where . This is also called the van Hove function [22]. The van Hove function was measured for three temperature jumps ( -0.1, 0 and 0.1), and representative curves are shown in Fig. 6 for . The distribution appears to be the combination of a narrow, caged particle distribution, and a wider distribution of “mobile” particles that have experienced a cage rearrangement. The distribution can be described by the sum of a Gaussian for the caged particles, and an exponential tail for the mobile particles:
| (9) |
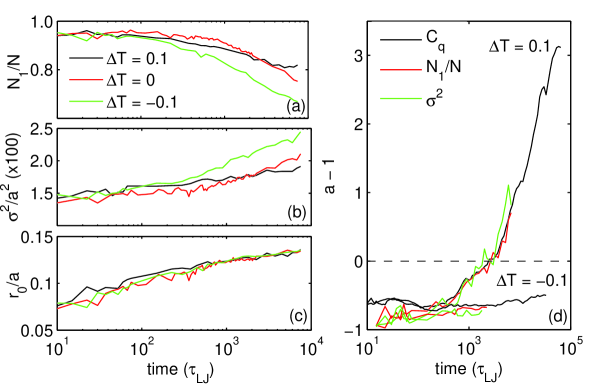
If the distribution is normalized, there are three fit parameters: , the ratio of caged particles to total particles ; , the width of the cage peak; and , the characteristic length-scale of the exponential tail. These are shown in Fig. 7(a)-(c). is relatively flat at short times, followed by a decay in the number of trapped particles that signals the onset of cage escape. The width of the cage peak, , is constant on the timescale where the particles are predominantly caged, and increases sub-diffusively in the cage escape regime possibly due to weak coupling between adjacent cages (local relaxations may somewhat affect cages nearby [23]). Alternatively, the length scale of the mobile distribution, , increases steadily with time even at the shortest timescales. The parameters and show large differences for samples undergoing different temperature jumps, however, does not. A previous study showed that the width of the mobile peak also did not depend on the wait time [4]. It seems that the shape of the mobile distribution does not exhibit memory.
The effects of the temperature step on the van Hove function can be understood by defining a time-dependent shift factor for and , in analogy to Eq. (7) for . Surprisingly, we see in Fig. 7(d) that the shift factors for both fit parameters and for are identical. This suggests that the van Hove functions after different temperature steps can be superimposed at times where their two-time correlation functions are equal,
| (10) |
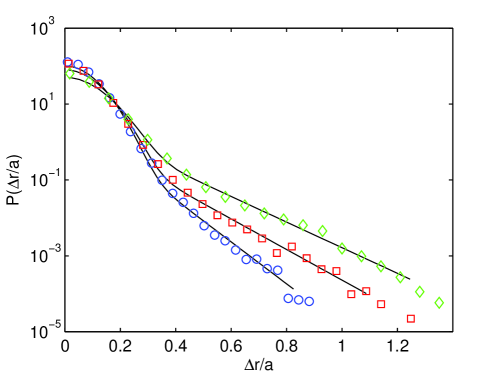
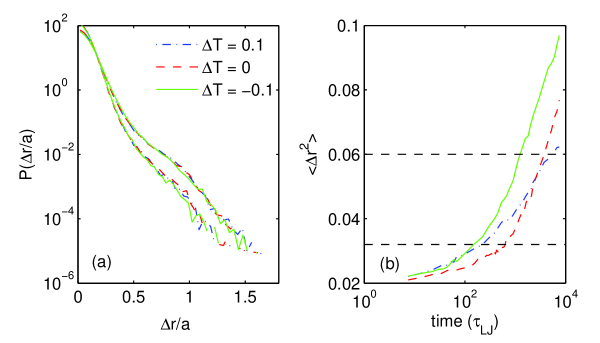
Indeed, this is what we observe in Fig. 8(a). The mean-squared displacement for this system is shown Fig. 8(b); the distributions are compared at times indicated by the intercept of the curves with the dashed horizontal lines. Note that this is not a simple rescaling of the length parameter , as there are two distinct length-scales in the system, and . Superposition of the van Hove function has also been found for variations in wait time after a simple quench from the melt [24, 4]. For this thermal protocol, the entire spectrum of relaxation times scales as , in which case a simple Landau-theory approximation predicts full scaling of the probability distributions [25]. Full scaling of the relaxation times clearly does not hold after a temperature step, therefore it can not be a necessary condition for superposition of the van Hove distributions. It seems that the relationship described in Eq. (10) is quite general.
Superposition of the van Hove functions may be a consequence of the fact that, while the relaxation times are greatly modified by wait time and temperature, the spatial scale of the relaxations is not. This microscopic length scale is determined by the density, which is known to be much less sensitive to these parameters. Although correlation lengths of rearranging clusters can be quite large in glasses, these lengths also do not appear to grow with aging [16]. If the typical size of relaxation events is approximately constant, then we can surmise that the only relevant quantity in the van Hove function is the number of relaxation events. This information is exactly expressed by the effective time that we obtained from the average correlation functions. Future work will investigate the particle trajectories in more detail to validate the spatial scale of the cage rearrangements and its relationship to the microscopic length scale of the system.
4 Conclusion
Molecular dynamics simulations of physical aging in a model polymer glass were performed using a thermal protocol modeled after recent experiments [7]. A temperature square step was applied to the glass after an initial quench from the melt, and the dynamics were monitored through the two-time correlation functions. Results show excellent agreement with experiment. A negative temperature step causes uniform rejuvenation due to reduced aging at low temperatures. A positive temperature step yields a completely different relaxation spectrum: at short times the dynamics are accelerated (rejuvenation), and at long times they are slowed (over-aging). By modifying the length of the step up in temperature, we determined that the transition from rejuvenation to over-aging is controlled by the length of the square step: short steps cause primarily rejuvenation, while long steps show marked over-aging. We also investigated the distribution of displacements, or the van Hove functions. Even though the spectrum of relaxation times was greatly modified by the temperature step, the van Hove functions showed perfect superposition at times where the mean squared displacements were equal.
5 Acknowledgements
We thank the National Sciences and Engineering Council of Canada (NSERC) and the Canadian Foundation for Innovation (CFI) for financial support. Computing resources were provided by WestGrid.
References
- [1] L. C. E. Struik. Physical Aging in Amorphous Polymers and Other Materials. Elsevier, Amsterdam, 1978.
- [2] J.-L. Barrat, J. Dalibard, M. Feigelman, and J. Kurchan. Slow relaxations and nonequilibrium dynamics in condensed matter. Springer, Berlin, 2003.
- [3] G. B. McKenna. Mechanical rejuvenation in polymer glasses: fact or fallacy? J. Phys.: Condens. Matter, 15:S737–S763, 2003.
- [4] M. Warren and J. Rottler. Simulations of aging and plastic deformation in polymer glasses. Phys. Rev. E, 76:031802, 2007.
- [5] J. Rottler and M. O. Robbins. Unified description of aging and rate effects in yield of glassy solids. Phys. Rev. Lett., 95:225504, 2005.
- [6] D. J. Lacks and M. J. Osborne. Energy landscape picture of overaging and rejuvenation in a sheared glass. Phys. Rev. Lett., 93:255501, 2004.
- [7] H. Montes, V. Viasnoff, S. Juring, and F. Lequeux. Ageing in glassy polymers under various thermal histories. J. Stat. Mech.: Theory and Experiment, page P03003, 2006.
- [8] V. Viasnoff and F. Lequeux. Rejuvenation and overaging in a colloidal glass under shear. Phys. Rev. Lett., 89:065701, 2002.
- [9] G. B. McKenna and A. J. Kovacs. Physical ageing of poly(methyl methacrylate) in the nonlinear range: torque and normal force measurements. Polym. Eng. Sci., 24:1131–1141, 1984.
- [10] L. C. E. Struik. Rejuvenation of physically aged polymers. Polymer, 38:4053–4057, 1997.
- [11] L. Bellon, S. Ciliberto, and Laroche C. Eur. Phys. Lett., 51:551, 2000.
- [12] A.J. Kovacs. Adv. Polym. Sci., 3:394, 1963.
- [13] K. Kremer and G. S. Grest. J. Chem. Phys, 92:5057, 1990.
- [14] C. Bennemann, W. Paul, K. Binder, and B. Dünweg. Molecular-dynamics simulations of the thermal glass transition in polymer melts: -relaxation behavior. Phys. Rev. E, 57:843–851, 1998.
- [15] J. Rottler and M. O. Robbins. Yield conditions for a deformation of amorphous polymer glasses. Phys. Rev. E, 64:051801, 2001.
- [16] R. E. Courtland and E. R. Weeks. Direct visualization of ageing in colloidal glasses. J. Phys.:Condens. Matter, 15:S359–S365, 2003.
- [17] L. Cipelletti and L. Ramos. Slow dynamics in glassy soft matter. J. Phys.: Condens. Matter, 17:R253, 2005.
- [18] Walter Kob, Claudio Donati, Steven J. Plimpton, Peter H. Poole, and Sharon C. Glotzer. Dynamical heterogeneities in a supercooled lennard-jones liquid. Phys. Rev. Lett., 79(15):2827–2830, Oct 1997.
- [19] K. Vollmayr-Lee and A. Zippelius. Heterogeneities in the glassy state. Phys. Rev. E, 72:041507, 2005.
- [20] P. Chaudhuri, L. Berthier, and W. Kob. Universal nature of particle displacements close to glass and jamming transitions. Phys. Rev. Lett., 99:060604, 2007.
- [21] R. A. Denny, D. R. Reichman, and J. P. Bouchaud. Trap models and slow dynamics in supercooled liquids. Phys. Rev. Lett., 90:025503, 2003.
- [22] Walter Kob and Hans C. Andersen. Testing mode-coupling theory for a supercooled binary lennard-jones mixture i: The van hove correlation function. Phys. Rev. E, 51(5):4626–4641, May 1995.
- [23] A. Heuer, B. Doliwa, and A. Saksaengwijit. Potential-energy landscape of a supercooled liquid and its resemblance to a collection of traps. Phys. Rev. E, 73:021503, 2005.
- [24] H. E. Castillo and A. Parsaeian. Local fluctuations in the ageing of a simple structural glass. Nature Physics, 3:26–28, 2007.
- [25] H. E. Castillo, C. Chamon, L. F. Cugliandolo, and M. P. Kennett. Heterogeneous aging in spin glasses. Phys. Rev. E, 88:237201, 2002.