11email: radostin.kurtev@uv.cl; jura.borissova@uv.cl 22institutetext: European Southern Observatory, Ave. Alonso de Cordova 3107, Casilla 19, Santiago 19001, Chile
22email: vivanov@eso.org 33institutetext: Universitá di Padova, Dipartimento di Astronomia, Vicolo dell’Osservatorio 5, I-35122 Padova, Italy 33email: sergio.ortolani@unipd.it
Obscured clusters. II. GLIMPSE-C02 – A new
metal rich
globular cluster in the Milky Way††thanks: Based on observations
collected with the ESO New Technology Telescope, observing program
77.D-0089., ††thanks: Table with photometry is only available
in electronic form at the CDS via anonymous ftp to cdsarc.u-strasbg.fr
(130.79.128.5) or via http://cdsweb.u-strasbg.fr/cgi-bin/qcat?J/A+A/
Abstract
Context. The estimated total number of Milky Way globulars is 16020. The question of whether there are any more undiscovered globular clusters in the Milky Way is particularly relevant with advances in near and mid-IR instrumentation.
Aims. This investigation is a part of a long-term project to search the inner Milky Way for hidden star clusters and to study them in detail. GLIMPSE-C02 (G02) is one of these objects, situated near the Galactic plane (=, =).
Methods. Our analysis is based on SOFI/NTT imaging and low resolution (R1400) spectroscopy of three bright cluster red giants in the atmospheric window. We derived the metal abundance by analysis of these spectra and from the slope of the RGB.
Results. The cluster is deeply embedded in dust and undergoes a mean reddening of 24.83 mag. The distance to the object is D=4.60.7 kpc. The metal abundance of G02 is [Fe/H]H96=0.330.14 and [Fe/H]CG=0.160.12 using different scales. The best fit to the radial surface brightness profile with a single-mass King s model yields a core radius =0.70 arcmin (0.9 pc), tidal radius =15 arcmin (20 pc), and central concentration c=1.33.
Conclusions. We demonstrate that G02 is new Milky Way globular cluster, among the most metal rich globular clusters in the Galaxy. The object is physically located at the inner edge of the thin disk and the transition region with the bulge, and also falls in the zone of the “missing” globulars toward the central region of the Milky Way.
Key Words.:
Galaxy: globular clusters: general - Galaxy: abundances - stars: distances - stars: abundances1 Introduction
Star clusters provide us with unique conditions to investigate various aspects of stellar astrophysics under tightly “controlled” conditions – the clusters are samples of stars with similar ages, metallicities and distances. The Galactic globular clusters (GCs) can be used to collect information about the formation and early evolution of the Milky Way.
The large area infrared (IR) surveys (i.e. 2MASS, Skrutskie et al. skr06 (2006)) have discovered a number of new clusters, hidden by the dust extinction in the plane of the Milky Way. These objects usually suffer AV10-20 mag of extinction, making them invisible in the optical wavebands. The vast majority of them appear to be a few million years old (Ivanov et al. iva02 (2002), iva05 (2005); Borissova et al. bor03 (2003), bor05 (2005), bor06 (2006); Kurtev et al. kurt07 (2007)) but a few have proved to be analogues of “classical” globular clusters (Hurt et al. hur00 (2000), Ortolani, Bica & Barbuy ort00 (2000), Kobulnicky et al. kob05 (2005), Carraro car05 (2005), Froebrich, Meusinger & Scholz froe07 (2007)). There are probably 10 “missing” globulars in the central region of the Milky Way, based on the asymmetry of the GC distribution (Ivanov, Kurtev & Borissova iva05a (2005)).
Spitzer Space Telescope Galactic Legacy Infrared Mid-Plane Survey Extraordinaire (GLIMPSE, Benjamin et al. ben03 (2003)) offers an excellent opportunity to carry out an even deeper census of such objects than it is possible in the near-IR because of the lower extinction at longer wavelengths. A comprehensive search for clusters using the point source catalog of GLIMPSE found 92 candidates (Mercer et al. mer05 (2005)). As a part of our long-term project to find and characterize new Milky Way clusters we studied some of them using deep near-IR imaging and low resolution IR spectroscopy. In the course of this study we concluded that the candidate Nr. 3 in their list (Fig. 1) is a new Galactic metal rich globular cluster. Here we present the evidence and we report its properties – metallicity, extinction and distance. We will refer to the new cluster as GLIMPSE-C02 (G02), for consistency with the designation of Kobulnicky et al. (kob05 (2005)).

2 Observations and data reduction
All observations were obtained with SofI/NTT (Son of ISAAC; Moorwood, Cuby & Lidman mor98 (1998)) on Apr 15, 2006. The instrument was equipped with a Hawaii HgCdTe 10241024 detector, with a pixel scale of 0.288 arcsec px-1. For the spectroscopy we used a 1 arcsec slit and the medium-resolution grism, yielding a resolution of R1320 at 2.2 m. The seeing for all observations was 1-1.5 arcsec and the sky was photometric.
We collected a total of 16 min integration in each of the filters, split into 16 images, jittering within a 3 arcmin square box to ensure that there is minimum overlapping of the cluster position. Each individual image was the average of 320 sec frames in , 610 sec frames in , and 106 sec frames in . The data reduction included flat fielding, sky subtraction, alignment and combination of the individual images. The stellar photometry was carried on the final images with ALLSTAR in DAOPHOT II (Stetson ste93 (1993)). The typical photometric errors vary from 0.01 mag for stars with 10 mag to 0.10 mag for 18 mag and 0.15 mag for 19 mag. The photometric calibration was performed by comparing our instrumental magnitudes with the 2 MASS measurements of about 1200 stars, covering the color range 0.06.0 mag and magnitude range 10.015.0 mag. The final photometry list contains equatorial coordinates and magnitudes of 7623 stars with photometric errors less than 0.15 mag. Artificial star tests show that the 80% completeness limit of the photometry is at =18.9 and =17.3 mag.
The spectra cover the 2.00-2.35 m region. Fortuitously, the slit could be placed to contain 12 stars. The telescope was nodded along the slit between the exposures to simultaneously observe the targets and clear sky. In total, we obtained 8 images of 300 sec. First, we flat fielded them and removed the sky emission by subtracting from each field the images from each nodding pair. Next, we extracted 1-dimensional spectra with the IRAF111IRAF is distributed by the National Optical Astronomy Observatory, which is operated by the Association of Universities for Research in Astronomy, Inc., under cooperative agreement with the National Science Foundation (NSF). task APALL, wavelength calibrated them with the NeXe lamp spectra (extracted at the location of the science target spectra), and combined them into final 1-dimensional spectra. Finally, we divided them by the spectra we took from the solar near-analog HIP 59642 (HD 106290) of type G1V, and multiplied them by a solar spectrum to remove the artificial emission lines due to the intrinsic absorption features in the spectra of the standard (see Maiolino, Rieke & Rieke mai96 (1996)).
3 Properties of G02
3.1 Extinction and distance
The color-magnitude diagram (CMD) of G02 is plotted in Fig. 2. The left panel contains all stars with and photometry. It is clearly dominated by field stars. Two main sequences (MS) are evident: a nearby, bright one at 0-1 mag and 8.5-17.5 mag, and a distant, reddened one at 2-4 mag and 12-17.5 mag. There is an indication of a red clump sequence, starting at 3 mag, 13.3 mag and extending redwards toward fainter magnitudes due to extinction. The cluster red giant branch (RGB) is distinctly visible at 4.5-5.5 mag in the middle panel where we intentionally selected a relatively small region with radius R=60 arcsec near the center of G02 to reach good cluster-to-field contrast. Finally, the “field” annulus on the right panel, with an inner radius of 138 arcsec and an outer radius of 150.48 arsec and identical area, contains a mixture of populations and it probably still includes some cluster members but we refrain from using a more distant comparison area because of the clumpy dust absorption that might severely affect the number of field stars and compromise the background subtraction.


The color-color diagram of the cluster field is shown in Fig. 3. A comparison of the locus, occupied by cluster stars, with the unreddened RGB and MS sequences of Frogel et al. (fro78 (1978)) yields extinction toward G02 of AV24.53 mag corresponding to a K-band extinction of AK2.750.3 mag. Some of the extinction spread might be contributed to differential extinction across the face of the clusters, contamination from extended emission and background sources. Here and throughout the rest of this paper we use the reddening law of Rieke & Lebofsky (rie85 (1985)). Interestingly, the reddening line appears to deviate slightly from the sequence of the reddened stars which may indicate anomalous dust properties in the direction toward G02.
The cluster luminosity function (LF) is shown in Fig. 3. The presence of red giant clump stars is evident and a Gausian fit of the bump in the LF gives a mean value of =14.40.15 mag. The clump has an absolute magnitude of =1.830.03 mag (Alves alv00 (2000), Eqn. 3), yielding a distance modulus of 13.450.3 mag. Here we used [Fe/H]=0.33 (see Section3.2).
The distance to the cluster can also be measured from the RGB tip brightness (Ivanov & Borissova iva02 (2002)). This method is hampered by the small number of stars at the upper end of the RGB in GCs. Nevertheless, we applied this test as a consistency check. Assuming [Fe/H]=0.33 we obtain an absolute K-band magnitude for the tip of =6.8 mag (Ivanov & Borissova iva02 (2002)). The apparent magnitude of the tip is 9.5 mag, yielding 13.52 mag, in excellent agreement with our previous estimate.
We calculated the reddening and distance using the Padova isochrones (Girardi et al. girar00 (2000)) interpolated for metallicity [Fe/H]=0.33. The RGB color at the level of the HB is -=4.75. The true color, obtained from the isochrones, is 0.7 which yields (-)=4.05 mag, corresponding to =4.05x6.2=25.1, consistent with our previous discussion. The yielded distance modulus using =1.55 (from Padova isochrones) is 12.85, close to both upper values.
Finally, we obtain the mean values of AV24.83 mag, 13.30.3 mag, and D=4.60.7 kpc for the reddening, the true distance modulus, and the distance to the cluster.

3.2 Metal abundance
We derived the metal abundance of the cluster using two independent techniques. First, from the spectra of three cluster red giants (listed in Table 1), we applied the method of Frogel et al. (fro01 (2001)), which is based on the behavior of the K-band spectral indices, IR magnitudes, and colors. The individual reddening and true color of each star are obtained by moving the star along the reddening vector until it crosses the luminosity class III sequence taken from Frogel et al. (fro78 (1978)). All these stars are located near the cluster center, and two of them (#1 and #3) lie directly on the cluster RGB, making them highly probable members. The last one (star #2) suffers from less reddening (0.8 mag), but the observed differential reddening variations could account for this. Indeed, the width of the cluster star locus on the color-magnitude and color-color diagram suggests reddening variations across the face of the cluster of the order of 0.3 mag. Therefore, the reddening of star #2 is identical to that of the other two red giants with spectra, within 3 and differs in less than 2 from the mean reddening toward the cluster. Furthermore, its angular separation of only 12 arcsec from the cluster center strengthens the possibility that this star is a cluster member.
The spectra are plotted in Fig. 5. We measured the equivalent widths of the Na 2.20 m, Ca 2.26 m, and CO 2.3 m features, and applied the calibration (eqn. 4 of Frogel et al. fro01 (2001)) that takes into account also the stellar color (-)0 and absolute magnitude . The results are listed in Table 1. Averaging the three estimates from the spectroscopy we obtain [Fe/H]=0.290.10, in the metallicity scale of Zinn (as implemented in Harris har96 (1996)). Omitting star #2, we obtain [Fe/H]=0.340.10. The remaining nine stars with spectra were not suitable for metallicity measurements either because they were too faint or because they were early-type field stars.
| Star | EW, Å | (-)0 | [Fe/H] | ||||
|---|---|---|---|---|---|---|---|
| Na | Ca | CO | mag | mag | mag | ||
| #1 | 4.78 | 3.62 | 15.44 | 0.826 | 3.002 | 4.828 | 0.29 |
| #2 | 5.88 | 2.35 | 12.48 | 0.601 | 2.188 | 4.324 | 0.20 |
| #3 | 4.89 | 1.57 | 10.33 | 0.722 | 2.970 | 4.616 | 0.39 |
-
The table contains the equivalent widths of Na, Ca and CO lines, true color (-)0, individual reddening (), absolute magnitude (), and metallicity in the scale of Zinn. In the calculation of the absolute magnitude we used the mean distance modulus to the cluster: 13.3.

Next, we derived the abundances from the RGB slope. This method was pioneered by Da Costa & Armandroff (dac90 (1990)) and it relies on the metallicity-dependent opacities in cool stars. The RGB slope is not affected by the reddening, which is an important advantage in studies of heavily obscured objects. A critical point is to remove the field contamination which can affect the RGB slope because it represents a population with different physical parameters. To achieve this we used a Monte-Carlo simulation dividing the RGB locus – spanning the ranges 10.8S16.8 mag and 4.3S5.7 mag – on the CMD into bins with sizes 0.5 and 1.2 mag along the X and Y axis, respectively. Then, we randomly removed from each bin of the cluster CMD as many stars as were present in the corresponding bin of the field CMD, and determined the cluster RGB slope in two iterations, removing the 10 outliers. This was an intentionally selected conservative constraint to ensure that we do not remove RGB stars or introduce magnitude-related biases. We repeated this process 300 times and calculated the average slope and the slope r.m.s.: 0.1370.012. The calibration of Ivanov & Borissova (iva02a (2002)) yields [Fe/H]=0.380.14 in the scale of Zinn (as implemented in Harris har96 (1996)), and [Fe/H]CG=0.340.12 in the scale of Carretta & Gratton (car97 (1997)).
Given the uncertainties of both methods, the results are consistent within the errors and we can only state that G02 is among the most metal rich GC in the Galaxy. We adopt the average Zinn scale metallicity of [Fe/H]=0.330.14, where the error is tentatively assigned to the worse error of the two estimates. The corresponding mean metallicity in the scale of Carretta and Gratton is [Fe/H]CG=0.160.14. In “The Milky Way Globular Cluster Catalog”, 7-th edition of Harris (har96 (1996)) one can find only five clusters with higher metallicity: Liller 1, Terzan 5, NGC 6528, Palomar 10, and NGC 6553.
3.3 Structural parameters and position in the Milky Way
To obtain reliable structural parameters and to separate the intrinsic CMD morphology of the cluster from the field we apply the statistical decontamination procedure described in Bonatto & Bica (bonatto08 (2008)). Typical cell dimensions used are = mag and ()=()= mag, optimal to allow sufficient star-count statistics in the individual cells, without affecting the morphology of the cluster CMD. The comparison field was the same as in the previous sections.
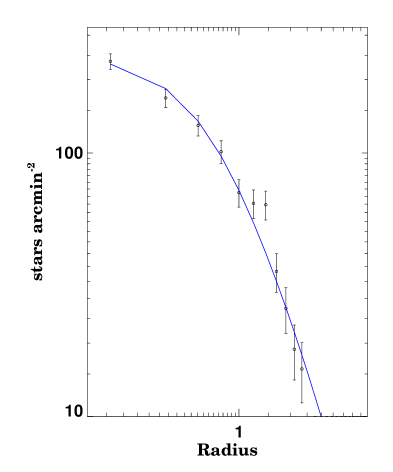
The structural parameters of G02 were determined using the iterative star count method of King (kin62 (1962)). The best fit to the radial surface brightness profile with a single-mass King’s model yields a core radius =0.70 arcmin (0.9 pc), tidal radius =15 arcmin (20 pc), and central concentration c=1.33. The radial density profile (RDP) of the cluster together with the best fit King-like profile are presented in Fig. 6. The bins at 1.4 and 1.6 arcmin differ from the profile (in one and three standard deviations respectively) and present an excess of the stellar RPD. The most probable explanation of this fact is the variable extinction toward the cluster caused by the clumpy structure of the absorbing matter. Nevertheless, the Kolmogorov-Smirnov tests give a very satisfactory probability of 0.97 for this profile fit.
The cluster is situated very near to the Galactic plane with galactic coordinates X=4.46, Y=1.12 and Z=0.05 in kpc (defined as in Harris (har96 (1996)), assuming D=4.6 kpc). It is located inside the thin disk, at its inner edge and the transition region with the bulge.
4 Summary
We found that the object No. 3 from the list of Mercer et al. (mer05 (2005)) is a new Milky Way globular cluster, and designate it GLIMPSE-C02 as the second GC discovered from GLIMPSE data. The analysis based on deep images and moderate resolution K-band spectra of three probable members reveals a compact, metal rich cluster, with [Fe/H]=0.330.14 in the scale of Zinn. The cluster is situated near the Galactic plane behind AV24.83 mag of visual extinction, inside the thin disk, at its inner edge and the transition region with the bulge. The mean distance estimated from the red giant clump stars, tip of the RGB, and isochrone fits is D4.60.7 kpc, placing G02 in the zone of the “missing” globulars.
Acknowledgements.
RK acknowledges support from Proyecto Fondecyt Regular # 1080154 and DIPUV grant No 36/2006 Universidad de Valparaiso, Chile. Support for JB is provided by Proyecto Fondecyt Regular # 1080086, Centro de Astrof sica FONDAP No. 15010003, the Chilean Centro de Excelencia en Astrof sica y Tecnolog as Afines (CATA), and DIPUV grant No 36/2006, Universidad de Valparaiso. This publication makes use of data products from the Two Micron All Sky Survey, which is a joint project of the University of Massachusetts and the Infrared Processing and Analysis Center/California Institute of Technology, funded by the National Aeronautics and Space Administration and the National Science Foundation. This research has made use of the SIMBAD database, operated at CDS, Strasbourg, France.References
- (1) Alves, D. 2000, ApJ, 539, 732
- (2) Benjamin, R.,Churchwell, E., Babler, B. et al. 2003, PASP, 115, 953
- (3) Bonatto, C., & Bica, E. 2008, A&A, 479, 741
- (4) Borissova, J., Pessev, P., Ivanov, V.D. et al. 2003, A&A, 411, 83
- (5) Borissova, J., Ivanov, V.D., Minniti, D., Geisler, D., & Stephens, A.W. 2005, A&A, 435, 95
- (6) Borissova, J., Ivanov, V.D., Minniti, D., & Geisler, D., 2006, A&A, 455, 923
- (7) Carraro, G. 2005, ApJLetter, 621, 61
- (8) Carretta, E., & Gratton, R.G. 1997, A&AS, 121, 95
- (9) Da Costa, G., & Armandroff, T. 1990, AJ, 100, 162
- (10) Froebrich, D., Meusinger, H., & Scholz, A 2007, MNRAS, 377, 54
- (11) Frogel, J.A., Persson, S.E., Matthews, K., & Aaronson, M. 1978, ApJ, 220, 75
- (12) Frogel, J.A., Stephens, A., Ramirez, S., & DePoy, D. 2001, AJ, 122, 1896
- (13) Girardi, L., Bressan, A., Bertelli, G., & Chiosi, C. 2000, A&AS, 141, 371.
- (14) Harris, W.E. 1996, AJ, 112, 1487
- (15) Hurt, R.L., Jarrett, T.H.. Kirkpatrick, J.D. et al. 2000, AJ, 120, 1876
- (16) Ivanov, V.D., & Borissova, J. 2002, A&A, 390, 937
- (17) Ivanov, V.D., Borissova, J., Pessev, P., Ivanov, G.R., & Kurtev, R. 2002, A&A, 394, L1
- (18) Ivanov, V.D., Borissova, J., Bresolin, F., & Pessev, P. 2005, A&A, 435, 107
- (19) Ivanov, V.D., Kurtev, R., & Borissova, J., A&A, 442, 195
- (20) King, I. 1962, AJ, 67, 471
- (21) Kurtev, R., Borissova, J., Georgiev, L., Ortolani, S., & Ivanov, V. D. 2007, A&A, 475, 209
- (22) Kobulnicky, H.A., Monson, A.J., Buckalew, et al. 2005, AJ, 129, 239
- (23) Maiolino, R., Rieke, G.H., & Rieke, M.J. 1996, ApJ, 111, 537
- (24) Mercer, E., Clemens, D., & Meade, M. 2005, ApJ, 635, 560
- (25) Moorwood, A., Cuby, J.G., & Lidman, C. 1998, The Messenger 91, 9
- (26) Ortolani, S., Bica, E., & Barbuy, B. 2000, A&A, 361, 57
- (27) Rieke, G.H., & Lebofsky, M.J. 1985, ApJ, 288, 618
- (28) Skrutskie, M.F., Cutri, R.M., Stiening, R. et al. 2006, AJ, 131, 1163
- (29) Stetson, P.B. 1993, User’s Manual for DAOPHOT II
- (30) van den Bergh, S. 1998, A&A Rev., 9, 273