The kinetic temperature of a molecular cloud at redshift 0.9: Ammonia in the gravitational lens PKS 1830–211
Abstract
Context. Little is known about the structure of the interstellar medium and the nature of individual clouds in galaxies at intermediate redshifts. The gravitational lens toward PKS 1830–211 offers the unique possibility to study this interstellar gas with high sensitivity and angular resolution in a molecular cloud that existed half a Hubble time ago.
Aims. This multi-line study aims at a better definition of the physical properties of a significantly redshifted cloud.
Methods. Using the Green Bank Telescope (GBT), we searched for ammonia (NH3) toward PKS 1830–211.
Results. We have detected all ten observed metastable 2 cm ammonia lines. The (,) = (1,1) to (10,10) transitions, up to 1030 K above the ground state, were measured in absorption against the radio continuum of the lensed background source. The ammonia absorption appears to be optically thin, with absolute peak flux densities up to 2.5% of the total continuum flux density. Measured intensities are consistent with a kinetic temperature of 80 K for 80–90% of the ammonia column. The remaining 10–20% are warmer, with at least some of this gas reaching kinetic temperatures of 600 K. Toward the south-western continuum source, the column density is (NH3) (5–10)1014 cm-2, which implies a fractional abundance of (NH3) (1.5–3.0)10-8. Similarities with a hot NH3 absorption component toward the Sgr B2 region close to our Galactic center, observed up to the (18,18) line, suggest that the Sgr B2 component also consists of warm diffuse low-density gas. The warm absorption features from PKS 1830–211 are unique in the sense that they originate in a spiral arm.
Key Words.:
Galaxies: abundances – Galaxies: ISM – Galaxies: individual: PKS 1830-211 – Galaxies: spirals – Radio lines: galaxies1 Introduction
Studies of interstellar emission and absorption lines are complementary. While emission commonly traces an extended gas reservoir, which provides information on global properties such as mass and kinematics, absorption tends to trace a spatially far smaller region confined by the angular extent of a continuum background source. Absorption lines allow us to derive optical depths directly from line to continuum flux density ratios; the strength of the absorption depends on the flux of the background source and is decoupled from the distance to the absorber. Thus, for objects at significant redshifts, studies of interstellar absorption lines have the potential to provide unique information on otherwise inaccessible regions, combining extremely high sensitivity with outstanding spatial resolution (e.g., Chengalur et al. chengalur99 (1999); Wiklind & Combes wc99 (1999)).
In spite of extended surveys, multi-line molecular absorption systems have so far only been discovered toward five distant targets (Wiklind & Combes wc94 (1994), wc95 (1995), 1996a ; 1996b ; Kanekar et al. kanekar05 (2005)), all of which are located at intermediate redshifts (0.250.89). The two most notable absorbers, those toward B0218+357 and PKS 1830–211, share a number of common properties. They have similar redshifts (=0.68 and 0.89, respectively), show the highest line-of-sight column densities, and originate in gravitational lenses. Toward both systems the respective background sources, probably a BL Lac object and a blazar, respectively (e.g. Kemball et al. kem01 (2001); De Rosa et al. ros05 (2005)), are lensed into three dominant features, a north-eastern and a south-western hotspot and an Einstein ring. Optical or near infrared and radio separations of the hotspots differ due to optical obscuration (Courbin et al. courbin98 (1998); York et al. york05 (2005)). The lensing galaxies themselves are spirals viewed almost face-on (Courbin et al. courbin02 (2002); Winn et al. winn02 (2002); York et al. york05 (2005)). The bulk of the absorption arises in both cases from in front of the south-western of the two main radio continuum images, at radial distances of 2 and 4 kpc from the center of the respective lens (e.g., Frye et al. frye97 (1997); Swift et al. swift01 (2001); Meylan et al. mey05 (2005); York et al. york05 (2005)). In both cases, this absorption originates in the south-western spiral arm of the parent galaxy.
There are also significant differences between B0218+357 and PKS 1830–211: one is image separation (334 versus 970 mas; e.g., Jin et al. jin03 (2003); Wucknitz et al. wuck04 (2004)); another is time delay (10 versus 25 days; e.g., Lovell et al. lov98 (1998); Biggs et al. biggs01 (2001)). With respect to the detection of molecular absorption lines, the most striking differences are the continuum levels and the complexity of the absorption systems. B0218+357 hosts two molecular components separated by 13 km s-1 observed toward the south-western continuum image (Menten & Reid menten96 (1996); Jethava et al. jethava07 (2007); Muller et al. muller07 (2007)). Toward PKS 1830–211, weak molecular absorption is also measured toward the north-eastern radio continuum hotspot, displaced by –147 km s-1 from the dominant south-western absorption component (Wiklind & Combes wc98 (1998)). Furthermore, there is Hi absorption at =0.19 (Lovell et al. lovell96 (1996)).
PKS 1830–211 is one of the most prominent compact radio sources in the sky and therefore an ideal target for absorption line studies at radio wavelengths. Molecular species that have been detected include CS, HCN, HCO+, HNC and N2H+ (Wiklind & Combes 1996b ), CO (Gerin et al. gerin97 (1997)), OH (Chengalur et al. chengalur99 (1999)) and C2H, H2CO, C3H2, and HC3N (Menten et al. menten99 (1999)). The 21 cm line of Hi was also observed at =0.89 (Chengalur et al. chengalur99 (1999)). Muller et al. (muller06 (2006)) determined CNO and sulfur isotope ratios.
PKS 1830–211 provides a unique view of a molecular cloud at more than half a Hubble time in the past (-cosmology with =73 km s-1 Mpc-1, = 0.28 and = 0.72; Spergel et al. sper07 (2007); 1 mas corresponds to 7.5 pc). With a luminosity distance of 5.5 Gpc it is the farthest molecular cloud known to date that can be studied in detail. The nature of this object is, however, poorly understood. In an attempt to constrain the physical properties of the target and motivated by the recent detection of NH3 toward B0218+357 (Henkel et al. henkel05 (2005)), we searched for NH3 absorption to evaluate the still poorly constrained physical parameters of the absorbing molecular gas.
2 Observations
The (,) = (1,1) to (7,7) inversion lines of NH3 were observed with the Green Bank Telescope (GBT) of the NRAO111The National Radio Astronomy Observatory is a facility of the National Science Foundation operated under cooperative agreement with Associated Universities, Inc. on 2003 April 24. On 2004 May 21–22, the (1,1), (2,2), (4,4) to (6,6), and (8,8) to (10,10) lines were also measured. The lines observed with a beam size of 1′ cover a frequency range of 12.56–15.17 GHz, accounting for a redshift of =0.88582. We used a dual-beam Ku-band receiver in a total power observing mode. The source was positioned alternately between the two beams, cycling after 2 minutes at each position. During the 2003 observations, we employed an electronic beam switch. Because we found that the beam switch did not improve baseline performance, it was not used during the 2004 observations.
During the 2003 observations, we configured the backend in a single spectral window covering 50 MHz. The (1,1) and (2,2) lines fit in a single 50 MHz window and were observed simultaneously, while all other lines were measured individually. During the 2004 observations, two spectral windows were measured simultaneously, each window centered on a line. We determined the continuum level of PKS 1830–211 using the GBT continuum backend during pointing scans. We first calibrated the flux density scale using measurements of the flux calibrators 3C286 and 3C48, and then adjusted this scale for elevation-dependent gain variations.
Data were processed using AIPS++. We determined a mean continuum level from the baseline of each spectrum and then scaled the spectra to match this continuum level to the value measured during the pointing scans. For spectral line analysis, a low order (2) polynomial baseline was fit and removed from the unsmoothed spectra. We estimate that the overall uncertainty in the flux density scale of the absorption lines is 15%. The (1,1) and (2,2) spectra were affected by interference that caused a ripple in the baseline and contributed additional uncertainty to the flux, estimated to be 10%.
3 Results
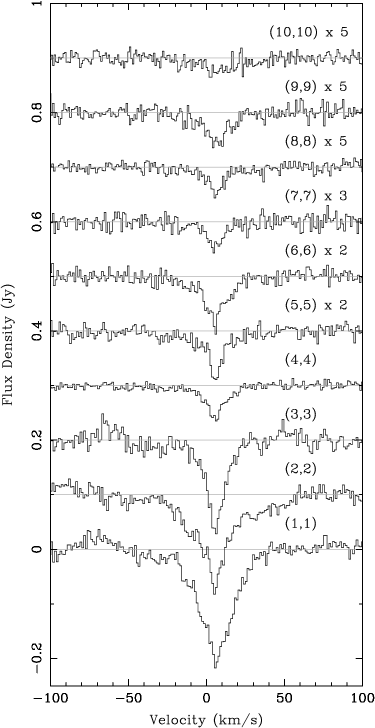
The continuum flux density of PKS 1830–211 was found to be 8.12 Jy at 12.8 GHz on 2003 April 24 and 6.45 Jy at 14.0 GHz on 2004 May 21. We estimate the uncertainty to be 10%. Fig. 1 shows the measured ammonia (NH3) absorption profiles up to the ()=(10,10) line, 1030 K above the ground state. Obviously, the presence of lines from such highly excited states requires the presence of a warm molecular medium. Absorption displaced by –147 km s-1 was not seen. While baseline ripples prevent the determination of a reliable upper limit for the (1,1) line of this velocity component, 1 noise levels of the (2,2) and (3,3) lines are 9 and 10 mJy for a 1.1 km s-1 channel, respectively.
The inversion lines are characterized by a narrow main feature of width 15 km s-1, centered at slightly positive velocities and reaching in the (1,1) line about –2.5% of the total continuum flux density. In the (1,1), (2,2), and perhaps the (3,3) line there is also a wider component that can be interpreted as evidence for satellite absorption at offsets of about 10 and 20 km s-1 from the main feature (see e.g. Ho & Townes ho83 (1983) for a detailed (1,1) spectrum). Alternatively, the blue-shifted line wings may show the –21 and –3 km s-1 features mentioned by Muller et al. (muller06 (2006)). Irrespective of their origin, the weakness of these absorption components indicates optically thin absorption, which is consistent with single-component Gaussian fits that incorporate the hyperfine structure of the (1,1) to (3,3) lines.
Table 1 displays integrated optical depths, velocities, and linewidths for all measured transitions. Optical depths were derived for a source covering factor = 1 using
with and denoting line and continuum temperature, respectively.
Comparing the data from 2003 and 2004 (this refers to the (1,1), (2,2), and (4,4) to (6,6) lines), the perfect agreement of integrated optical depths in the (5,5) line is fortuitous, but the agreement is generally very good. This indicates that line and continuum flux densities are well correlated. For those transitions that were observed twice, the 2003 data tend to have higher signal-to-noise ratios and are therefore shown in Fig. 1.
Figure 2 shows a “Boltzmann plot” (rotation diagram) including the ten measured “metastable” (=) NH3 inversion lines. The sum of the column densities of the two states of an inversion doublet,
( in cm-2; in K; in GHz), is normalized and plotted against the energy above the ground state. Normalization is obtained by dividing by the statistical weight of the respective transition, which is (2+1) , with = 1 for para-NH3 ( = 1, 2, 4, 5, 7, 8, 10) and = 2 for ortho-NH3 (=3, 6, 9). The a priori unknown excitation temperature of the observed inversion lines is denoted by . The levels of a given inversion doublet are separated by only 1.2 K. However, depending on their quantum numbers and , these doublets cover an enormous range of excitation conditions.
Since critical densities are similar (due to similar frequencies, Einstein coefficients, and collision rates; e.g., Danby et al. danby88 (1988); http://www.strw.leidenuniv.nl/moldata/), we can assume that the excitation temperature is the same for all observed metastable inversion lines. If all the level populations were determined by a single rotational temperature, the distribution of data points in Fig. 2 would be well fitted by a straight line whose inverse slope would be a measure of that temperature, . Since radiative transitions between different metastable inversion doublets are, to first order, forbidden and since the metastable doublets are located at the bottom of their respective “-ladder” (see Rohlfs & Wilson rohlfs03 (2003) for a level diagram), the population of the metastable levels cannot rapidly decay to lower states and is also a measure of kinetic temperature.
From Fig. 2, rotation temperatures can at best be fitted in a piecemeal fashion in the following sense: For para-ammonia, a comparison of the (,) = (1,1) and (2,2) lines gives 35 K. For the (2,2) and (4,4) lines, the corresponding value becomes 60 K. The (4,4) and (7,7) lines imply 175 K and the (7,7) to (10,10) lines indicate 600 K. The ortho-ammonia lines fit well into this general trend of steeply rising rotation temperature with increasing rotational quantum number . Since frequencies of the ammonia lines are quite similar (Sect. 2), the resulting temperatures are not strongly affected by differences with respect to beam size or morphology of the background continuum.
Adding up the column densities of the observed inversion doublets, we obtain (NH3)/ = 2.31013 cm-2/K, with 4.11012 cm-2/K of this column belonging to the ortho-species. The populations of the (1,1) to (3,3) doublets cover 85% of the total observed column density, while the (10,10) doublet contributes 0.7% (see Sect. 4.3 for a more detailed discussion).
| Line | ||||
|---|---|---|---|---|
| (km s-1) | ||||
| NH3 (1,1) | 0.661 (0.120) | +9.0 (0.1) | 27.3 | (0.3) |
| 0.895 (0.164) | +8.6 (0.5) | 34.9 | (1.2) | |
| NH3 (2,2) | 0.599 (0.109) | +7.4 (0.2) | 33.6 | (0.5) |
| 0.429 (0.082) | +10.5 (0.4) | 20.8 | (1.0) | |
| NH3 (3,3) | 0.330 (0.050) | +8.6 (0.1) | 15.6 | (0.3) |
| NH3 (4,4) | 0.137 (0.021) | +8.4 (0.2) | 17.3 | (0.4) |
| 0.105 (0.022) | +9.1 (0.7) | 14.7 | (1.7) | |
| NH3 (5,5) | 0.101 (0.016) | +8.3 (0.3) | 16.9 | (0.6) |
| 0.101 (0.017) | +8.7 (0.5) | 20.6 | (1.3) | |
| NH3 (6,6) | 0.111 (0.017) | +8.1 (0.2) | 20.4 | (0.6) |
| 0.091 (0.040) | +8.5 (0.6) | 14.8 | (1.4) | |
| NH3 (7,7) | 0.035 (0.006) | +10.9 (0.4) | 13.4 | (0.9) |
| NH3 (8,8) | 0.029 (0.006) | +8.5 (0.6) | 14.8 | (1.4) |
| NH3 (9,9) | 0.037 (0.007) | +8.8 (0.7) | 20.7 | (1.6) |
| NH3 (10,10) | 0.024 (0.005) | +10.2 (2.0) | 36.9 | (5.0) |
a) From Gaussian fits adopting =0.88582 and assuming that the continuum source covering factor is =1. Standard deviations are given in parentheses. In cases in which a line was measured twice, the upper line refers to data taken in 2003 (see Sect. 2). The errors in the integrated optical depths include a 15% calibration uncertainty, a 10% uncertainty due to interference in the (1,1) and (2,2) spectra, and the standard deviation from the Gaussian fit. For and , standard deviations were obtained from Gaussian fits alone.

4 Discussion
4.1 The nature of the absorbing cloud
The molecular lens in PKS 1830–211 was originally considered to host a diffuse cloud, possibly corresponding to the intercloud medium of a giant molecular complex (Wiklind & Combes 1996b ). Subsequently, the chemistry of the absorbing cloud was found to show a number of properties reminiscent of Galactic cold dark clouds (Menten et al. menten99 (1999); Shah et al. shah99 (1999); Muller et al. muller06 (2006)). Menten et al. (menten99 (1999)) found remarkable similarities to the dark cloud TMC-1, apart from C3H2 and HC3N, which are known to be anomalously abundant in TMC-1. For many molecules, including C3H2 and HC3N, but excluding CS and C2H, there is also good agreement with measurements of the dark cloud L 183 (L 134 N). Shah et al. (shah99 (1999)) mention that there is little evidence that physical conditions vary substantially between the PKS 1830–211 column and the column of the dark cloud L 134. They note, however, that the deuterium enhancement of PKS 1830–211 is too low for a “normal” dark cloud, a conclusion that is based on their non-detections of DCN and DCO+. Muller et al. (muller06 (2006)) find a [HCN]/[HNC] abundance ratio of 2.5, which they interprete as support for the dark cloud scenario even though the ratio is at the very upper end of the range of values for this class of objects (e.g., Hirota et al. hirota98 (1998)). Muller et al. (muller06 (2006)) also report the detection of an anomalously high abundance of H2S in PKS 1830–211. They suggest that this may be either a consequence of a high sulfur abundance or a sign of stellar activity. In the latter case, H2S would be enhanced due to UV irradiation of dust grains by young massive stars or due to shocks (e.g., Codella et al. codella05 (2005); Jiménez-Serra et al. jimenez05 (2005)).
Our detection of highly excited ammonia demonstrates that the dark cloud scenario does not hold and that there must be some kind of activity enhancing kinetic temperatures to high values. In view of a considerable distance to the center of the absorbing galaxy (4 kpc, see Sect. 1), the high temperatures may either be triggered by the radiation of newly formed massive stars or by large-scale shocks (see, e.g., Flower et al. flower95 (1995) and Rizzo et al. rizzo01 (2001) for NH3 in a shocked environment). This may explain the high H2S abundance reported by Muller et al. (muller06 (2006)). A high kinetic temperature also reduces isotope fractionation so that the non-detection of deuterated species (Shah et al. shah99 (1999)) is no surprise.
4.2 Kinetic temperatures
The concave shape of the line connecting points in the Boltzmann diagram (Fig. 2) indicates rising rotation temperatures with increasing excitation above the ground state. This is similar to results from Galactic sources (e.g., Wilson et al. wilson93 (1993, 2006)) and was originally interpreted to indicate a gradient in , possibly suggesting the presence of dense post-shock gas that is gradually cooling with increasing distance from the shock front. We note, however, that in a warm environment radiative transfer calculations predict higher values for higher metastable levels, gradually approaching , even if the gas is characterized by a single kinetic temperature (Walmsley & Ungerechts walmsley83 (1983); Danby et al. danby88 (1988); Flower et al. flower95 (1995)). only provides lower limits to . A major source of uncertainty in the interpretation of Fig. 2 is caused by the fact that collision rates (Danby et al. danby88 (1988)) were only computed for levels up to (,)=(6,6) and temperatures 300 K. For higher transitions and temperatures, rate coefficients have to be extrapolated.
Such an extrapolation, even including vibrationally excited states, was carried out by Schilke (schilke89 (1989)). Adopting his results, assuming optically thin lines (a realistic assumption, see Sect. 3), and ignoring any infrared radiation field, a kinetic temperature of 80 K reproduces well the measured (,) = (1,1), (2,2), and (4,4) rotation temperatures. However, the (,) (4,4) transitions are far too strong and require much higher excitation. To summarize, 80–90% of the observed NH3 column originates in gas with 80 K. In addition to this dominant component, there is warmer gas, which is characterized by kinetic temperatures well in excess of 100 K. This hot component dominates the (,) (4,4) metastable lines.
4.3 The ammonia column density
At the end of Sect. 3, we derived NH3 column densities for the observed metastable inversion doublets. While metastable doublets beyond (,) = (10,10) should not play an important role, we have not yet estimated the continuum source covering factor, and have also ignored contributions from the (,) = (0,0) ground state and from the non-metatastable levels ().
The absorbed south-western continuum source of PKS 1830–211 (see Sect. 1) contributes to 40% of the total radio flux density (e.g., Nair et al. nair93 (1993); van Ommen et al. ommen95 (1995)). According to Frye et al. (frye97 (1997)), its molecular cloud coverage is 70%. This indicates a total source covering factor of order 0.3, which should be taken with some scepticism because the coverage was determined at 94 GHz and not at 12–15 GHz. At frequencies approximately equal to those of the ammonia lines reported here, Menten et al. (menten99 (1999)) find a source size 2.5 mas for HC3N absorption. This appears to be similar to the size of the continuum source (e.g., Garrett et al. garrett97 (1997)) and also suggests that the molecular coverage of the south-western continuum source alone is not far below unity.
To estimate the population of the (,) = (0,0) ground state, we should keep in mind that if ammonia is synthesized and equilibrated at high-temperatures (40 K), the ortho-to-para abundance ratio should be close to one. If, however, this temperature is lower, the ratio should be larger because the lowest state, (,) = (0,0), belongs to the ortho-species (for the extreme case of 5 K, this would yield an ortho-to-para abundance ratio in excess of 10). Since one half of the levels in the =0 ladder are missing, the (0,0) level does not form a doublet. For an ortho-to-para ratio of unity and accounting for the measured inversion lines, a rotation temperature of 30 K is required between the (0,0) and (3,3) states. This is consistent with 35 K from the (1,1) and (2,2) inversion doublets, which are located at intermediate energies above the ground state, and we obtain (NH3)/ 3.51013 cm-2/K 1014 cm-2/K.
To populate the non-metastable () levels, either high spatial densities or strong radiation fields are needed (e.g., Mauersberger et al. mauers85 (1985)). Toward PKS 1830–211, however, densities must be low because excitation temperatures of molecular mm-wave transitions are close to the temperature of the cosmic microwave background at =0.886, = 5.15 K (see Sect. 4.4). Radiative excitation of the rotational transitions of ammonia ( = 1, = 0) at far infrared wavelengths (50–200m; see Ceccarelli et al. ceccarelli02 (2002)) is also not a viable option. It would require a cloud with high column density ((H2) 1023 cm-2) that is embedded in warm dust ( 100 K) to avoid geometrical dilution and a weakening of the radiation field due to insufficient optical depths. In the Galaxy, such regions containing large column densities of warm dust are always associated with dense ((H2)104 cm-2) molecular gas. However, we do not see such a gas component toward PKS 1830–211. In view of these arguments, (NH3)/ = 1014 cm-2/K is the most likely value because it is based on an ortho-to-para abundance ratio of one, neglecting potentially small contributions from the non-metastable levels. In view of the poorly constrained source covering factor, density, and ortho-to-para ratio of the cloud, we cannot assign an uncertainty to this (NH3)/ estimate.
4.4 Chemical considerations
In Table 1 of Menten et al. (menten99 (1999)) and Table 8 of Muller et al. (muller06 (2006)), column densities of various molecular species are listed. With (CO) = 31018 cm-2 and (H2)/(CO) = 104 (for the latter, see, e.g., Mathur & Nair mathur97 (1997); Wiklind & Combes wc99 (1999); Bradford et al. bradford05 (2005)), the fractional abundance of NH3 becomes (NH3) 310-9 /K. For comparison, in nearby cold dark clouds the ammonia abundance relative to H2 is (NH3) = 10-7.0…-7.5 (e.g., Benson & Myers benson83 (1983); Hotzel et al. hotzel04 (2004)). In hot cores, that is in regions with significant dust-grain evaporation, abundances can be as high as (NH3) = 10-5…-6 (e.g., Henkel et al. henkel87 (1987)).
To reach the range of abundances observed in Galactic cloud cores, must be 10 K for ammonia inversion lines toward PKS 1830-211. Using a Large Velocity Gradient code with collision rates of Danby et al. (danby88 (1988)), = 80 K and optically thin lines, such a value is obained at a density of (H 104 cm-3. This is much higher than the density obtained by Jethava et al. (jethava07 (2007)), (H2)103 cm-3 (most likely 200 cm-3) toward B0218+357, but is still consistent with the upper limits derived using observations of the rotational lines of linear molecules toward PKS 1830–211. An excitation temperature of 15 K from CO =4–3 and 5–4 (Gerin et al. gerin97 (1997)) yields (H2) 3103 cm-3. However, CO with its small dipole moment and its high abundance, providing particularly effective shielding against incoming radiation, may not trace the gas component seen by NH3. More relevant are upper limits of 6 K from high density tracers like CS, HCN, and HCO+ (Wiklind & Combes 1996b ; Gerin et al. gerin97 (1997); Combes & Wiklind cw99 (1999); Muller et al. muller06 (2006)), that require (H2) 104 cm-3. This limits (NH3) to values 10 K, while the microwave background at = 0.886 provides a firm lower limit of 5 K. With (NH3) = 5–10 K, the NH3 column density and fractional abundance become (NH3) (5–10)1014 cm-2 and (NH3) (1.5–3.0)10-8 toward PKS 1830-211. (NH3) is close to the lower limit of what has been obtained from Galactic cloud cores.
The apparent low fractional abundance of ammonia may be caused (1) by stellar nucleosynthesis, (2) by a diffuse medium of low density or (3) by differences in the morphology of the radio continuum background at cm- and mm-wavelengths. In the following, these possibilities are discussed.
(1) Ammonia is a nitrogen-bearing molecule. 14N is a mostly “secondary” nucleus that should be underabundant relative to carbon and even more so relative to oxygen in “chemically” rather unprocessed spiral galaxies in the distant past (see Wheeler et al. wheeler89 (1989) for a review on metallicity dependent CNO abundances). A small metallicity also reduces the dust-to-gas mass ratio so that shielding by dust grains becomes less effective. Since NH3 is a molecule which is particularly sensitive to photodissociation (e.g., Weiß et al. weiss01 (2001)), this could deplete ammonia below values commonly found in local molecular clouds.
(2) In Galactic diffuse clouds seen in absorption toward background continuum sources, Liszt et al. (liszt06 (2006)) find that the NH3 column density is well correlated only with those of CS and H2CO. NH3/CS and NH3/H2CO abundance ratios are approximately 1.0 and 0.4. For PKS 1830-211, we obtain, using the column densities of Menten et al. (menten99 (1999)), ratios of 1.0–2.0 and 1.3–2.6. This is approximately consistent, accounting for uncertainties, the small number of studied Galactic clouds, and their scatter with respect to relative abundances. Adopting, as for PKS 1830–211, a ratio (H2)/(CO) 104, the ammonia abundances for Galactic diffuse clouds seen in absorption become (NH3)/(H2) (1–7)10-8 (Liszt & Lucas liszt98 (1998); Liszt et al. liszt06 (2006)), again in reasonable agreement with our result for PKS 1830–211.
(3) The third explanation requires that the size of the continuum background source be larger at cm- than at mm-wavelengths. In the case of B0218+357, this affects the molecular column densities averaged over the continuum source so that optical depths of ammonia and formaldehyde from lines at low frequencies (30 GHz) have to be corrected upwards when being compared with lines observed in the 1–3 mm wavelength range (Henkel et al. henkel05 (2005); Jethava et al. jethava07 (2007)). It is possible that such a behavior also affects the opacities measured toward PKS1830-211.
While the relative importance of the three scenarios explaining a low NH3 abundance cannot be evaluated, we note that the NH3 abundance is not enhanced by grain mantle evaporation, which is common in dense and warm Galactic hot cores and which was suggested by Muller et al. (muller06 (2006)) for H2S toward PKS 1830-211.
If we adopt an Hi spin temperature of 80 K, valid for the bulk of the ammonia absorption (Sect. 4.2), the total background continuum averaged Hi column density would be 1.61021 cm-2 (see Koopmans & de Bruyn koopmans05 (2005)). In this case, the line-of-sight is predominantly molecular toward the south-western continuum hotspot of PKS 1830-211. If we take 600 K, however, Hi and H2 column densities would be similar.
4.5 An analog in the local Universe
In the nearby Universe, there is only one known cloud that shows a series of metastable NH3 absorption lines similar to that seen toward PKS1830–211. It is observed along the line-of-sight toward the prominent star forming-region Sgr B2 close to the center of the Galaxy (Wilson et al. wilson82 (1982); Hüttemeister et al. huette93 (1993), huette95 (1995); Ceccarelli et al. ceccarelli02 (2002)). Wilson et al. (wilson06 (2006)) even detected the (,) = (18,18) transition, 3130 K above the ground state, toward Sgr B2 (M) and likely also toward Sgr B2 (N). Radial velocity and excitation clearly indicate that the absorbing component is not a foreground object from the Galactic disk but is associated with Sgr B2 itself.
Two scenarios were proposed to explain the warm (up to 1000 K) molecular gas seen in absorption toward Sgr B2. These imply either subthermally excited gas of low density from the extended envelope, known to surround the star-forming region, or thermalized dense gas from compact molecular hot spots in the immediate vicinity of the numerous Hii regions of Sgr B2. The low density of the gas found toward PKS 1830-211 suggests by analogy that the Sgr B2 gas component is also diffuse.
Wilson et al. (wilson06 (2006)) argued that the warm, extended molecular envelope of low density, surrounding Sgr B2 and being seen in ammonia absorption up to at least the (,) = (7,7) doublet, may be caused by the peculiar physical conditions close to the Galactic center. A large stellar density as well as a high probability of cloud-cloud collisions may provide sufficient molecular debris to create such an environment with higher likelihood than in Galactic disks. In view of this it is noteworthy that, in the =0.9 lensing galaxy of PKS 1830–211, we have found a region with similar properties (but apparently lacking a dense molecular core) at a galactocentric radius of 4 kpc.
5 Conclusions and outlook
Our ammonia observations of the gravitational lens system PKS 1830–211 at a redshift of 0.9 reveal the following main results:
-
•
Ammonia (NH3) is detected in absorption in its ten lowest metatstable inversion lines. The (,) = (10,10) transition lies 1030 K above the ground state.
-
•
The NH3 absorption lines are optically thin and reach, in the strongest line, only 2.5% of the continuum level. No ammonia absorption is detected toward the system displaced by –147 km s-1 relative to the main component.
-
•
The absorbing gas is warm: 80-90% of the absorption arises from an environment with 80 K. The remaining gas is with 100 K considerably warmer; for some gas, 600 K. The total column density is approximately (NH3) = (5–10)1014 cm-2.
-
•
Compared with H2 column densities derived from CO at mm-wavelengths, the fractional abundance is (NH3) 1.5–3.010-8. This is a low value when compared with abundances in Galactic cloud cores. The low value may be caused by a low metallicity implying small abundances of nitrogen and dust (NH3 is easily destroyed by UV-photons), by diffuse gas that also shows low NH3 abundances along Galactic lines-of-sight or it may reflect differences between the continuum background morphology at cm- and mm-wavelengths.
-
•
If the Hi spin temperature is equal to the kinetic temperature of the bulk of the NH3 absorbing gas (80 K), the total column must be mostly molecular. If, however, most of the Hi is associated with the hot ammonia component, the Hi and molecular column densities should be similar.
-
•
In the nearby Universe, only the envelope of Sgr B2 has a cloud component with ammonia properties similar to those seen toward PKS 1830–211. This cloud contains gas from either hot cores or from low-density gas forming an envelope; the analogy with PKS1830–211 suggests the latter. The column toward PKS 1830–211 is unique in the sense that it arises from a spiral arm and not from the central region of a gas-rich galaxy.
Following Flambaum & Kozlov (flambaum07 (2007)), a detailed comparison of NH3 inversion lines with rotational spectra from linear molecules can provide limits on the space-time variation of the ratio of the proton to electron mass. Making use of the ammonia profiles presented here, such a comparison will be carried out in a forthcoming paper.
Acknowledgements.
We wish to thank C. M. Walmsley and T.L. Wilson for critically reading the manuscript.References
- (1) Benson, P. J., & Myers, P. C. 1983, ApJ, 270, 589
- (2) Biggs, A. D., Browne, I. W. A., & Wilkinson, P. N. 2001, MNRAS, 323, 995
- (3) Bradford, C. M., Stacey, G. J., Nikola, T., et al. 2005, ApJ, 623, 866
- (4) Ceccarelli, C., Baluteau, J.-P., Walmsley, C. M., et al. 2002, A&A, 383, 603
- (5) Chengalur, J. N., de Bruyn, A. G., & Narasimha, D. 1999, A&A, 343, L79
- (6) Codella, C., Bachiller, R., Benedettini, M., et al. 2005, MNRAS, 361, 244
- (7) Combes, F. & Wiklind, T. 1999, in Highly Redshifted Radio Lines, ed. C. Carilli et al., ASP Conference Series, 156, 210
- (8) Courbin, F., Lidman, C., Frye, B. L., et al. 1998, ApJ, 499, L119
- (9) Courbin, F., Meylan, G., Kneib, J.-P., & Lidman, C. 2002, ApJ, 575, 95
- (10) Danby, G., Flower, D. R., Valiron, P., Schilke, P., & Walmsley, C. M. 1988, MNRAS, 235, 229
- (11) De Rosa, A., Piro, L., Tramacere, A., et al. 2005, A&A, 438, 121
- (12) Flambaum, V. V., & Kozlov, M. G. 2007, Phys. Rev. Let., 98, 240801
- (13) Flower, D. R., Pineau de Forêts, G., & Walmsley, C. M. 1995, A&A, 294, 815
- (14) Frye, B., Welch, W. J., & Broadhurst, T. 1997, ApJ, 478, L25
- (15) Garrett, M. A., Nair, S., Porcas, R. W., & Patnaik, A. R. 1997, Vistas Astron., 41, 281
- (16) Gerin, M., Phillips, T. G., Benford, D. J., et al. 1997, ApJ, 488, L31
- (17) Henkel, C., Wilson, T. L., & Mauersberger, R. 1987, A&A, 182, 137
- (18) Henkel, C., Jethava, N., Kraus, A., et al. 2005, A&A, 440, 893
- (19) Hirota, T., Yamamoto, S., Mikami, H., & Ohishi, M. 1998, ApJ, 503, 717
- (20) Ho, P. T. P., & Townes, C. H. 1983, ARA&A, 21, 239
- (21) Hotzel, S., Harju, J., & Walmsley, C. M. 2004, A&A, 415, 1065
- (22) Hüttemeister, S., Wilson, T. L., Henkel, C., & Mauersberger, R. 1993, A&A, 276, 445
- (23) Hüttemeister, S., Wilson, T. L., Mauersberger, R. et al. 1995, A&A, 294, 667
- (24) Jethava, N., Henkel, C., Menten, K. M., Carilli, C. L., & Reid, M. J. 2007, A&A, 472, 435
- (25) Jiménez-Serra, I., Martín-Pintado, J., Rodríguez-Franco, A., & Martín, S. 2005, ApJ, 627, L121
- (26) Jin, C., Garrett, M. A., Nair, S., et al. 2003, MNRAS, 340, 1309
- (27) Kanekar, N., Carilli, C. L., Langston, G. I. et al. 2005, Phys. Rev. Let., 95, 261301
- (28) Kemball, A. J., Patnaik, A. R., & Porcas, R. W. 2001, ApJ, 562, 649
- (29) Koopmans, L. V. E., & de Bruyn, A. G. 2005, MNRAS, 360, L6
- (30) Liszt, H. S., Lucas, R. 1998, A&A, 339, 561
- (31) Liszt, H. S., Lucas, R., & Pety, J. 2006, A&A. 448, 253
- (32) Lovell, J. E. J., Reynolds, J. E., Jauncey, D. L. et al. 1996, ApJ, 472, L5
- (33) Lovell, J. E. J., Jauncey, D. L., Reynolds, J. E., et al. 1998, ApJ, 508, L51
- (34) Mathur, S., & Nair, S. 1997, ApJ, 484, 140
- (35) Mauersberger, R., Wilson, T. L., Batrla, W., Walmsley, C. M., & Henkel, C., 1985, A&A, 146, 168
- (36) Menten, K. M., & Reid, M. J. 1996, ApJ, 465, L99
- (37) Menten, K. M., Carilli, C., & Reid, M. J. 1999, in Highly Redshifted Radio Lines, ed. C. Carilli et al., ASP Conference Series, 156, 218
- (38) Meylan, G., Courbin, F., Lidman, C., Kneib, J.-P., & Tacconi-Garman, L. E. 2005, A&A, 438, L37
- (39) Muller, S., Guélin, M., Dumke, M., Lucas, R., & Combes, F. 2006, A&A, 458, 417
- (40) Muller, S., Guélin, M., Combes, F., & Wiklind, T. 2007, A&A 468, L53
- (41) Nair, S., Narasimha, D., & Rao, A. P. 1993, ApJ, 407, 46
- (42) Rizzo, J. R., Martín-Pintado, J., & Henkel, C. 2001, ApJ, 553, L181
- (43) Rohlfs, K., & Wilson, T. L. 2003, in Tools of Radio Astronomy, 4th edition (Springer-Verlag, Heidelberg)
- (44) Shah, R. Y., Wootten, A., Mangum, J. G., Carilli, C., L., & Menten, K. M. 1999, in Highly Redshifted Radio Lines, ed. C. Carilli et al., ASP Conference Series, 156, 233
- (45) Spergel, D. N., Bean, R., & Doré, O., et al. 2007, ApJS, 170, 377
- (46) Schilke, P. 1989, Diploma Thesis, Univ. of Bonn
- (47) Swift, J. J., Welch, W. J., & Frye, B. L. 2001, ApJ, 249, L29
- (48) Van Ommen, T. D., Jones, D. L., Preston, R. A., & Jauncey, D. L. 1995, ApJ 444, 561
- (49) Walmsley, C. M., & Ungerechts, H. 1983, A&A, 122, 164
- (50) Weiß, A., Neininger, N., Henkel, C., Stutzki, J., & Klein, U. 2001, ApJ, 554, L143
- (51) Wheeler, J. C., Sneden, C., & Truran, J. W. 1989, ARA&A, 27, 279
- (52) Wiklind, T., & Combes, F. 1994, A&A, 286, L9
- (53) Wiklind, T., & Combes, F. 1995, A&A, 299, 382
- (54) Wiklind, T., & Combes, F. 1996a, A&A, 315, 86
- (55) Wiklind, T., & Combes, F. 1996b, Nature, 379, 139
- (56) Wiklind, T., & Combes, F. 1998, ApJ, 500, 129
- (57) Wiklind, T., & Combes, F. 1999, in Highly Redshifted Radio Lines, ed. C. Carilli et al., ASP Conference Series, 156, 202
- (58) Wilson, T. L., Ruf, K., & Walmsley, C. M. 1982, A&A, 115, 185
- (59) Wilson, T. L., Henkel, C., Hüttemeister, S., et al. 1993, A&A, 276, L29
- (60) Wilson, T. L., Henkel, C., & Hüttemeister, S. 2006, A&A, 460, 533
- (61) Winn, J. N., Kochanek, C. S., McLeod, B. A., et al. 2002, ApJ, 575, 103
- (62) Wucknitz, O., Biggs, A. D., & Browne, I. W. A. 2004, MNRAS, 349, 14
- (63) York, T., Jackson, N., Browne, I. W. A., Wucknitz, O., & Skelton, J. E. 2005, MNRAS, 357, 124