All-particle primary energy spectrum in the 3-200 PeV energy range
Abstract
We present all-particle primary cosmic-ray energy spectrum
in the GeV energy range obtained
by a multi-parametric event-by-event evaluation of the primary energy.
The results are obtained on the
basis of an expanded EAS data set detected at mountain level
( g/cm2) by the GAMMA experiment.
The energy evaluation method has been developed using
the EAS simulation with the SIBYLL interaction model taking
into account the response of GAMMA detectors and reconstruction
uncertainties of EAS parameters.
Nearly unbiased () energy estimations regardless of a
primary nuclear mass with an accuracy of about in the
GeV energy range respectively are attained.
An irregularity (‘bump’) in the spectrum is observed at
primary energies of GeV. This bump exceeds a smooth
power-law fit to the data by about 4 standard deviations.
Not rejecting stochastic nature of the bump completely,
we examined the systematic uncertainties of
our methods and conclude that they cannot be responsible for the
observed feature.
keywords:
Cosmic rays, energy spectra, composition, extensive air showersPACS:
96.40.Pq , 96.40.De , 96.40.-z , 98.70.Sa, , , , , ,
1 Introduction
Study of the fine structure in the primary energy spectrum is one
of the
most important tasks in the very high energy cosmic ray experiments
[1].
Commonly accepted values of the all-particle energy spectrum indexes of
and before and after the knee are an average and may not
reflect
the real behavior of the spectrum particularly after the knee.
It is necessary
to pay special attention to the energy region of GeV,
where experimental results have been very limited up to now.
Irregularities of the energy spectrum in this region were observed a
long time ago. They can be seen from energy spectrum obtained more than
20 years ago with AKENO experiment [2] as well as in later
works of
the GAMMA [3] and TUNKA [4] experiments.
At the same time the large statistical errors did not allow to discuss
the reasons of these irregularities.
On the other hand results of
many experiments on the study of EAS charge particle spectra,
the behavior of
the age parameter and muon component characteristics point out that
the primary mass
composition at energies above the knee becomes significantly heavier.
Based on these indications, additional investigations of the fine
structure of
the primary energy spectrum at GeV have an obvious interest.
There are two ways to obtain the primary energy spectra using
detected extensive air showers (EAS).
The first way is a statistical method, which unfolds the primary energy spectra
from the corresponding integral
equation set based on a detected EAS data set and the model of the EAS
development in the atmosphere [5, 6, 7, 8, 9].
The second method is based on an event-by-event evaluation
[2, 10, 11, 12, 13] of the primary energy of
the detected EAS with parameters
using parametric
[2, 10, 11, 13] or non-parametric
[12] energy estimator previously determined
on the basis of shower simulations in the framework of a given model
of EAS development.
Here, applying a new event-by-event parametric energy evaluation
, the all-particle energy spectrum
in the knee region is obtained on the basis of the
data set obtained with the GAMMA EAS array [7, 8, 9, 11] and
a simulated
EAS database obtained using the SIBYLL [14] interaction model.
Preliminary results have been presented in [10, 11].
2 GAMMA experiment
The GAMMA installation [7, 8, 9, 11]
is a ground based array of 33 surface
detection stations and 150 underground muon detectors,
located on the south side of Mount Aragats in Armenia.
The elevation of the GAMMA facility is 3200 m above sea level,
which corresponds to 700 g/cm2 of atmospheric depth. A
diagrammatic layout of the array is shown in Fig. 1.
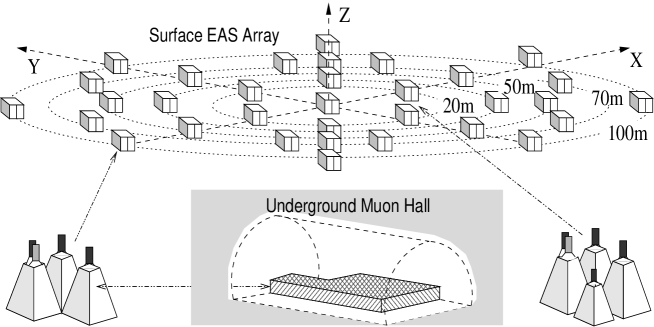
The surface stations of the EAS array are arranged in 5 concentric
circles of 20, 28, 50, 70 and 100 m radii, and each station
contains
3 plastic scintillation detectors with the dimensions
of m3.
Each of the central 9 stations contains an additional (the 4th)
small scintillator
with dimensions of m3 (Fig. 1) for high
particle density ( particles/m2) measurements.
A photomultiplier tube is placed on the top of the aluminum
casing covering each scintillator. One of three detectors of each
station is viewed by two photomultipliers, one of which is designed
for fast timing measurements.
150 underground muon detectors (’muon carpet’) are compactly arranged
in the
underground hall under 2.3 kg/cm2 of concrete and rock.
The scintillator
dimensions, casings and photomultipliers are the same as in the EAS
surface detectors.
The shower size thresholds
of the shower detection efficiency are equal to
and at the EAS core location
within m and m respectively [7, 8, 11].
The time delay is estimated by the pair-delay method
[15] to give the time resolution of about ns.
The EAS detection efficiency () and corresponding
shower parameter reconstruction errors are equal to:
, ,
,
,
and m.
The reconstruction errors of the truncated muon shower sizes
for m from the shower core
are equal to
at respectively [8, 9, 11].
3 Event-by-event energy estimation
3.1 Key assumptions
Suppose that is an estimator of energy of unknown primary nuclei which induced showers with the detected parameter . Then the expected all-particle energy spectrum is defined by
| (1) |
where are the energy spectrum of primary nuclei
and are the corresponding
() transformation probability density function.
If and are the
log-normal distributions with
and
parameters, the expression (1) has the analytic solution
for the expected
spectrum of the energy estimator [16]:
| (2) |
It is seen that evaluation of energy spectrum from (2)
is possible to perform only at a priori known
, and parameters and spectral slope
()
of detected energy spectra coincides with spectral slope
of primary energy spectra .
The values of
and may depend on the primary energy
() and mass of primary nuclei () from which the all-particle
energy spectrum
is consisted of.
In this case, the expression (1) is unfolded numerically
and the slope of detected energy spectrum can differ from primary
energy spectrum.
For example, the dependence
at leads to the numerical solutions which can be
approximated
by the expression (2) replacing
with . The corresponding
approximation errors
is about in the energy range of and
.
However, the evaluation of energy spectra can be simplified
provided
| (3) |
| (4) |
| (5) |
are satisfied for given energy range of . Then, the all-particle energy spectrum can be evaluated from
| (6) |
The corresponding error of evaluation (6) with approaches (3-5) is determined by a sum of the statistical errors and systematic errors due to approaches being used:
where the systematic relative errors is
| (7) |
The values of , and parameters from expressions (3-7) and corresponding uncertainties , and essential for the reconstruction of primary energy spectrum using the GAMMA facility EAS data and approach (6) are considered in Sections 3.2-3.4 below.
3.2 Uncertainty of spectral slope
The results of different experiments [9, 17, 18, 19] and theoretical predictions [20, 21, 22] indicate that the elemental energy spectra can be presented in the power law form
| (8) |
where at
and at .
It is also accepted that the mass spectra of primary nuclei
can be divided into separate nuclear groups and below,
as in [9],
just 4 nuclear species (, , -like and -like)
are considered.
Dependence of the knee energy on the primary nuclei type
assumed to be either rigidity dependent,
[9, 20, 21, 22]
or -dependent [9, 23], , where and
are the charge and mass of primary nuclei correspondingly.
As a result, the all-particle energy spectrum
slowly changes its slope and can be roughly approximated
by a power law spectrum with power index
at GeV,
at GeV and
at GeV.
This presentation of the all-particle spectrum agrees
with world data [23]
in the range of uncertainty and
energy interval GeV.
The values of and parameters
are presented in Section 3.4 and depend on efficiency
of energy estimator .
Notice that it follows from the expression (7)
that for
and
the contribution of in the systematic errors (7)
is negligible and the difference of
all-particle spectra evaluated by expression (6)
for and is less than
at .
3.3 The simulated EAS database
To obtain the parametric representation for unbiased
() energy estimator
of the primary energy we simulated showers database
using the CORSIKA(NKG) EAS simulation code [24]
with the SIBYLL [14] interaction model
for , , and primary nuclei.
Preliminary, the showers simulated with
NKG mode of CORSIKA code for each of the primary nuclei were compared
with the corresponding simulations using EGS mode of CORSIKA
[24]
taking into account the detector response, contribution of EAS
-quanta and shower parameter reconstruction uncertainties.
Simulated statistics were equal to 200 events for each of primary
nuclei with log-uniform primary energy distribution
in the range of GeV.
Using the threshold energy of shower electrons (positrons)
for NKG mode
at observation level as a free parameter (the same as it was
performed in [9]), the biases
and were minimized for all simulated
primary nuclei
().
Applied method of calibration of the NKG mode of CORSIKA
for the GAMMA EAS array differed from
[9] only by the expanded range of selected shower core
coordinates () and zenith angles . The obtained
biases of shower size and age parameter
in the range of statistical errors () agreed with data
[9]. The values of were used further for
correction of the shower size obtained by NKG simulation mode.
The simulated primary energies () for
shower database were distributed according to a power law
spectrum with
total number
of detected (, m) and reconstructed
showers for each primary nucleus.
The energy thresholds of primary nuclei
were set as
GeV and GeV.
The simulated
showers had core coordinates distributed uniformly within the radius
of m and zenith angles .
The reconstruction errors of shower size
are presented in Fig. 2 for different primary nuclei and different
zenith angles.
The right and left ends of diagonals of the rectangular
in Fig. 2 show the average primary energies (in units of GeV)
responsible for corresponding shower
sizes for the primary proton and Iron nuclei respectively.

All EAS muons with energies of GeV at GAMMA observation
level have passed through the
2.3 kg/cm2 of rock to the muon scintillation carpet (the underground
muon hall, Fig. 1).
The muon ionization losses and electron (positron)
accompaniment due to muon electromagnetic and photonuclear
interactions in the rock are taken into account using the
approximation
for equilibrium accompanying charged particles obtained from preliminary
simulations with the FLUKA code [26] in the TeV muon
energy range.
The resulting
charged particle accompaniment per EAS muon in the underground hall
is equal to () and
() at muon energies
TeV and TeV respectively.
Due to absence of saturation in the muon scintillation carpet,
the reconstruction
errors () of truncated muon size
are continuously
decreasing with increasing muon truncated sizes in the range
.
Corresponding magnitudes of reconstruction errors
for primary protons and Iron nuclei were equal to
and
for EAS muon truncated
sizes respectively.
Fluctuations of the shower size for given primary energies
GeV and
were equal to and
respectively.
Corresponding fluctuations of muon truncated size were equal to
and
. For zenith
angles of primary nuclei , the fluctuations are increased
about times due to the aging of detected showers.
The EAS simulated events
with reconstructed , m,
and shower parameters for the and
parameters of primary nuclei made up the simulated EAS database.
3.4 Energy estimator
The event-by-event reconstruction of primary all-particle energy
spectrum using the GAMMA facility is mainly based on high
correlation of primary energy and shower size ().
The shower age parameter ()
zenith angle () and muon truncated shower size
() have to decrease
the unavoidable biases of energy evaluations due to abundance of
different primary nuclei. In Table 1 the
correlation coefficients and
between shower parameters
, , and primary energy ()
and mass of primary nuclei () are presented.
Parametric representation for the energy estimator we obtained by minimizing
| (9) |
with respect to
for different empirical
functions with
a different number () of unknown parameters.
The values of
, and corresponding reconstructed shower parameters
, , and for estimation of
were taken from simulated EAS database (Section 3.3).
The best energy estimations as a result of the
minimization (9) were achieved
for the 7-parametric () fit:
| (10) |
where , ,
, is the shower age and energy is in GeV.
The values of parameters are shown in
Table 2 and were derived at and
, where
the number of degrees of freedom
.
The expected errors of
corresponding parameters were negligibly small ()
due to very high values of .
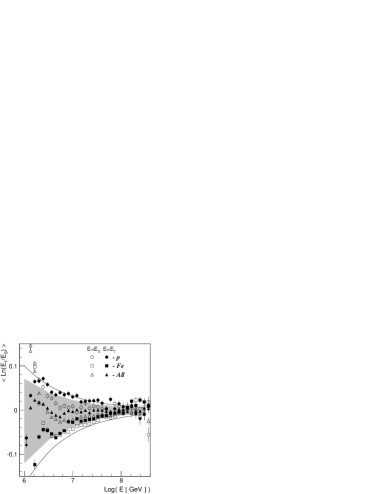
The corresponding average biases versus energies
( and )
for the primary proton (), iron () nucleus and uniformly mixed
composition are presented in Fig. 3 (symbols).
The boundary
lines correspond to approximations
,
where
and for the upper and lower limits
respectively.
The shaded area corresponds to and and were
used to estimate the errors according to (7) for the reconstruction of
all-particle energy spectrum (Section 4).
The dependence of standard deviations
of systematic errors of energy evaluations (10)
on primary energy is presented in Fig. 4 for 4 primary nuclei
and uniformly mixed composition with equal fractions
of p, He, O and Fe nuclei.


The results for the uniformly mixed composition
with the shower core selection of m [10] are presented in
Fig. 4, as well.
It is seen that the value of responsible
for (expression (9))
with uncertainty (expression (5))
encloses the data presented in Fig. 4.
Such high accuracies of the energy evaluation
regardless of primary nuclei is a consequence of the high
mountain location of the GAMMA facility (700 g/cm2),
where the correlation of primary energy with detected EAS size
is about (Table 1).
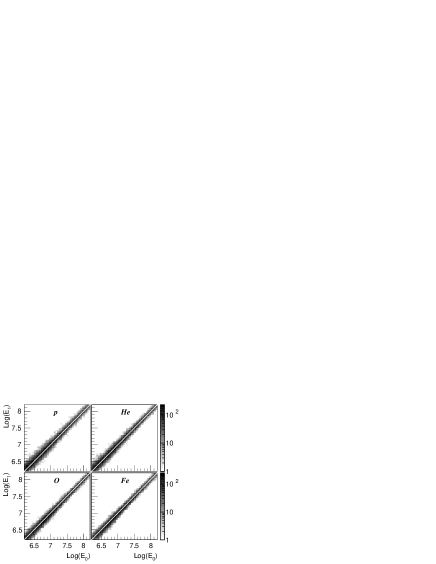
The scatter plot of simulated
primary energy and estimated energy
according to expression (10) and Table 2 are shown in Fig. 5.
The corresponding distributions of energy errors or the kernel
function of integral equation (1)
for different primary nuclei and
uniformly mixed composition are presented in Fig. 6 (symbols).
The average values
and standard deviations
of these distributions depending on energy
of primary nucleus () are presented in Figs. 3,4.
The dashed line is an example
of log-normal distribution
with and parameters corresponding
to the uniformly mixed composition.
It is seen, that the errors can be described by the log-normal
distributions and
the key assumptions (3-5) are approximately valid.
The test of applied approaches (expressions (3-6), Section 3.2) for the reconstruction of all-particle primary energy spectrum was carried out by the direct folding of the power law energy spectrum (expression (8)) with the log-normal kernel function according to expression (1) for primary proton and Iron nucleus. The values of and were derived from the log-parabolic interpolations of corresponding dependencies presented in Figs. 3,4. The event-by-event reconstructed energy spectrum (the left hand side of expression (1)) was obtained from expression (6) using approaches (3-5) with and . The boundary lines of shaded area in Fig. 3 were used as estimations of uncertainties of condition (4). In Fig. 7 the values of are presented (symbols) for primary proton and Iron nuclei and different ”unknown” spectral indices of primary energy spectra (8) with the rigidity dependent knee at GeV. The shades area is the expected errors computed according to expression (7).
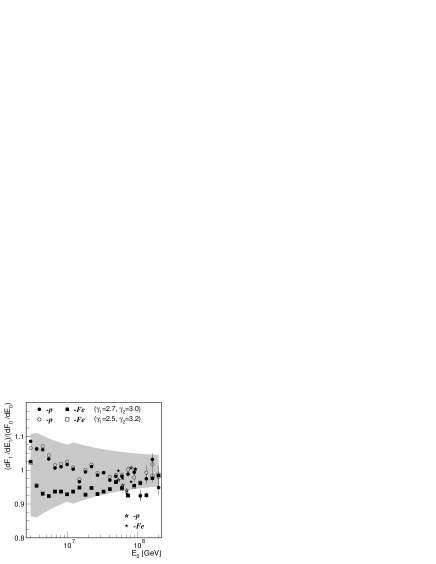
It is seen, that all spectral discrepancies are practically covered by the expected errors according to expression (7). The star symbols in Fig. 7 represent the discrepancies of singular spectra with knee at energy GeV described in Section 5.
4 All-particle primary energy spectrum
The EAS data set analyzed in this paper has been obtained
for sec of live run time of the GAMMA
facility, from 2004 to 2006.
Showers to be analyzed were selected with the following
criteria: , m,
, , and
(where is the number of scintillators
with non-zero signal),
yielding a total data set of selected showers.
The selected measurement range
provided the EAS detection efficiency
and similar conditions for the reconstruction of showers
produced by primary nuclei with energies
GeV.
The upper energy limit is determined from
Fig. 4, where the saturation of surface scintillators in the
shower core region begins to be significant.
The independent test of energy estimates can be done by the
detected zenith angle
distributions which have to be isotropic for different energy
thresholds. In Fig. 8 the corresponding detected distributions
(symbols) are compared with statistically
equivalent simulated isotropic distributions (lines).
The agreement of detected and simulated distributions at
GeV gives an
additional support to the consistency of energy estimates in
the whole measurement range. The anisotropic spectral behavior
at low energies ( GeV) is explained by the lack
of heavy nuclei at larger zenith angles in the detected
flux due to the applied shower selection criteria.

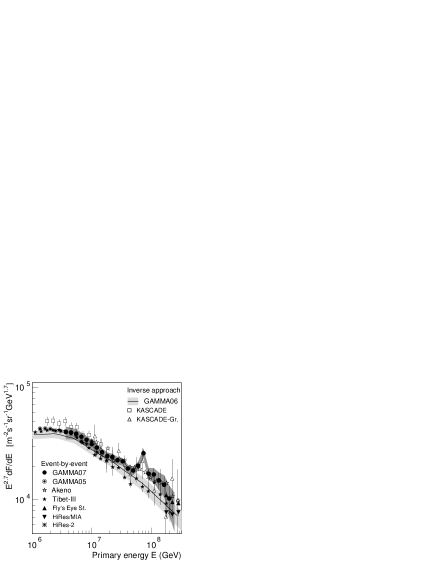
Using the aforementioned unbiased () event-by-event method
of primary energy evaluation (10), we obtained the all-particle energy
spectrum. Results
are presented in Fig. 9 (filled circle symbols, GAMMA07)
in comparison with the same spectra obtained
by the EAS inverse approach (line with shaded area, GAMMA06) from
[6, 9]
and our preliminary results (point-circle symbols, GAMMA05)
obtained using the 7-parametric event-by-event
method with the shower core selection criteria m and
[10].
It follows from our preliminary data [10, 11], that
the all-particle energy spectrum derived by event-by-event analysis
with the
multi-parametric energy
estimator (Section 3) depends only slightly on the interaction
model ( QGSJET01
[25] or SIBYLL2.1 [14] ) and thereby, the errors of
obtained spectra are mainly
determined by the sum of statistical and systematic errors (7) presented
in Fig. 9 by the dark shaded area.
Shower size detection threshold effects distort the all-particle spectrum
in the range
of GeV depending on the interaction model and determine the lower
limit
GeV of the energy spectrum in Fig. 9 whereas the upper limit
of the
spectrum GeV is determined by the saturation
of our shower detectors which begins to be significant at
GeV and
GeV (see Fig. 4) for primary proton and nuclei.
The range of minimal systematic errors and biases is GeV, where
about and errors were attained (Fig. 3,4) for primary
and nuclei respectively.
In Table 3 the numerical values of the obtained all-particle energy
spectrum are
presented along with statistical, total upper and lower
errors according to (7) and corresponding number of detected events.
The energy spectra for low energy region (the first four lines)
were taken from our data [10] for the EAS selection criteria m
and .
| [10] | - | - | |||
| [10] | - | - | |||
| [10] | - | - | |||
| [10] | - | - | |||
The obtained energy spectrum agrees within errors with the KASCADE
[6],
AKENO [2] and Tibet-III [27] data both in
the slope and in the absolute
intensity practically in the whole measurement range.
Looking at the
experimental points we can unambiguously point out at the existence
of an irregularity
in the spectrum at the energy of GeV. As it is seen from
Figs 3 and 4, the energy estimator (10) has minimal biases ()
and errors
() at this energy. With these errors the obtained bump has
an apparently real nature. If we fit all our other points in the
GeV energy range by a smooth power-law spectrum, the bin
at GeV exceeds this smooth spectrum by standard deviations.
The exact value for this significance of the bump depends somewhat on
the energy range chosen to adjust the reference straight line in Fig. 9,
but it lies in the range .
We conservatively included the systematic errors in this estimate,
although they are not independent in the nearby
points but correlated: the possible overestimation of the energy
in one point cannot
be followed by an underestimation in the neighboring point if their
energies are
relatively close to each other. Systematic errors can change slightly
the general slope
of the spectrum but cannot imitate the fine structure and the existence
of the bump.
The results from Fig. 7 show that in the range of ”bump” energy
( GeV) the systematic errors can not increase
significantly the flux.
To test this hypothesis more precisely we tested the reconstruction
procedure for singular energy spectra with power indices
and below and above the knee energy
GeV in the
GeV energy range. Results are presented
in Fig. 7 (star symbols) and show
that there are no significant discrepancies of
reconstructed spectra observed, which stems from high accuracy
of energy reconstruction.
The detected shower sample in the bump energy region
did not reveal any discrepancies with the showers from adjacent energy bins
within statistical errors
neither with respect to reconstructed shower core coordinates, zenith
angular and distributions, nor with respect to
distribution. The only difference is that the average age of showers is
increased from at GeV up to
at GeV, instead of the monotonic shower
age decrease with energy
increment, which is observed at a low energy region
( GeV).
It is necessary to note that some indications of the observed bump
are also seen in KASCADE-Grande [6] (Fig. 9), TUNKA
[4] and Tibet-III [27] data but with
larger statistical uncertainties at the level of 1.5-2 standard deviations.
Moreover, the locations of the bump in different
experiments agree well with each other and with an expected knee energy for
-like primary nuclei according to the rigidity-dependent
knee hypothesis [8, 9]. However, the observed width (%
in energy) and height of the
bump at the energy of GeV, which exceeds
by a factor of
( 4 standard deviations) the best fit
straight line fitting all points above GeV in Fig. 9,
are difficult to
describe
in the framework of the conventional model of cosmic ray origin [21].
As it will be shown below (Section 5, Fig. 10,11)
the detected EAS charged particle () and muon size () spectra
[8, 9]
independently indicate the existence of this bump just for the obtained
energies
and as it follows from the behavior of shower age parameter versus
shower size [8, 9], the bump at energy GeV
is likely formed
completely from nuclei.
5 Possible origin of irregularities
Irregularities of all-particle energy spectrum in the knee region
are observed practically in all measurements [2, 6, 8]
and are explained by both the rigidity-dependent knee hypothesis
and contribution of pulsars in the Galactic cosmic ray flux
[20, 31, 32]. Two these approaches approximately
describe the all-particle spectrum in GeV energy
region.
However, the observed
bump in Fig. 9 at energies GeV both directly points out the
presence
of additional component in the primary nuclei flux and displays
a very flat
() energy spectrum before a cut-off
energy GeV.
It is known [8, 9] that rigidity-dependent primary
energy spectra can not describe quantitatively the phenomenon of ageing
of EAS at energies GeV
that was observed in the most mountain-altitude
experiments [8, 15, 33]. It is reasonable to assume that
an additional flux of heavy
nuclei (-like) is responsible for the bump at these energies. Besides,
the sharpness of the bump (Fig. 9) points out
at the local origin of this flux from compact objects
(pulsars) [31, 32].
The test of this hypothesis we carried out using parameterized
inverse approach
[7, 8, 9] on the basis of GAMMA facility EAS database and
hypothesis of two-component origin of cosmic ray flux:


| (11) |
where and
The first term in the right hand side of expression (11)
(so called Galactic component)
is the power law energy spectra
with rigidity-dependent knees at energies and power indices
and
for and respectively,
and the second term
(so called ”pulsar component”) is an
additional power law energy spectrum with cut-off energies and
power indices and
for and
respectively.
The scale factors
and along with particle rigidity ,
cut-off energy and power indices
were estimated using
combined approximation
method [7, 8, 9] for two examined shower spectra showed in
Figs. 10,11
(empty symbols):
EAS size spectra, (Fig. 10) and EAS muon truncated size
spectra,
(Fig. 11)
detected by the GAMMA facility using shower core selection criteria
and m [8, 9]. We did not consider
the , and pulsar components
to avoid a large number of unknown parameters and corresponding
mutually compensative pseudo solutions [34]
for the Galactic components.
The folded (expected) shower spectra (filled symbols in Figs 10,11) were
computed on the basis
of parametrization (11) and CORSIKA EAS simulated data set [9, 8]
for the and primary nuclei to evaluate
the kernel functions
of corresponding integral equations [8, 9].
The computation method,
was completely the same as was performed in the combined
approximation analysis [8, 9]. The initial values of
spectral parameters for
Galactic component were taken from [9, 8] as well.
In Figs. 10,11 we also presented the derived expected elemental shower
spectra (lines)
for primary and nuclei respectively.
The parameters of two-component primary energy spectra (11) derived from
the goodness-of-fit test
of shower spectra and
are presented in Table 4.
| Param. | G-component | P-component |
|---|---|---|
Resulting expected energy spectra for
the Galactic and nuclei (thin lines)
along with the all-particle spectrum
(bold line with shaded area) are presented in Fig. 12.
The thick dash-dotted line corresponds to derived energy spectra
of the additional component (the second term in the right hand side
of expression (11)). The all-particle
energy spectrum obtained on the basis of the GAMMA EAS data and event-by-event
multi-parametric energy
evaluation method (Section 4, Fig.9) are shown in Fig.12 (symbols) as
well.
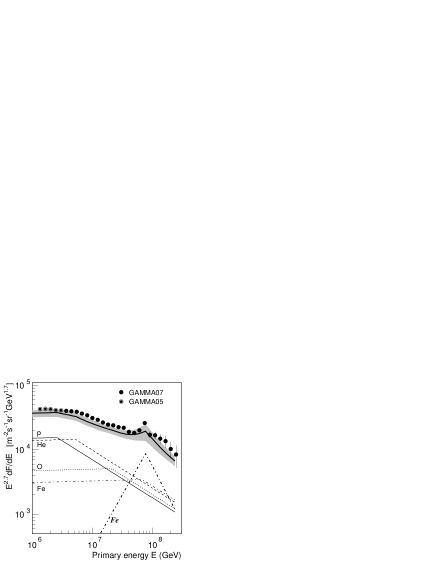
It is seen, that the shape of 2-component all-particle spectrum
(bold line with shaded area)
calculated with parameters taken from the fit of EAS size spectra
agrees within the
errors with the results of event-by-event analysis (symbols)
that points out at the consistency of applied spectral parametrization
(11) with GAMMA data.
Notice that the flux of derived additional component turned out to be
about of the total flux for primary energies GeV.
This result agrees with expected flux of polar cap component
[20].
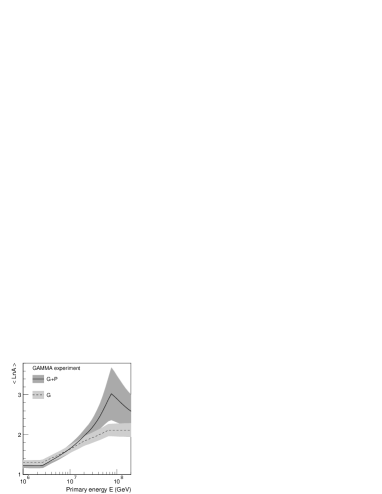
The dependence of average nuclear mass number are presented in Fig. 13 for two primary nuclei flux composition models: one-component model, where the power law energy spectra of primary nuclei have rigidity-dependent knees at particle rigidity GeV/Z [8, 9] (so called Galactic component, dashed line) and two-component model (solid line), where additional pulsar (P) component was included according to parametrization (11) and data from Table 4 with very flat power index () before cut-off energy . The shaded area in Fig. 13 show the ranges of total (systematic and statistical) errors.
6 Conclusion
The multi-parametric event-by-event method (Sections 3,4) provides the
high accuracy for
the energy evaluation of primary cosmic ray nuclei
regardless of the nuclei mass (biases) in the PeV energy region.
Using this method the all-particle energy spectrum in the knee region
and above has
been obtained (Fig. 9, Table 3) using the EAS database from the GAMMA
facility. The results are obtained for the SIBYLL2.1 interaction model.
The all-particle energy spectrum in the range of statistical
and systematic errors agrees with the same spectra obtained
using the EAS inverse approach [7, 6, 8] in the PeV
energy range.
The high accuracy of energy evaluations and small statistical errors point out at the existence of an irregularity (‘bump’) in the
PeV primary energy region.
The bump can be described by 2-component model (parametrization (11)),
of primary cosmic ray origin,
where additional (pulsar) component are included with very flat
power law energy spectrum
() before cut-off energy (Fig. 13,
Table 4).
At the same time, the EAS inverse problem solutions for energy spectra of
pulsar component forces the solutions for the slopes of Galactic component
above the knee to be steeper (Table 4), that creates a problem of
underestimation
of all-particle energy spectrum in the range of HiRes [29] and
Fly’s Eye [28] data at PeV.
From this viewpoint the underestimation () of the
all-particle energy spectrum (bold solid line in Fig. 12) in the range
of PeV
can be compensated by the expected extragalactic component [35].
Though we cannot reject the stochastic nature of the bump completely,
our examination of the systematic uncertainties of the applied method
lets us believe that they cannot be responsible for the observed feature.
The indications from other experiments mentioned in this paper provide
the argument for the further study of this interesting energy region.
Acknowledgments
We are grateful to all our colleagues at the Moscow P.N.Lebedev
Physical Institute and the Yerevan Physics Institute who took part
in the development and exploitation of the GAMMA array. We thank
Peter Biermann for fruitful discussions.
This work has been partly supported by research Grant No. 090
from the Armenian government, by the RFBR grant 07-02-00491 in Russia,
and by the ”Hayastan” All-Armenian Fund and the ECO-NET project 12540UF.
References
- [1] Erlykin A.D., Wolfendale A.W., J. Phys. G: Nucl. Part. Phys., 23 (1997) 979; Astron. and Astrophys. 350 (1999) L1; J. Phys. G: Nucl. Part. Phys. 27 (2001) 1005.
- [2] N. Nagano, T. Hara et al., J. Phys. G: Nucl. Part. Phys. 10 (1984) 1295.
- [3] A.P. Garyaka, R.M. Martirosov, J. Procureur et al., J.Phys. G: Nucl. Phys. 28 (2002) 2317.
- [4] E.E. Korosteleva et al., Nucl. Phys. B ( Proc.Suppl.) 165 (2007) 74.
- [5] T. Antoni et al., Astropart. Phys. 24 (2005) 1, (astro-ph/0505413).
- [6] M. Bruggemann et al., Proc. 20th ECRS, Lisbon (2006), available from http://www.lip.pt/events/2006/ecrs/proc/ercs06-s3–77.pdf.
- [7] S.V. Ter-Antonyan et al., 29th ICRC, Pune, HE1.2 6 (2005) 101, (astro-ph/0506588).
-
[8]
Y.A. Gallant, A.P. Garyaka, L.W. Jones et al.,
Proc. 20th ECRS, Lisbon (2006); available from
http://www.lip.pt/events/2006/ecrs/proc/
ecrs06-s4-21.pdf. - [9] A.P. Garyaka, R.M. Martirosov, S.V. Ter-Antonyan et al., Astropart.Phys. 28/2 (2007) 169 (arXiv:0704.3200v1 [astro-ph]).
- [10] S.V. Ter-Antonyan et al., 29th ICRC, Pune, HE1.2, 6 (2005) 105.
-
[11]
Y.A. Gallant, A.P. Garyaka, L.W. Jones et al.,
Proc. 20th ECRS, Lisbon (2006); available from
http://www.lip.pt/events/2006/ecrs/proc/
ecrs06-s3-95.pdf. - [12] A. Chilingarian, S. Ter-Antonian, A. Vardanyan, Nuclear Physics B, 52B, (1997) 240.
- [13] V. Eganov et al., Int. Journ. of Modern Phys. A, 20/29, (2005) 6811.
- [14] R.S. Fletcher, T.K. Gaisser, P. Lipari, T. Stanev, Phys.Rev. D50 (1994) 5710.
- [15] V.V. Avakian et al., Proc. 24th Intern. Cosmic Ray Conf., Rome, 1 (1995) 348.
- [16] V.S. Murzin, L.I. Sarycheva, Cosmic rays and their interactions, (1968), Atomizd, Moscow ( in Russian ).
- [17] M. Aglietta et al., EAS-TOP Collaboration, Astropart. Phys. 10 (1999) 1.
- [18] M.A.K. Glasmacher et al., Astropart. Phys. 10 (1999) 291.
- [19] M. Amenomori et al., 29th ICRC, Pune, HE12(2005) (29icrc/PAPERS/HE12/jap-katayose-Y-abs2-he12-poster.pdf).
- [20] T. Stanev, P.L. Biermann, T.K. Gaisser, Astron. Astrophys. 274 (1993) 902.
- [21] A.M. Hillas, J. Phys. G: Nucl. Part. Phys. 31 (2005) R95.
- [22] B. Peters, Nuovo Cimento 14 (Suppl.) (1959) 436.
- [23] J.R. Hörandel, Astropart. Phys. 21 (2004) 241.
- [24] D. Heck, J. Knapp, J.N. Capdevielle, G. Schatz, T. Thouw, Forschungszentrum Karlsruhe Report, FZKA 6019 (1998).
- [25] N.N. Kalmykov, S.S. Ostapchenko, Yad. Fiz. 56 (1993) 105 (in Russian).
- [26] A. Fasso, A. Ferrari, S. Roesler et al., hep-ph/0306267 (http://www.fluka.org).
- [27] M. Amenomori, X.J. Bi, D. Chen et al., arXiv:0801.1803 [hep-ex] (2008).
- [28] D.J. Bird et al., Astrophys. J. 441 (1995) 144.
- [29] T. Abu-Zayyad et al., Astrophys. J. 557 (2001) 557.
- [30] R.U. Abbassi et al., astro-ph/0208301 (2002).
- [31] A.D. Erlykin and A.W. Wolfendale, Astropart. Phys., 22/1 (2004) 47 (astro-ph/0404530).
- [32] W. Bednarek, R.J. Protheroe, Astropart.Phys. 16 (2002) 397.
- [33] S. Miyake, N. Ito et al., Proc. 16th ICRC, Kyoto, 13 (1979) 171.
- [34] S.V. Ter-Antonyan, Astropart. Phys. 28, 3 (2007) 321.
- [35] T.K. Gaisser, arXiv: astro-ph/0501195 (2005).