Simulations of the formation of a gaseous disc and young stars near Sgr A* via cloud–cloud collisions
Abstract
Young massive stars in the central parsec of our Galaxy are best explained by star formation within at least one, and possibly two, massive self-gravitating gaseous discs. With help of numerical simulations, we here consider whether the observed population of young stars could have originated from a large angle collision of two massive gaseous clouds at pc from Sgr A∗. In all the simulations performed, the post-collision gas flow forms an inner nearly circular gaseous disc and one or two eccentric outer filaments, consistent with the observations. Furthermore, the radial stellar mass distribution is always very steep, , again consistent with the data. The 3D velocity structure of the stellar distribution is however sensitive to initial conditions (e.g., the impact parameter of the clouds) and gas cooling details. In all the cases the amount of gas accreted by our inner boundary condition is large, enough to allow Sgr A∗to radiate near its Eddington limit during years. This suggests that a refined model would have physically larger clouds (or a cloud and a disc such as the CND) colliding at a distance of a few pc rather than 1 pc as in our simulations.
1 Introduction
The central parsec of our Galaxy is host to young, massive “He-I” stars that can be classified into two stellar discs that orbit the central supermassive black hole, Sgr A∗, outside the inner arcsecond. Most of the stars are located in a well-defined thin stellar disc that rotates clockwise as seen on the sky [Levin03, ; GenzelEtal03, ; PaumardEtal06, ]. The rest of the stars can be classified as a second more diffuse disc that is more eccentric and rotating counter clockwise [GenzelEtal03, ; PaumardEtal06, ] although the statistical significance of this feature is disputed by LuEtal06 . The stellar populations are relatively co-eval, formed approximately million years ago [PaumardEtal06, ]. In terms of formation scenarios, the “in-situ” model is currently the one best favoured by the Galactic Centre (GC) community; in this picture, stars form inside a self-gravitating gaseous disc [e.g., Levin03, ; NC05, ; PaumardEtal06, ]. Theorists had expected gaseous massive discs around supermassive black holes to form stars or planets [e.g., Paczynski78, ; Goodman03, ] long before the properties of the young stars in the GC became known. Recently, NayakshinEtal07 have numerically simulated the fragmentation process of a geometrically thin gaseous disc of mass Solar mass for conditions appropriate for our GC (albeit with a rather simple cooling prescription) and found a top-heavy mass function for the stars formed there. AlexanderEtAl08 extended these numerical studies to the fragmentation of eccentric accretion disks.
However, the in-situ model has not so far addressed in detail the origin of the gaseous discs themselves. Similar discs are believed to exist in AGN and quasars, and indeed are invoked as a means of feeding a supermassive black hole’s immense appetite for gaseous fuel [e.g. Frank02, ]. However, Sgr A∗is currently not a member of the AGN club, as its bolometric luminosity is around of its Eddington limit [e.g., Baganoff03a, ], implying a quiescent mode of accretion.
The viscous timescale of a thin, marginally self-gravitating disc around Sgr A∗, given a disc mass of [reasons for this choice of mass see in, e.g., NayakshinEtal06, ] is very long compared with the age of the stellar systems (approx. yrs compared to yrs). In fact, the gaseous discs would have to evolve even faster as the two stellar systems are largely co-eval. The requisite gaseous discs could therefore not have been assembled by viscous transport of angular momentum.
There is also no strong evidence for other similar star formation events in the region within the last years. Therefore, the one-off star formation event appears to be best explained by a one-off deposition of gas within the central parsec. There are several ways in which this could have happened, e.g. a Giant Molecular Cloud (GMC) with a sub-parsec impact parameter (in relation to Sgr A∗) could have self-collided and become partially bound to the central parsec [e.g., NC05, ]. Alternatively, a GMC could have struck the Circumnuclear Disc (CND) located a few pc away from Sgr A∗, and then created gas streams that settled into the central parsec.
In this article we explore such a one-off collision event in a very simple setup. We allow two massive, uniform and spherical clouds on significantly different orbits to collide with each other one parsec away from Sgr A∗, and follow the gas dynamics in some detail. We find that the collision forms streams of gas with varying angular momentum, both in magnitude and direction. Parts of these streams collide and coalesce to form a disc in the inner region. As the gas cools, it becomes self-gravitating, and stars are born. The resulting distribution of stellar orbits is compared with the observational data throughout the article, and particularly in §5. We find that our model is reasonably successful in explaining the population of young He-I stars in the Galactic Centre.
2 Numerical methods
The numerical approach and the code used in this article is the same as in NayakshinEtal07 with only slight modifications. Namely, we employ GADGET-2, a smoothed particle hydrodynamic (SPH)/N-body code. Gas cools according to , where cooling time depends on radius as
| (1) |
where and , the Keplerian angular velocity, where is a dimensionless number. Gas moves in the gravitational potential of Sgr A∗, modelled as a motionless point mass with at the origin of the coordinate system, and a much older relaxed isotropic stellar cusp potential given by the mass profile derived by GenzelEtal03 .
To model star formation, we introduce sink particles when gas density exceeds a “critical density” [see NayakshinEtal07, ]. Accretion of gas onto stars is calculated using the Bondi-Hoyle rate, which is capped at Eddington. Our units are , the mass of Sgr A∗, cm pc, equal to 1” when viewed from the 8 kpc distance to the GC, and , the dynamical time evaluated at , approximately 60 years. We use to signify distance in physical units and the dimensionless throughout the article inter-exchangeably.
3 Initial conditions
Our initial conditions all comprise a collision between two gas clouds at the edge of the inner parsec of the GC. The specific parameters for each run, labelled S1 to S6, can be found in Table 1. Each cloud is spherically symmetric and of uniform density, containing less than 1% of the mass of Sgr A∗. The clouds are mainly composed of molecular hydrogen, using . The initial temperature of the clouds is arbitrarily set to 20K. A more realistic model could have included a turbulent velocity and density field, but for practical purposes we limit ourselves to a smaller set of input parameters for this first study.
We define the primary to be the larger cloud, with a radius of pc and , whilst the secondary has a radius of pc with . The initial positions of the cloud centres are the same for all the simulations, and are and in dimensionless units. The initial density of the clouds is slightly above the tidal shear density at their initial locations.
In all the tests the absolute velocity of cloud 1 is of the order of the Keplerian velocity at that radius (and would be exactly circular in the absence of the cusp, ). Orbits in a cusped potential however are not Keplerian. The initial specific energy and angular momentum of a particle can be used to find the pericenter, , and the apocenter, , of the orbit. The orbit’s eccentricity is then defined via
| (2) |
For any hyperbolic orbits, the is capped at 1. The orbit of cloud 1 is slightly eccentric, with pericentre and apocentre of 25 and 31.5 respectively, and with . The initial orbit trajectory of the second cloud is varied between the tests to cover a small range of possibilities. The parameters for this trajectory in terms of pericentre, apocentre and eccentricity are given in Table 1. The collision itself is highly supersonic.
| ID | (∘) | ||||||||||
|---|---|---|---|---|---|---|---|---|---|---|---|
| S1 | 1 | (0,0.2,0) | (0,-0.11,-0.21) | 25 | 31.5 | 12.8 | 29.5 | 0.12 | 0.39 | 116 | 3.8 |
| S2 | 1 | (0,0.2,0) | (0,-0.21,-0.11) | 25 | 31.5 | 13.2 | 29.1 | 0.12 | 0.38 | 151 | 6.8 |
| S3 | 0.3 | (0,0.2,0) | (0,-0.11,-0.21) | 25 | 31.5 | 12.8 | 29.5 | 0.12 | 0.39 | 116 | 3.8 |
| S4 | 0.3 | (0,0.2,0) | (0,-0.21,-0.11) | 25 | 31.5 | 13.2 | 29.1 | 0.12 | 0.38 | 151 | 6.8 |
| S5 | 1 | (0,0.2,0) | (0.16,-0.11,-0.21) | 25 | 31.5 | 21.8 | 43.1 | 0.12 | 0.33 | 120 | 2.4 |
| S6 | 1 | (0,0.2,0) | (0.16,-0.21,-0.11) | 25 | 31.5 | 21.5 | 43.4 | 0.12 | 0.34 | 147 | 5.3 |
We run tests with cooling parameter and (see equation 1). These values are low enough so that fragmentation would occur if and when regions of the gas became self-gravitating [Gammie01, ; Rice05, ]. Since the faster cooling runs were expected to require on average shorter timesteps the accretion radius for was set to whilst for this was set to .
4 Numerical simulations
We shall now present some of the results of our simulations.
In all of our runs, the clouds undergo an off-centre collision at time
( years). As the cooling time is longer than the
collision time, , the
clouds heat up significantly and hence initially expand due to thermal pressure. This thermal
expansion modifies velocities of the different parts of the clouds by
giving gas thermal velocity “kicks”. The net result is a distribution of gas
velocities that is much broader than we would get if the shock were isothermal.
Gas dynamics
The collision’s product is not self-gravitating (until it has cooled down again) and so is easily sheared by the tidal field of Sgr A∗. The collision and the resulting mixing of the clouds leads to angular momentum cancellation in shocks of some parts of the gas. Regions of gas that acquire smaller angular momentum infall to the respective circularisation radius on the local dynamical time. A small-scale disc around the black hole is thus formed on this timescale. Regions of the clouds that did not directly participate in the collision retain more of their initial angular momentum. These regions are sheared, then cool into filaments of length comparable to the initial sizes of the clouds’ orbits. Parts of these filaments collide with each other or with the inner disc if the pericentres of their orbits are small enough. The inner disc therefore gains mass in an asymmetric manner, possibly resulting in strong warping and a change in its orientation with time.
As the mass of the disc increases, it circularises, cools and undergoes gravitational collapse, with high density gas clumps being formed. Sink particles are introduced inside these clumps and allowed to grow in mass via gas accretion. We therefore see a significant amount of star formation, and in all our simulations, although the precise distributions differ, we always end up with at least two distinct stellar populations; in the disc and in the outer stream(s).
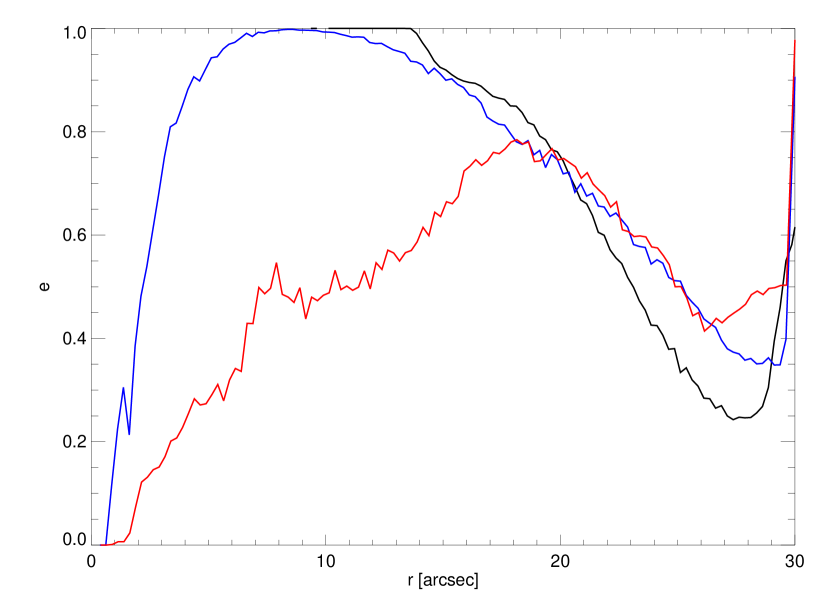
Figure 1 shows the profiles of orbital eccentricity defined
on radial shells plotted for several snapshots. These profiles show that soon
after the collision the inner part of the computational domain is dominated by
gas on plunging – high eccentricity – orbits. At later times, shocks force
the gas to circularise at a few. Gas circularises faster at smaller
radii as the orbital time is shortest there. As time goes on, nearly circular gaseous orbits are established in the innermost
few arcseconds, whereas more eccentric ones dominate at larger radii.
Star formation
Stars in all of our runs form in both the disc and at least one filament. In the disc, stars form first in the inner arcsecond at and later at a radius of - at . In the filament(s), star formation is approximately co-eval with the inner arsecond population and occurs at a radius of -. The disc and filament stellar orbits are inclined to each other by . Mass functions in the disc are top-heavy, whilst the filament(s) form entirely low-mass stars (-). However, as outlined in §2, the mass spectrum of stars formed depends on several poorly constrained parameters of the simulations [e.g., see NayakshinEtal07, ]. Indeed, in the faster cooling runs, the stars in the outer filament(s) form mostly in a clustered mode. We expect that addition of radiative transfer and feedback would supress artificial fragmentation in these clusters and lead to a much more top-heavy mass function of the stars formed in the filament(s).
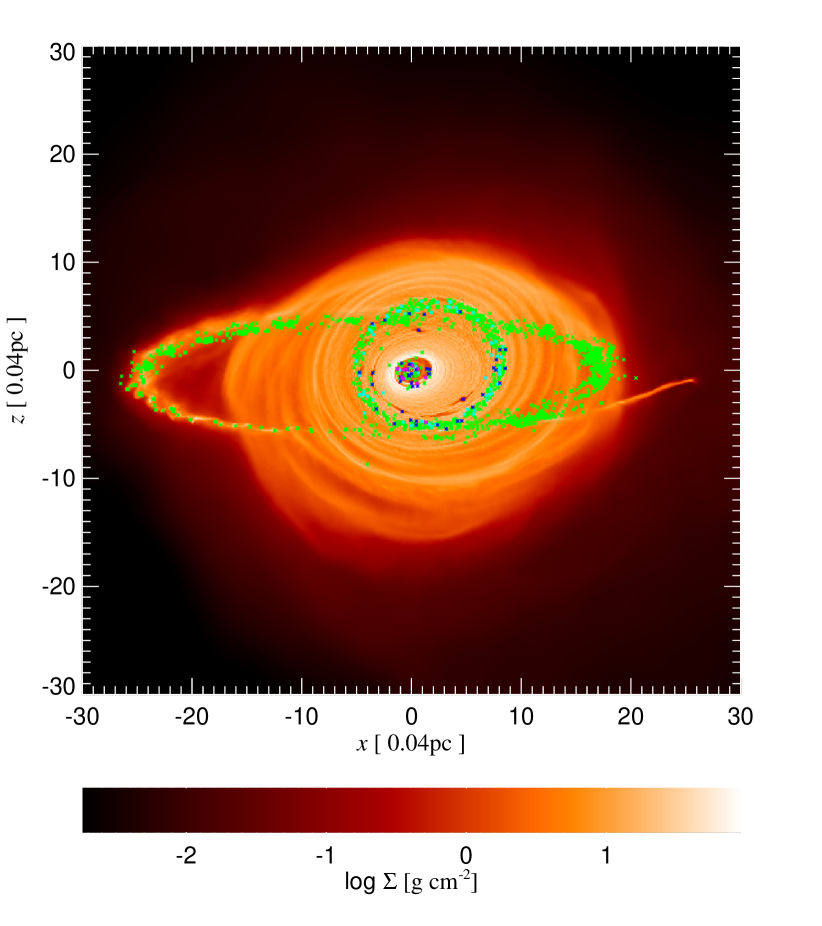
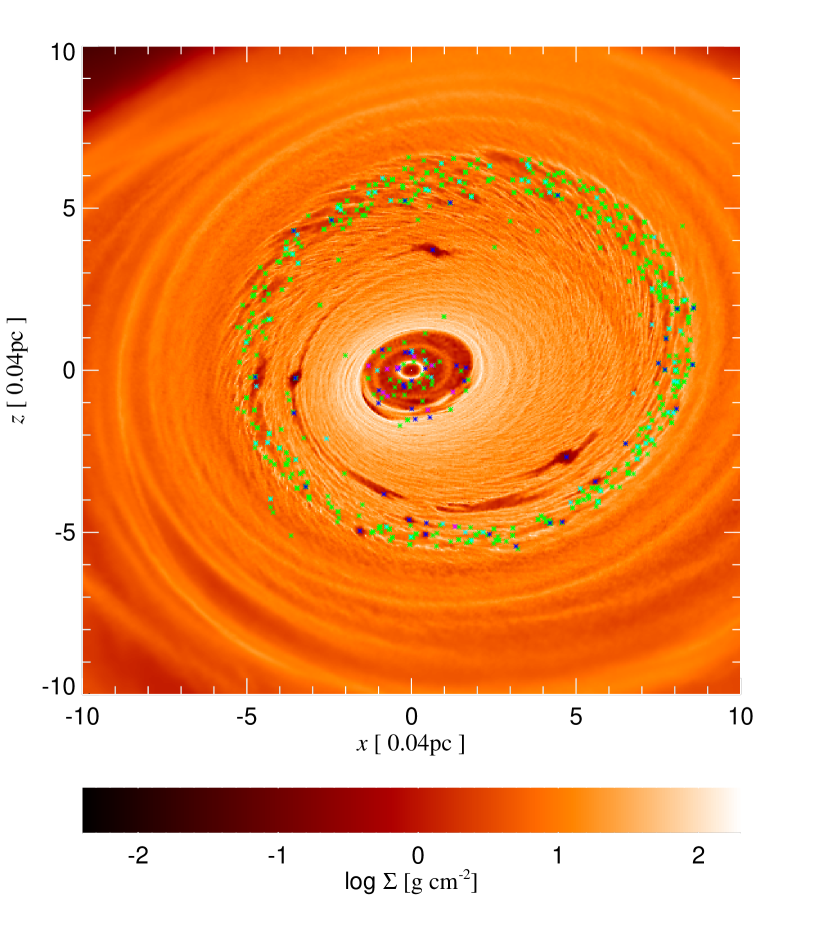
All three stellar populations can be seen in Figure 2. We distinguish the locations at which they form by “inner disc” (within the inner 1-2′′), “mid-range disc” (5-8′′) and “filament” (self-explanatory). The orbits in the inner disc population are almost circular, , whilst the mid-range disc population has an eccentricity of . Both of these are therefore in good agreement with the clockwise feature of the observations LuEtal06 . The orbit of the filament population is also eccentric, with . This is in reasonable agreement with the corresponding counter-clockwise feature of the observations, although the eccentricity of the latter is considered to be significantly higher with PaumardEtal06 .
Infall of gas onto inner disc
When the feeding into the inner 1-2′′ is reasonably steady-state, and cooling is long, stars form here once the gaseous inner disc has settled into a stable orientation. The resulting stellar distribution of is that of a geometrically thin disc (), a distribution that is broadly consistent with the observed orbits of young massive stars in the clockwise disc [PaumardEtal06, ].
In some of our runs, however, the inner disc undergoes a complex
evolution in angular momentum space. When the feeding of the disc due to
infalling gas is intermittent in its distribution of angular momentum e.g.
due to a more grazing initial collision, the newly arriving gas tweaks the disc orientation
significantly. However, if stars are introduced in the disc whilst its
midplane orientation is still changing (as is the case for the
runs), these stars remember the “old” orientation of the gaseous disc in
which they were born whilst the gaseous disc evolves to quite a
different orientation. Possibility of this effect taking place was suggested
based on analytical arguments by NC05 . These authors found a “critical
rotation timescale”, below which the disc will leave the stars behind as its
midplane rotates. Indeed, in one of our tests with fast cooling and a grazing
initial collision, the inner disc rotates on a timescale much shorter than this
critical value, and this coupled with several star forming events in gaseous discs of different
orientations leads to a geometrically thick stellar disc () in the inner arcsecond.
Radial distribution of stars
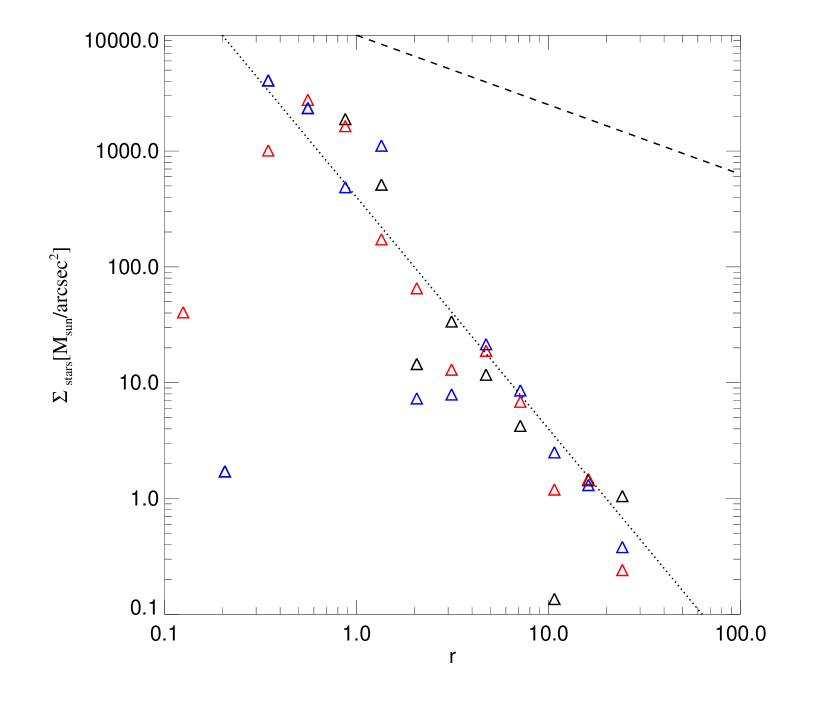
Interestingly, the most robust result from all of the 6 runs completed is the fact that distribution of stellar mass in an annulus, , versus radius roughly follows the law
| (3) |
We show these distributions for run S1 in Figure 3. To
facilitate comparison with observational data, we use projected radius
instead of the proper 3D radius , which is not directly known in
observations of young stars in the GC [e.g., GenzelEtal03, ]. As the
viewing angle of the stellar system modelled here is arbitrary, we chose to
plot the distributions along the three axes of the simulations, so that (black symbols), (red), and (blue). The lines in the
Figure show (dotted) and (dashed) power laws. The latter
corresponds to that predicted by a not self-gravitating standard
accretion disc theory. This result is remarkable given very large differences
in the 3D arrangments of the stellar structures in our runs. The law
is in a good agreement with the observed distribution [PaumardEtal06, ].
Sgr A* feeding during and after the cloud collision
Figure 4 shows the mass accretion rate for the central black hole for simulation S1. Formally, our simulations provide a sustained super-Eddington accretion rate ( yr-1), in some cases for over yrs, and at a fraction of that for up to years. However, we do not resolve gas dynamics inside the accretion radius, where the material should form a disc in which accretion proceeds viscously. The viscous time scale, , depends on the temperature in the disc midplane and the viscosity parameter, [Shakura73, ]. The midplane temperature in the inner arcsecond is around in both the standard [non self-gravitating, e.g., NC05, ] and the self-gravitating regimes [Nayakshin06a, ], yielding : where and is in our code units (one arcsecond). With these fiducial numbers, the viscous time scale coincides with the age of the young massive stars in the GC [e.g., KrabbeEtal95, ; PaumardEtal06, ]. If a few million years (e.g., if , years at 0.3”), we expect that gas would have mainly accreted onto Sgr A∗ by now. This accretion rate would be a significant fraction of the Eddington accretion rate. Standard disc accretion would then generate as much as erg of radiative energy, where is the gas mass accreted by Sgr A∗ in units of . A similar amount of energy could have been released as energetic outflows. There is currently no evidence for such a bright and relatively recent accretion activity of Sgr A∗.
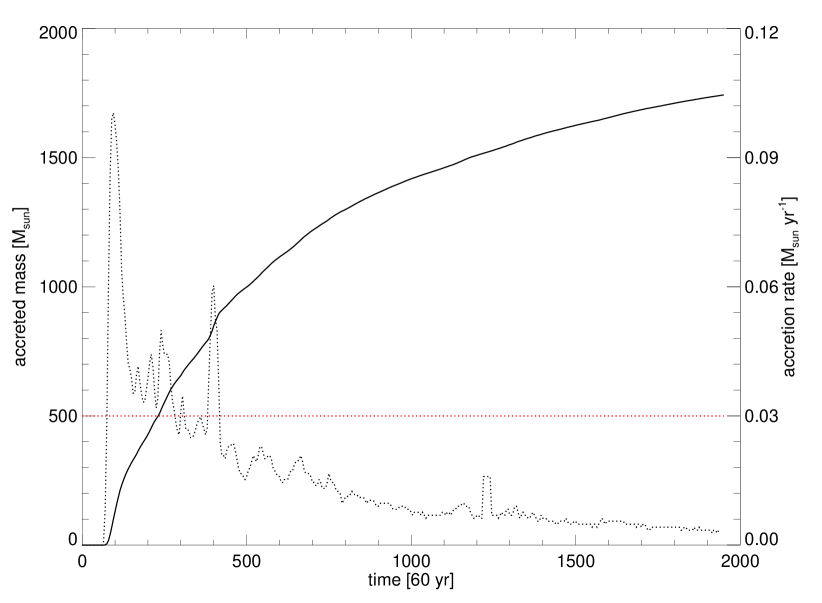
In the opposite limit, i.e. if , and a few million years, the gaseous disc should still be there as self-consistent modelling predicts that stars should not be forming within region [Nayakshin06a, ]. This would contradict the data, as no gaseous disc is observed now [Falcke97, ; Cuadra04, ]. Therefore, our simulations seem to over-predict the amount of gaseous material deposited in the inner . We take this as an indication that a better model would perhaps involve a gaseous cloud of a larger geometric size, thus shifting all spatial scales outwards.
5 Discussion
In approximate order of robustness, our key results are as follows:
-
1.
Formation of a gaseous nearly circular disc in the inner region of the computational domain is common to all runs, as is the ensuing formation of stars on similar circular orbits. This is natural as the dynamical time in the innermost disc is only years. Conversely, the outer gaseous stream becomes self-gravitating much faster than it could circularise, and hence orbits of stars in that region are more eccentric, in reasonable agreement with observations [PaumardEtal06, ].
-
2.
Radial distribution of stellar mass closely follows the observed profile of the disc stellar populations [PaumardEtal06, ]. This was observed for all the runs, although we expect these results to change if colliding clouds moved in similar directions, significantly reducing the angular momentum cancellation in shocks and the thermal “kick” velocity due to the shock.
-
3.
Runs with a comparatively long cooling time parameter, , lead to kinematically less dispersed stellar populations than runs with faster cooling. As a result, the longer the cooling time, the more closely the resulting stellar system can be fit by planar systems in velocity space. The innermost stellar disc is then reminiscent of the observed clockwise thin stellar system PaumardEtal06 . Rapidly cooling runs produce clumpier gas flows that lead to significant gaseous disc orientation changes, producing less coherent discs; such geometrically thick systems are incompatible with the observations.
-
4.
With the chosen initial conditions, faster cooling promotes survival of the gaseous streams corresponding to the orbits of the original clouds. These streams fragment and form stars mainly in a clustered mode, although this is expected to depend on the details of the radiation feedback from young stars, which is not modelled in this set of simulations.
The observed well defined, flat, geometrically thin and almost circular clockwise stellar system [PaumardEtal06, ] is best created via a gentle accumulation of gas. Several independent major gas deposition events lead to a too warped disc, and/or mixed up systems consisting of several stellar rings or discs co-existing at the same radius. To avoid this happening, the inner disc must be created on a timescale longer than the critical rotation time, which is estimated at few years.
Deposition of gas onto the inner disc will most likely take place over the collision time, , where and are the cloud’s size and velocity magnitude. We therefore require that the collision itself be more prolonged than . Estimating the velocity of the cloud at km/sec, which is of the order of circular velocities in the GC outside the inner parsec, we find , where is the size of the cloud in parsecs. We hence require the cloud to be larger than a few parsecs to satisfy . Note that this size is not necessarily the original size of the cloud if the cloud gets tidally disrupted before it makes the impact. In the latter case we can take to be the radial distance to the centre of the Galaxy at which the tidal disruption took place. Finally, the location of the collision should not be too far from the central parsec, or else too much angular momentum would have to be lost to deposit a significant amount of gas in the pc region.
In addition, the radial distribution of gas and stars in our simulations is too compact, contradicting the observations (no He-I stars inside the inner arcsecond and no gaseous disc there either). We thus believe that a realistic scenario would be a GMC of the order of a few parsecs in size striking the CND a few parsecs away from Sgr A∗. Alternatively such a cloud could self-collide if the impact parameter with respect to Sgr A∗ is small enough, but the cloud would need to be very structured, e.g., essentially consist of several smaller clouds or filaments.
References
- [1] Levin Y and Beloborodov A M 2003 ApJ 590 L33–L36
- [2] Genzel R, et al 2003 ApJ 594 812–832
- [3] Paumard T, et al 2006 ApJ 643 1011–1035
- [4] Lu J, Ghez A, Hornstein S, Morris M, Matthews K, Thompson D and Becklin E 2006 JPhCS 54 279–287
- [5] Nayakshin S and Cuadra J 2005 A&A 437 437–445
- [6] Paczyński B 1978 Acta Astron. 28 91–109
- [7] Goodman J 2003 MNRAS 339 937–948
- [8] Nayakshin S, Cuadra J and Springel V 2007 MNRAS 379 21–33
- [9] Alexander R D, Armitage P J and Cuadra J 2008 ArXiv e-prints 807 (Preprint 0807.1731)
- [10] Frank J, King A and Raine D J 2002 Accretion Power in Astrophysics: Third Edition (pp. 398. ISBN 0521620538. Cambridge, UK: Cambridge University Press, February 2002.)
- [11] Baganoff F K, et al 2003 ApJ 591 891–915
- [12] Nayakshin S, Dehnen W, Cuadra J and Genzel R 2006 MNRAS 366 1410–1414
- [13] Gammie C F 2001 ApJ 553 174–183
- [14] Rice W K M, Lodato G and Armitage P J 2005 MNRAS 364 L56–L60
- [15] Shakura N I and Sunyaev R A 1973 A&A 24 337–355
- [16] Nayakshin S 2006 MNRAS 372 143–150
- [17] Krabbe A, et al 1995 ApJ 447 L95
- [18] Falcke H and Melia F 1997 ApJ 479 740–+
- [19] Cuadra J, Nayakshin S and Sunyaev R 2003 A&A 411 405–416