Optical excitations in Sr2CuO3
Abstract
We investigated excitation spectra of the one-dimensional chain compound Sr2CuO3. The small peak at 2.3 eV in the loss function turned out to correspond to the strong charge transfer transition at 1.8 eV in conductivity. It has the excitonic character expected in one dimensional extended Hubbard model of the transition from the lower Hubbard band to the Zhang-Rice singlet state. The strongest peak at 2.7 eV in the loss function is attributed to the continuum excitation of the excitonic charge transfer transition. The spectral weight sum rule is satisfied within these transitions.
pacs:
71.27.+a, 71.35.-y, 78.20.-e, 78.67.-nSuperconducting cuprates have a CuO2 plane in common which is composed of a two dimensional (2D) corner-sharing network of CuO4 plaquettes. The electronic property of an undoped CuO2 plane should be metallic without strong onsite Coulomb repulsion at Cu sites, which divides the Cu state into two Hubbard bands of upper Hubbard band (UHB) and lower Hubbard band (LHB) opening a charge transfer gap between LHB (from a hole point of a view) and O 2 states. Charge doping changes the electronic structure of the CuO2 plane finally giving rise to the high temperature superconductivity. It is important to understand the properties of insulating cuprates to solve the mystery of the high temperature superconductivity.
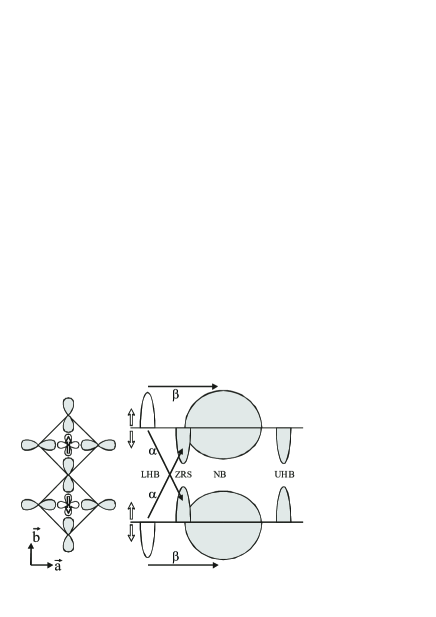
Optical spectroscopy is one of fundamental tools to investigate electronic structure, which can directly measure the charge transfer gap. By absorbing light, holes in LHB can be excited to O 2 states. When a hole is introduced into the CuO2 plane, the ground state becomes a well known Zhang-Rice singlet (ZRS) state evenly residing at surrounding O 2 orbitals.ZR singlet Because an optical excitation is a charge conserving process, to be involved in optical excitations for the ZRS state, one CuO4 plaquette should give a hole to a neighboring CuO4 plaquette, which is possible in corner-sharing CuO4 plaquette structures. Therefore, the first optical excitation crossing the charge transfer gap should be from LHB to the ZRS state in the CuO2 plane as depicted in fig. 1. The second excitation is expected to be from LHB to nonbonding (NB) O 2 states in the CuO2 plane, which is localized within one plaquette. Energies of these two excitations are essential to model the electronic structure of the CuO2 plane.
However, the electronic structure of insulating cuprates remains still unclear. Optical spectra of insulating cuprates of 1D and 2D corner-sharing structure show similar spectral feature of two peaks around 2 eV like the peaks A and B in fig. 2. It is clear that the lowest energy peak, which is rather sharp and has a large spectral weight in common, should be the charge transfer transition from LHB to ZRS. But the origin of the other peak, which comes at about 0.5 eV higher, is still unclear. This peak is relatively broad and the strength varies depending on materials. It is rather small and appear as a hump-like shape in RE2CuO4 (RE: rare earth ions) and Sr2CuO3. Imada ; T-prime 214 Imada et al. attributed this peak to a side band transition with spin excitation via the strong Kondo coupling between the 2 hole and the 3 spin in the final state.Imada On the other hand this peak has a comparable or even larger weight than the first peak in YBa2Cu3O6 and Sr2CuO2Cl2. SCOC-Choi ; YBCO H. S. Choi et al. attributed this peak to the transition from LHB to NB state.SCOC-Choi Therefore further studies are required to reveal the nature of those peaks and to understand the electronic structure of insulating cuprates.
Sr2CuO3 has a corner-sharing CuO4 plaquette 1D chain structure. Its electronic properties along the chain direction should have a common character with the CuO2 plane, while only localized phenomena within one plaquette are expected in the direction perpendicular to the chain. This chain structure provides a unique chance to investigate the electronic structure of CuO4 plaquette networks telling the difference between localized and delocalized excitations in a single material. In addition, the one dimensionality of this material enriches its physics attracting many researchers with interesting phenomena such as the spin-charge separation, a large optical nonlinear effect, and Wannier-like bound excitons.M. Ono-PRB ; Nonlinearity-Nature ; SCO-K. W. Kim ; T. Kidd All these factors make the excitation spectra of this system of great interest.
A. S. Moskvin et al. investigated the electronic structure of Sr2CuO3 along and perpendicular to the chain direction by electron energy loss spectroscopy (EELS). EELS2 Peaks unique along the chain direction are considered to be the ZRS state involved transitions, while structures common in both directions are attributed to transitions localized within one plaquette. Interestingly, the strong charge transfer excitation right above the gap was found to be composed of two peaks. The first small peak above the gap was argued to be a localized excitation within one plaquette. This observation has put more importance on the multi-band model accounting details of orbitals over the simple one band Hubbard model approach. Unfortunately optical experiment along -axis is lacking. It is because this material is cleaved along plane and its strongly reactive nature in air makes polishing for a-axis troublesome. There is only one optical absorption report along -axis measured on a thin film grown with plane utilizing the anisotropic property of a LaSrAlO4 substrate.film-absorption Although EELS experiment has detected an energy loss at 2.0 eV along -axis, no corresponding absorption feature was observed. This discrepancy demands further investigations on this system.
In this paper we report optical spectra along the chain direction of Sr2CuO3 measured by reflectivity measurement. The optical conductivity spectra and the loss function agree with previously reported data. However, we notice that the observed small peak just above the gap in the loss function is not a localized excitation within one CuO4 plaquette but the ZRS state involved charge transfer excitation which appears as a strong peak at 1.8 eV in . This peak is an excitonic peak due to the strong inter-site Coulomb interaction expected in the extended Hubbard model. The strong peak at 2.7 eV in the loss function is also attributed to the excitation from LHB to the ZRS state, which is the continuum excitation of the excitonic peak.
Single crystalline samples were grown using the traveling-solvent floating zone method. Temperature dependent polarized reflectivity spectra were carefully measured over a wide energy range. In a low energy region of 30 to 24000 cm-1 (4 meV to 3 eV) an in situ evaporation technique was adopted in the overfilling method on Bruker 66v /S Fourier transform spectrometer. In 4000-50000 cm-1 (0.5 eV to about 6 eV) Cary5 grating spectrometer was used in the underfilling method. High energy spectra in 6-30 eV were measured at room temperature utilizing synchrotron radiation from the normal incidence monochromater beam line at Pohang Light Source (PLS). All measurements were done on freshly cleaved surfaces. The complex optical conductivity spectra were obtained from Kramers-Kronig transformation of reflectivity .

Figure 2 shows and the loss function along the chain direction of Sr2CuO3. Note that the loss function Im[-1/], which corresponds to EELS spectrum at zone center, can be obtained also from . There are 4 clear peaks respectively marked as A-D and A′-D′. All these peaks were observed in previous studies on and EELS spectra respectively.Imada ; EELS1 ; EELS2 It can be easily noticed that C and D in should correspond to C′ and D′ in the loss function. However coming to A, B and A′, B′ their strengths and energies do not allow a simple conclusion.
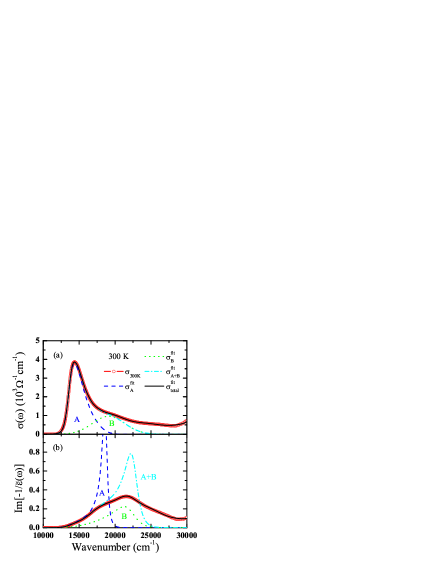
To find a direct relationship between peaks in and the loss function, was fitted with Gaussian functions. Note that the strongly asymmetric line shape of the peak A does not allow Lorentzian with a long tail. Neither it is possible to fit the peak A with a single Gaussian but at least 3 Gaussians are required for a decent fitting. Figure 3(a) shows the fitting result together with an individual peak corresponding to peaks A and B. The complex dielectric function can be decomposed with individual modes as . If all modes are separated far away from each other then the loss function of each mode can be obtained simply with its own dielectric function together with which accounts the contribution by higher energy modes. In a real system, however, some modes are located close to each other such that the loss functions obtained in this way become slightly different from peaks observed in the total loss function. That is, differently from the sum of respective loss functions obtained in this way does not become the total loss function. Figure 3(b) shows corresponding loss functions of peaks A and B obtained as described above. Because two modes A and B are not completely separated, the obtained loss function for each mode is different from the respective peaks in the total loss function. Although their peak heights are much different, however, their peak energies are well reproduced. Note that the loss function of the sum of those two modes obtained in the same way already explains even the peak height quite well for the peak A′. This clearly shows that the peaks A′ and B′ correspond to the peaks A and B.
In this corner-sharing chain structure, the first strong peak A should be the ZRS transition . Note that the strength has to be considered in not in the loss function. Then, how can we understand the observed EELS spectra? In the reported EELS spectra, there is one more excitation at 5.2 eV which is missing in the loss function shown in fig. 2. EELS1 ; EELS2 Note that the peak C′ was observed only with . Although the peak at 5.2 eV is missing in our measurement, the previously reported by Imada et al. also show a small peak there.Imada However, although this peak is common in both spectra along and axes, it is much stronger along axis. This makes it suspicious that the weak feature along axis might come from -axis due to slightly misaligned polarization. Likewise the 2 eV excitation along axis in EELS spectra could come from partially mixed axis.
The low dimensional character of Sr2CuO3 allows a direct comparison of the experiment and a theory. The strongly asymmetric line shape has been understood based on 1D one band extended Hubbard model (EHM) including on site Coulomb repulsion and the nearest neighbor interaction , which has explained many other properties of 1D charge transfer insulators including Sr2CuO3, Ca2CuO3, and Ni-halogen bridged 1D materials.SCO-K. W. Kim ; DDMRG-SCO ; M. Ono-PRB ; EELS1 ; film-absorption However, a close look on of those 1D charge transfer insulators finds another common feature which is not pronounced in 1D EHM. That is, like the peak B in Sr2CuO3, they have a hump structure in the long tail above the excitonic peak. Although it does not appear as a separated peak when , if the excitonic peak becomes a bound exciton (), the theory expects a separated continuum excitation above the excitonic peak. The continuum nature of those peaks was clearly demonstrated in the Ni-Br-Br compound, which forms a bound exciton at low temperature.M. Ono-PRL Note that the continuum excitation in the Ni-Br-Br compound appears as a hump even at high temperature, which is clearly manifested in reflectivity spectra. M. Ono-PRB Therefore the peak B could be attributed to the continuum excitation. That is, if there were no inter-site Coulomb interaction, the peak B would be the only transition from LHB to the ZRS state. However, sizable inter-site Coulomb interaction makes the excitonic peak A take most of the spectral weight, leaving relatively small weight for the continuum excitation B.comment-Maekawa
This assignment of the peak B contrasts to previous assignments in insulating cuprates.Imada ; SCOC-Choi To be assigned as a spin excitation side band or the transition, the peak B has to be either weak or strong, which does not hold true among insulating cuprates. However, if peaks A and B were induced by a strong excitonic effect, the strength variation could be understood by different strength of the excitonic effect. Because the inter-site Coulomb interaction in 1D EHM lies close to the critical boundary of in Sr2CuO3, a small lattice and/or chemical environment change may affect the electronic structure rather strongly.SCO-K. W. Kim Even though the inter-site interaction has been considered as an important parameter in 1D cases, it has seldom been considered in 2D cuprates for the simplicity in theoretical treatments. However, the importance of the excitonic effect in the CuO2 plane has been recognized by a simplified calculation on CuO4 plaquettes clusters. Hanamura et al. elaborated to explain the discrepancy of the strengths of two peaks A and B among cuprates by considering the inter-site interaction between Cu and O. They argued that the A peak is an charge transfer exciton between Cu electron and O 2 hole while the B peak has a continuum character delocalized over a few plaquettes, which is similar to the assignment in the previous paragraph. Hanamura However, they did not consider the ZRS state but treated with the O 2 state at each O site for the O 2 hole. As a result, the excitonic peak A can be obtained even in a single CuO4 plaquette in their calculation, which can not explain the observed anisotropy between and axes of Sr2CuO3 and much larger gaps of edge-sharing chain compounds. Li-212 ; comment-Hanamura Nevertheless their discussion could be qualitatively valid if a single O 2 state could stand for the ZRS state at the neighboring plaquette as Zhang and Ng assumed to explain the dispersion of the excitonic peak A. Zhang-Ng Further theoretical efforts are required to understand the charge transfer excitations and the excitonic effect in various insulating cuprates.
Because both peaks A and B have the ZRS transition character, the next higher energy peaks C and D are expected to be transitions from LHB to NB states. Without spectrum along axis, it is necessary to rely on general features observed in insulating cuprates. To investigate the excitation, an edge sharing chain system such as Li2CuO2 should be ideal, because the transition should be the first pronounced excitation in the edge sharing chain. In Li2CuO2 the first strong peak is observed at about 4.2 eV in .Li-212 Recently J. Málek et al. did detailed calculation for Li2CuO2 on clusters within a 3 band () Hubbard model. ZRT-contribution Interestingly, a single plaquette, of which behavior should correspond to that of the -axis of Sr2CuO3, shows two peaks similar to peaks C and D. The antiferromagnetic background in the corner-sharing chain, which should suppress the Zhang-Rice triplet (ZRT) transition, could make these transitions along the chain direction similar to those of a single plaquette. Note that many 2D insulating cuprates also have a strong peak in this energy range. T-prime 214 ; Imada ; YBCO Therefore peaks C and D are attributed to transitions from LHB to NB states.

J. Málek et al. argued also that the spectral weight of the ZRS excitation at high temperature should decrease due to the thermally excited ZRT transition, which comes around 4 eV, even in antiferromagnetic CuO4 plaquette systems including Sr2CuO3.ZRT-contribution Figure 4(a) shows temperature dependent up to 5 eV and integrated spectral weight. Because was obtained by Kramers-Kronig transformation from , it is difficult to estimate the error. Only in the gap region, where is no absorption, the error could be estimated rather easily. Comparison of the values in the gap region with other reported data suggests a rather small error in our spectra.SCO-K. W. Kim ; Imada ; M. Ono-PRB To examine the spectral weight redistribution, the spectral weight change between 300 K and 10 K normalized by energy is shown in fig. 4(b). Note that the normalized spectral weight will have the error similar to that in because the spectral weight is an integrated value over energy. There is strong temperature dependence in peak A, which has been understood by the electron-phonon coupling.M. Ono-PRB The spectral weight sum rule is satisfied at about 3.5 eV within experimental error. This implies that the ZRT excitation in this material is absent. Its robust antiferromagnetic configuration with the largest exchange energy among cuprates may not allow the ZRT transition which requires finite ferromagnetic interaction. Because it is difficult to separate peaks A and B in a consistent way at all temperatures (note that even the peak A itself requires a few Gaussians for a decent fitting) it would be meaningless to discuss further details on the spectral weight. However, it has been noticed that can be simply scaled by the peak height and width right above the gap.SCO-K. W. Kim Best scaling factors expect decrease of spectral weight at low temperature. But it should be noted that the peak A could be composed of a few peaks due to electron-phonon coupling. el-ph In addition, bound exciton peaks appear at low temperature of which spectral weight is not taken into account in the scaling argument.SCO-K. W. Kim Therefore, it could be stated that spectral weight of the bound excitons may come mainly from a lower part of the peak A. But any further argument is beyond current observations.
In summary, optical conductivity spectra and the loss function of Sr2CuO3 were analyzed in detail. Four excitations below 5 eV were attributed to the ZRS state and NB O 2 states involved excitations respectively. The small peak at 2.3 eV in EELS spectra, which had been believed to be a localized excitation within single CuO4 plaquette, turned out to correspond to the strong excitonic charge transfer excitation at 1.8 eV in . Another ZRS state involved transition was addressed, which appears as the strongest peak at 2.7 eV in the loss function and corresponds to the continuum excitation in 1D EHM. The spectral weight sum rule is satisfied within ZRS involved excitations below 3.5 eV. This finding of the existence of an excitonic peak and its continuum excitation demands reexamination of the electronic structure of 2D cuprates.
Acknowledgements.
This work is supported by the Schweizer Nationalfonds (SNF) with grant 200020- 119784, by the Department of Energy under contract No. DE-AC02-98CH10886. The experiments at PLS was supported by MOST and POSCO.References
- (1) F. C. Zhang and T. M. Rice, Phys. Rev. B 37,3759 (1988).
- (2) Masatoshi Imada, Atsushi Fujimori, and Yoshinori Tokura, Rev. Mod. Phys. 70, 1039 (1998).
- (3) T. Arima, K. Kikuchi, M. Kasuya, S. Loshihara, Y. Tokura, T. Ido, and S. Uchida, Phys. Rev. B 44, 917 (1991).
- (4) S. L. Cooper, D. Reznik, A. Kotz, M. A. Karlow, R. Liu, M. V. Klein, W. C. Lee, J. Giapintzakis, D. M. Ginsberg, B. W. Veal, and A. P. Paulikas, Phys. Rev. B 47, 8233 (1993).
- (5) H. S. Choi, Y. S. Lee, T. W. Noh, E. J. Choi, Yunkyu Bang, and Y. J. Kim, Phys. Rev. B 60, 4646 (1999).
- (6) H. Kishida, H. Matsuzaki, H. Okamoto, T. Manabe, M. Yamashita, Y. Taguchi, and Y. Tokura, Nature, 405, 929 (2000).
- (7) M. Ono, K. Miura, A. Maeda, H. Matsuzaki, H. Kishida, Y. Taguchi, Y. Tokura, M. Yamashita, and H. Okamoto, Phys. Rev. B 70, 085101 (2004).
- (8) T. E. Kidd, T. Valla, P. D. Johnson, K. W. Kim, G. D. Gu, and C. C. Homes, Phys. Rev. B 77, 054503 (2008).
- (9) K. W. Kim, G. D. Gu, C. C. Homes, and T. W. Noh, Phys. Rev. Lett. 101, 177404 (2008).
- (10) A. S. Moskvin, J. Málek, M. Knupfer, R. Neudert, J. Fink, R. Hayn, S.-L. Drechsler, N. Motoyama, H. Eisaki, and S. Uchida, Phys. Rev. Lett. 91, 037001 (2003).
- (11) H. Kishida, M. Ono, K. Miura, H. Okamoto, M. Izumi, T. Manako, M. Kawasaki, Y. Taguchi, Y. Tokura, T. Tohyama, K. Tsutsui, and S. Maekawa, Phys. Rev. Lett. 87, 177401 (2001).
- (12) R. Neudert, M. Knupfer, M. S. Golden, J. Fink, W. Stephan, K. Penc, N. Motoyama, H. Eisaki, and S. Uchida, Phys. Rev. Lett. 81, 657 (1998).
- (13) H. Benthien and E. Jeckelmann, Phys. Rev. B 75, 205128 (2007).
- (14) M. Ono, H. Kishida, and H. Okamoto, Phys. Rev. Lett. 95, 087401 (2005).
- (15) It is worth to note that H. Matsueda et al. interpreted the hump structure (a long tail above the excitonic peak) as another peak based on one dimensional two-band Hubbard model. They claimed that the excitonic peak corresponds to the excitation from the lower Hubbard band (from the hole point of view) to the singlet bound state while the hump structure originates by the excitation from the lower Hubbard band to the unbound state, which correspond to the and excitations respectively. Matsueda-Maekawa However, this scenario can not explain the observed anisotropy between and axes of Sr2CuO3, neither the much larger charge transfer gaps of edge-sharing chain compounds than those of compounds with corner-sharing structures. Li-212
- (16) H. Matsueda, T. Tohyama, and S. Maekawa, Phys. Rev. B 71, 153106 (2005).
- (17) Y. Mizuno, T. Tohyama, S. Maekawa, T. Osafune, N. Motoyama, H. Eisaki, and S. Uchida, Phys. Rev. B, 57, 5326 (1998).
- (18) Eiichi Hanamura, Nguyen Trung Dan, and Yukito Tanabe, Phys. Rev. B 62, 7033 (2000).
- (19) In the excitonic cluster model of Hanamura et al. the eigenenergies of excited states within single CuO4 plaquette are similar to the energy of the peak B.
- (20) F. C. Zhang and K. K. Ng, Phys. Rev. B 58, 13520 (1998).
- (21) J. Málek, S.-L. Drechsler, U. Nitzsche, H. Rosner, and H. Eschrig, Phys. Rev. B 78, 060508(R) (2008).
- (22) H. Matsueda, A. Ando, T. Tohyama, and S. Maekawa, cond-mat/0802.3965v1.