Effect of material stiffness on hardness: a computational study based on model potentials
Abstract
We investigate the dependence of the hardness of materials on their elastic stiffness. This is possible by constructing a series of model potentials of the Morse type; starting on modelling natural Cu, the model potential exhibit an increased elastic modulus, while keeping all other potential parameters (lattice constant, bond energy) unchanged. Using molecular-dynamics simulation, we perform nanoindentation experiments on these model crystals. We find that the crystal hardness scales with the elastic stiffness. Also the load drop, which is experienced when plasticity sets in, increases in proportion to the elastic stiffness, while the yield point, i.e., the indentation at which plasticity sets in, is independent of the elastic stiffness.
pacs:
62.20.-x, 81.40.JjI Introduction
While the elastic properties of solids are well understood, and their description in terms of interatomic potentials is well established, plastic deformation of solids – and the concurrent phenomena of dislocation generation and motion – are more complex and their modelling presents greater difficulties. One reason certainly is that plasticity involves strongly non-equilibrium states in the solid, in which the material is stressed so far that interatomic bonds are broken and new bonds are formed.
The simplest quantitative measure of plasticity is given by the material hardness, i.e., the pressure with which the material withstands plastic deformation. It has long been known that the hardness of a defect-free, ideal crystal, the theoretical strength, is proportional to the material’s shear modulus. This important result, which dates back to Frenkel,Frenkel (1926); Kelly and Macmillan (1987) has been derived by considering the shear stress necessary to induce slip in a perfect lattice; modern ab initio quantum mechanical calculations have confirmed this result.Roundy et al. (1999); Ogata et al. (2002, 2004) However, the question remains how the elastic stiffness of a material influences dislocation generation and the emergence of plasticity in a more complex and realistic situation.
We choose a nanoindentation scenario to investigate the onset of plasticity, and its dependence on the material stiffness. A molecular-dynamics simulation allows to provide atomistic insight into the reaction of a material to an applied load, to calculate the force-depth curve and to extract the contact pressure and the material hardness. It furthermore allows to describe in detail the induced damaged patterns in the form of dislocation loops and stacking faults formed.
Our study is based on the Morse interatomic potential. While it is well known that metals cannot be described in all details by pair potentials,Carlsson (1990) this class of potentials readily allows to generate a series of potentials, which all describe the same material, in which, however, exactly one property is arbitrarily changed. Since the prime aim of our study is to inquire into the generic dependence of plasticity and hardness on the elastic stiffness of the material, rather than to describe one particular material as accurately as possible, our choice of a Morse potential appears appropriate. We note that the Morse potential has been used previously to describe dislocations in metals.Cotterill and Doyama (1966); Vitek (1968, 1988); Huang et al. (1989)
II Method
II.1 Potentials
We use the Morse potential
| (1) |
to model our material. It is characterized by three parameters: the bond strength , the equilibrium bond distance , and the potential fall-off . As is well known,Carlsson (1990); Finnis (2003) the Morse potential cannot describe all characteristics of bonding in metals; however, as discussed elsewhere,Ziegenhain et al. (2008) it can give a reasonable description of the elasticGirifalco and Weizer (1959); Lincoln et al. (1967) and also plastic processes occurring under indentation. We adopted this potential, since it allows to fit in a transparent way the materials properties. Since the Morse potential contains three parameters, it is possible to fit it to three materials properties; these are traditionally chosen as the lattice constant , the cohesive energy , and the bulk modulus .
For example, CuSmithells (1949) with Å, eV, and GPa can be described by a Morse potential with eV, Å, and Å-1. We note that here and in the following, we cut off the potential at Å – i.e. including 248 neighbours – , and shift the potential to zero at this distance.
We create a series of Morse potentials, in which the lattice constant and cohesive energy are kept unchanged, but the bulk modulus is set to a preassigned value. These potentials can hence be considered as describing a series of pseudo-Cu materials with identical bond strength, but changed bulk moduli. Table 1 reproduces the values of the fit parameters obtained for the potentials employed in this study. We use a Levenberg-Marquardt based optimization for parameter fitting; the values of () are reproduced within 0.1 % (1%).
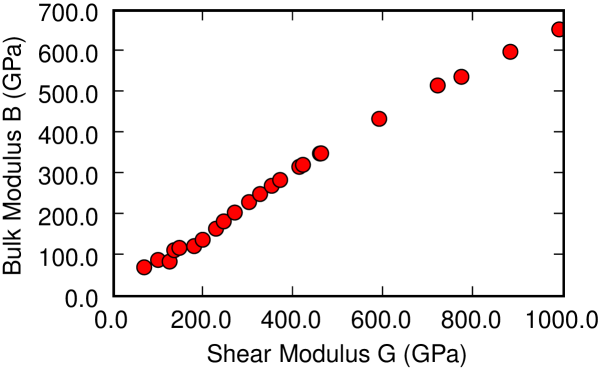
The linear elastic properties of an fcc crystal are given by 3 elastic constants, , , and . However, for a pair potential, it is always = , so that only two elastic constants describe the elastic behaviour. We chose the bulk modulus
| (2) |
and the average shear modulus
| (3) |
to describe the elastic properties. For Cu, it is GPa. Table 1 shows the shear moduli obtained for pseudo-Cu, and Fig. 1 demonstrates that increases quite linearly with ; only for the highest moduli, increases superlinearly with . So in general, we may say that the entire elastic behaviour (the elastic stiffness) of pseudo-Cu changes in correspondence with ; we shall talk of weak and strong materials.
II.2 Generalized stacking fault energy
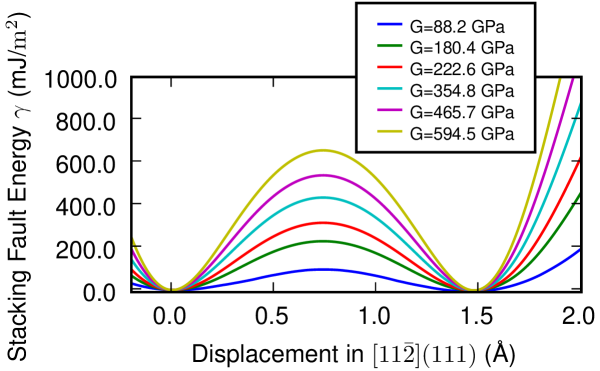
The generalized stacking fault (GSF) energy can be used to characterize the behaviour of a material with respect to formation of stacking faults, and hence dislocation formation and glide.Vitek (1968); Rice (1992); Farkas et al. (1997); Lu et al. (2000) For its definition, we consider an fcc crystal, whose upper part has glided along a (111) plane with respect to its lower part by a definite amount; in the present paper we only consider glide vectors along the [112̄] direction. The GSF energy is the potential energy per surface area of the deformed crystal; when determining this energy, relaxation of the crystal vertical to the (111) plane, but no relaxation or reconstruction within this plane is allowed for.Vitek (1968); Farkas et al. (1997) In our calculation, it proved necessary to choose the crystallite rather large, 10 lattice in lateral directions and 25 lattice constants in both vertical directions; we employed the conjugate-gradient technique to relax the crystal in vertical direction.
Fig. 2 displays the variation of the GSF surface along the [112̄] (111) displacement. The minimum at 0 displacement corresponds to fcc stacking, here by definition. The second minimum is found for a displacement corresponding to a partial Burgers vector Å. It describes a stacking fault with energy . For our potentials, extremely small values were obtained, which varied in the range of mJ/m2. For comparison, the experimental value of for Cu is 45 mJ/m2; Hirth and Lothe (1982); Mishin et al. (2001) this value is retrieved by ab initio calculations.Roundy et al. (1999); Ogata et al. (2002) We note that in previous investigations, a sufficiently large value of the stacking fault energy could only be obtained by adapting the value of the cut-off radius to ;Cotterill and Doyama (1966) for larger , strongly decreased.
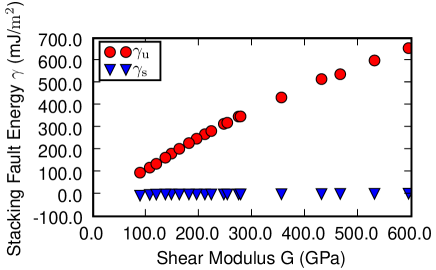
We found that the exact determination of is nontrivial, since large crystallites have to be relaxed; sometimes only a local and not the global energy minimum may have been found. Furthermore, it is known that the stacking fault energy may depend sensitively on the cut-off radius of the potential.Cotterill and Doyama (1966) Hence we conclude that within the Morse pair potential approximation, the stable stacking fault energy of fcc metals (of Cu, at least) is strongly underestimated. It does not – or only negligibly – depend on the elastic stiffness of the material.
The energy barrier between the fcc crystal position and the stable stacking fault is called the unstable stacking fault energy, . It depends strongly on the elastic stiffness. As Fig. 3 shows, it increases roughly linearly with the bulk modulus , and hence also with the shear modulus , cf. Fig. 1. This may be understood since the displacement of two (111) planes in the crystal corresponds to a gliding motion; thus the barrier to gliding, , should be strongly correlated with the shear modulus.
II.3 Indentation
In order to model the plastic deformation of our material, we performed indentation simulations using the a appropriately adapted version of the LAMMPS molecular dynamics code.LAM Our target consists of an fcc crystallite with a (100) surface; it has a depth of 25 nm and a square surface area of 621.2 nm2; it contains 1325598 atoms.
The indenter is modelled as a soft sphere. We chose a non-atomistic representation of the indenter, since we are not interested in the present study in any atomistic displacement processes occurring in the indenter, but only in the substrate. The interaction potential between the indenter and the substrate atoms is characterized by a hard core of radius surrounded by a softly repulsive potentialKelchner et al. (1998)
| (4) |
since we are in this generic study not interested in the complexities introduced by adghesion phenomena. The indenter stiffness was set to eV/Å3. Our indenter has a radius of nm. Indentation proceeds in the so-called velocity-controlled approach, in which the indenter proceeds with a fixed velocity, m/s in our case, into the substrate.
III Results
III.1 Force-displacement curves
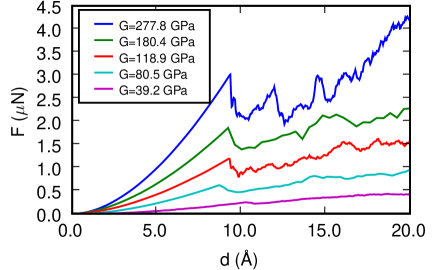
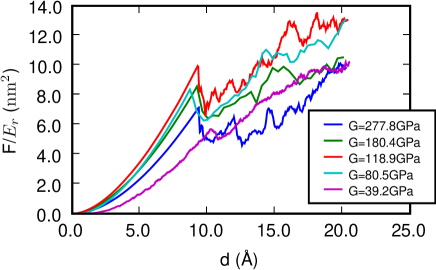
Fig. 4 shows the basic result of the simulation, the force-displacement curves. In all these curves it is seen that the force increases monotonically with the displacement into the substrate until a depth which is of the order of Å and where the force suddenly drops. This corresponds to the onset of plastic deformation inside the material. The first, monotonically increasing part is due to elastic deformation of the substrate. HertzHertz (1882) calculated that for an elastically isotropic solid it holds
| (5) |
In this relation, a single materials parameter, the so-called reduced modulus describes the materials elastic response.Fischer-Cripps (2004, 2007) For a rigid indenter, it may be expressed in terms of the Young’s modulus and the Poisson ratio of the substrate as
| (6) |
Hertz also determined the contact pressure ; it is defined by the ratio of the normal force divided by the contact area projected into the surface plane, . We calculate from the ensemble of contact atoms of the indenter, which are farthest away from the indentation axis, and approximating it as an ellipse.
We test this law in Fig. 4b. To do this, we need to calculate the reduced elastic modulus for a (100) surface. Here, Young’s modulus has to be calculated for deformation in (100) direction, perpendicular to the surface, while the Poisson ratio has to be averaged over all directions perpendicular to the (100) directions. The corresponding formulae are rather complex and are provided in Ref. Turley and Sines, 1971. Fig. 4b shows that in the range of GPa, the elastic behaviour follows quite uniquely the (generalized) Hertz law (5). Only for the extreme cases of and 278 GPa, the normalized forces are too small. We believe that this deviation from the Hertz law is due to (i) a poorer quality of the potential to describe the materials reaction (ii) in particular in the case of the weaker pseudo-Cu, GPa, the softness of the substrate makes the fluctuations in the response of the substrate to the constant-velocity indentation more sizable. We note that when normalizing , an equally satisfactory uniformity of the curves is achieved; we do not show this plot, since the theoretical foundation appears to be missing.
At the yield point the force drops suddenly due to the onset of plasticity; this well-known phenomenon is called the load drop. In our series of simulations we saw that the exact positions of the yield point does not show a monotonic trend with the elastic stiffness of the substrate; rather fluctuates. We believe that in this constant-velocity indentation, the yield point may be subject to fluctuations in the simulation procedure. We therefore conclude that within the limits of the fluctuations the position of the yield point does not depend on the elastic stiffness of the target.
However, the load drop shows a clear increase with the elastic stiffness of the material. This is understandable since the atomistic reason for the load drop is the nucleation of a stacking fault in the material. Its generation requires an energy which scales with the unstable stacking fault energy, , which has to be found to scale well with the elastic stiffness.
III.2 Hardness
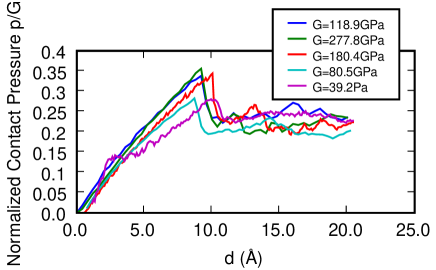
The force divided by the (projected) contact area of the indenter defines the contact pressure . After the onset of plasticity, it gives the hardness of the material. Fig. 5 shows the simulation results for the contact pressure. In view of the good quality of the scaling observed before with the material stiffness, we present our data scaled with the shear modulus . This is also motivated by the consideration that the theoretical shear strength of the material is given by
| (7) |
where is a constant, which depends on the crystal structure of the solid but is otherwise quite material-independent. Frenkel estimated for the important {111} glide system of fcc solids.Kelly and Macmillan (1987) Recent more refined estimates based on density functional theory give a slightly reduced value, .Roundy et al. (1999); Ogata et al. (2002, 2004)
Tabor showed that the hardness measured as the contact pressure during nanoindentation amounts to ,Tabor (1951); Kelly and Macmillan (1987) since the nanoindentation acts as a ‘lens focussing the stress in a small volume beneath the contact point.Li (2007) Using Eq. (7), we hence expect
| (8) |
Fig. 5 shows that after the onset of plasticity, the hardness is indeed proportional to the shear modulus and well described by Eq. (8) with a coefficient of , i.e., , in satisfactory agreement with the estimates of given above.. The figure also appears to indicate that the fluctuations in the fully plastically regime are smaller for soft materials, which appears plausible.
Note that also in the elastic regime, the scaled contact pressure lies on one single curve, again underlying the importance of the shear modulus for the indentation behaviour. The only exception is given by the softest material.
In this case the energy difference between the fcc and the hcp structures is rather small, and we observe instabilities at the relaxed free surface of the crystallite, which are reflected in the hardness curve, Fig. 5.
III.3 Plasticity
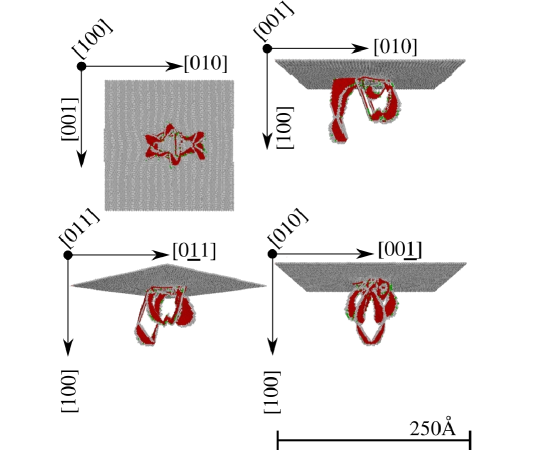
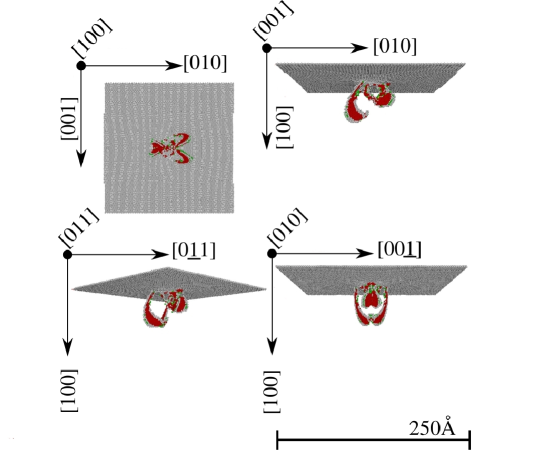
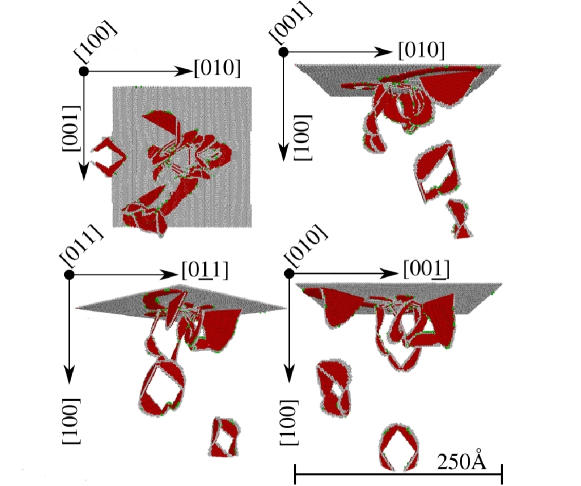
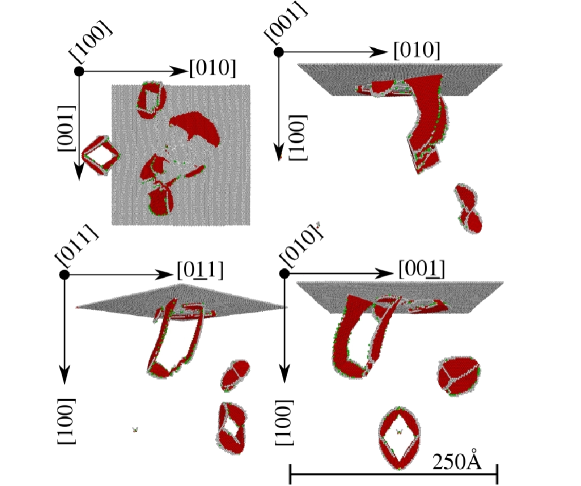
Figs, 6 and 7 give an atomistic presentation of the dislocations which developed in the substrate after the onset of plasticity. We analyzed the local atomic structures using a method based on the angular correlation of nearest-neighbour atoms.Ackland and Jones (2006) We found this method to be superior for our purposes than the more common analysis based on the centrosymmetry parameter.Kelchner et al. (1998) Only atoms deviating from the fcc structure are visualized: the hcp stacking faults (red) are surrounded by unidentifiable structures of low symmetry (grey) and a very small amount of particles in a bcc coordination (green). These grey and green atoms occur at the boundaries of the dislocation loops due to the strong lattice deformations existing there and mark the ends of the loops. The free surface is also coloured grey.
Fig. 6 displays the plasticity shortly after the nucleation of the first dislocations; note that the two materials shown here have a similar yield point (cf. Fig. 4), so that the amount of dislocated material can be compared. The damage is more concentrated around the indenting sphere for the stiffer material. Note also that the size of the dislocation loops has increased for the softer material.
For fully developed plasticity (Fig. 7) we observe how prismatic dislocation loops have formed and were driven away from the indenter. In all cases which we studied, the {111} glide system was activated first, and later, i.e. under larger stress gradients, also the {111} glide system. This is a mere consequence of crystallography and is reflected by the smaller Schmid factor for the latter glide system; as expected, the changed elastic stiffness in our model crystals does not influence which glide systems are activated. However, it does affect the form and size of the plastic zones. Thus, for smaller elastic stiffness, (Fig. 7a), evidently more and smaller loops have been generated. This is in agreement with our finding that for smaller stiffness, also the unstable stacking fault energy – and hence the barrier to dislocation formation and slip – is smaller: hence we have more loops. In contrast, for the stiffer material (Fig. 7b), the nucleation of loops is retarded, and fewer but larger loops are formed.
IV Conclusions
-
1.
The Morse potential allows to systematically change the materials properties. We concentrate on changing the bulk modulus (and thus the elastic stiffness), while keeping the cohesive energy (bond strength) constant. In this potential, all elastic constants are changed in proportion to each other.
-
2.
Also the unstable stacking fault energy, which can be viewed as the resistance of a dislocation to gliding, changes in proportion to the elastic stiffness. The stable stacking fault energy, which is relevant for the width of partial dislocations, is quite unaffected from changes in the elastic stiffness.
-
3.
Not unexpectedly, the elastic part of the indentation curve scales with the elastic stiffness.
-
4.
The yield point, i.e., the indentation at which plasticity sets in, does not depend – apart from fluctuations – on the elastic stiffness.
-
5.
The load drop, which is experienced when plasticity sets in, increases in proportion to the elastic stiffness.
-
6.
The material hardness is proportional to the theoretical strength, and thus on the elastic stiffness; it is .
Acknowledgements.
The authors acknowledge financial support by the Deutsche Forschungsgemeinschaft via the Graduiertenkolleg 814.References
- Frenkel (1926) J. Frenkel, Z. Phys. 37, 572 (1926).
- Kelly and Macmillan (1987) A. Kelly and N. H. Macmillan, Strong Solids (Clarendon Press, Oxford, 1987), 3rd ed.
- Roundy et al. (1999) D. Roundy, C. R. Krenn, M. L. Cohen, and J. W. Morris, Phys. Rev. Lett. 82, 2713 (1999).
- Ogata et al. (2002) S. Ogata, J. Li, and S. Yip, Science 298, 807 (2002).
- Ogata et al. (2004) S. Ogata, J. Li, N. Hirosaki, Y. Shibutani, and S. Yip, Phys. Rev. B 70, 104104 (2004).
- Carlsson (1990) A. E. Carlsson, in Solid State Physics, edited by H. Ehrenreich and D. Turnbull (Academic Press, Boston, 1990), vol. 43, p. 1.
- Vitek (1968) V. Vitek, Philos. Mag. 73, 773 (1968).
- Cotterill and Doyama (1966) R. M. J. Cotterill and M. Doyama, Phys. Rev. 145, 465 (1966).
- Vitek (1988) V. Vitek, Philos. Mag. A 58, 193 (1988).
- Huang et al. (1989) J. Huang, M. Meyer, and V. Pontikis, Phys. Rev. Lett. 63, 628 (1989).
- Finnis (2003) M. Finnis, Interatomic forces in condensed matter (Oxford University Press, Oxford, 2003).
- Ziegenhain et al. (2008) G. Ziegenhain, A. Hartmaier, and H. M. Urbassek, in preparation (2008).
- Girifalco and Weizer (1959) L. A. Girifalco and V. G. Weizer, Phys. Rev. 114, 687 (1959).
- Lincoln et al. (1967) R. C. Lincoln, K. M. Koliwad, and P. B. Ghate, Phys. Rev. 157, 463 (1967).
- Smithells (1949) C. J. Smithells, Metals reference handbook (Butterworths, London, 1949).
- Rice (1992) J. R. Rice, J. Mech. Phys. Sol. 40, 239 (1992).
- Farkas et al. (1997) D. Farkas, S. J. Zhou, C. Vaihe, B. Mutasa, and J. Panova, J. Mater. Res. 12, 93 (1997).
- Lu et al. (2000) G. Lu, N. Kioussis, V. V. Bulatov, and E. Kaxiras, Phys. Rev. B 62, 3099 (2000).
- Mishin et al. (2001) Y. Mishin, M. J. Mehl, D. A. Papaconstantopoulos, A. F. Voter, and J. D. Kress, Phys. Rev. B 63, 224106 (2001).
- Hirth and Lothe (1982) J. P. Hirth and J. Lothe, Theory of dislocations (Wiley, New York, 1982), 2nd ed.
- (21) http://lammps.sandia.gov/.
- Kelchner et al. (1998) C. L. Kelchner, S. J. Plimpton, and J. C. Hamilton, Phys. Rev. B 58, 11085 (1998).
- Hertz (1882) H. Hertz, J. reine und angewandte Mathematik 92, 156 (1882).
- Fischer-Cripps (2004) A. C. Fischer-Cripps, Nanoindentation (Springer, New York, 2004), 2nd ed.
- Fischer-Cripps (2007) A. C. Fischer-Cripps, Introduction to contact Mechanics (Springer, New York, 2007), 2nd ed.
- Turley and Sines (1971) J. Turley and G. Sines, J. Phys. D 4, 264 (1971).
- Tabor (1951) D. Tabor, The hardness of metals (Clarendon Press, Oxford, 1951).
- Li (2007) J. Li, MRS Bull. 32, 151 (2007).
- Ackland and Jones (2006) G. J. Ackland and A. P. Jones, Phys. Rev. B 73, 054104 (2006).
| (eV) | (Å-1) | (Å) | (GPa) | (GPa) | (mJ/m2) |
|---|---|---|---|---|---|
| 0.203 | 0.90 | 3.47 | 67.7 | 39.2 | 71.8 |
| 0.272 | 1.12 | 3.10 | 98.6 | 58.6 | 89.9 |
| 0.320 | 1.28 | 2.93 | 124.2 | 74.4 | 85.8 |
| 0.337 | 1.33 | 2.89 | 134.4 | 80.5 | 113.8 |
| 0.359 | 1.41 | 2.83 | 145.9 | 88.2 | 96.2 |
| 0.390 | 1.54 | 2.77 | 178.7 | 106.5 | 118.9 |
| 0.416 | 1.65 | 2.72 | 197.7 | 118.9 | 135.9 |
| 0.437 | 1.76 | 2.69 | 227.3 | 136.0 | 163.5 |
| 0.455 | 1.86 | 2.66 | 244.5 | 147.4 | 181.6 |
| 0.471 | 1.96 | 2.64 | 269.0 | 162.3 | 203.3 |
| 0.484 | 2.05 | 2.63 | 300.7 | 180.4 | 228.9 |
| 0.495 | 2.13 | 2.62 | 325.2 | 194.9 | 248.6 |
| 0.504 | 2.22 | 2.61 | 351.1 | 210.5 | 268.8 |
| 0.513 | 2.30 | 2.60 | 369.8 | 222.6 | 283.1 |
| 0.520 | 2.38 | 2.60 | 412.4 | 246.2 | 315.3 |
| 0.526 | 2.45 | 2.59 | 420.5 | 252.7 | 320.2 |
| 0.532 | 2.52 | 2.59 | 458.3 | 274.1 | 348.0 |
| 0.537 | 2.59 | 2.58 | 460.9 | 277.8 | 348.6 |
| 0.555 | 2.92 | 2.57 | 590.0 | 354.8 | 433.8 |
| 0.563 | 3.16 | 2.57 | 720.0 | 430.4 | 516.3 |
| 0.571 | 3.38 | 2.56 | 772.7 | 465.7 | 538.1 |
| 0.589 | 3.54 | 2.56 | 881.5 | 530.3 | 599.9 |
| 0.591 | 3.73 | 2.56 | 990.1 | 594.5 | 655.3 |