Nakagawa et al.Astrometry of S Crt with VERA \Received2000/12/31\Accepted2001/01/01
Astrometry: — masers(H2O) — stars: individual(S Crt) — stars: variables: other
VLBI Astrometry of AGB Variables with VERA
– A Semiregular Variable S Crateris –
Abstract
We present a distance measurement for the semiregular variable S Crateris (S Crt) based on its annual parallax. With the unique dual beam system of the VLBI Exploration for Radio Astrometry (VERA) telescopes, we measured the absolute proper motion of a water maser spot associated with S Crt, referred to the quasar J11470724 located at an angular separation of 1.23∘. In observations spanning nearly two years, we have detected the maser spot at the LSR velocity of 34.7 km s-1, for which we measured the annual parallax of 2.330.13 mas corresponding to a distance of 430 pc. This measurement has an accuracy one order of magnitude better than the parallax measurements of HIPPARCOS. The angular distribution and three-dimensional velocity field of maser spots indicate a bipolar outflow with the flow axis along northeast-southwest direction. Using the distance and photospheric temperature, we estimate the stellar radius of S Crt and compare it with those of Mira variables.
1 Introduction
Very Long Baseline Interferometry (VLBI) is a powerful technique for obtaining positions of celestial objects with milliarcsecond (mas) level accuracy. The VLBI Exploration of Radio Astrometry (VERA) telescopes are a Japanese VLBI array dedicated to phase referencing VLBI (Kobayashi et al., 2003). VERA consists of four 20 m diameter antennas at Mizusawa, Ogasawara, Iriki and Ishigaki-jima (see figure 1 of Petrov et al. (2007)). To overcome phase fluctuations and the limited integration time in conventional fast-switching VLBI, VERA has a dual beam system that allows simultaneous observations of the target and reference sources separated by 0.3 to 2.2 degrees. This advanced capability of VERA can be used to measure annual parallaxes and proper motions of masers with a 10 micro arcsecond (as) level accuracy.
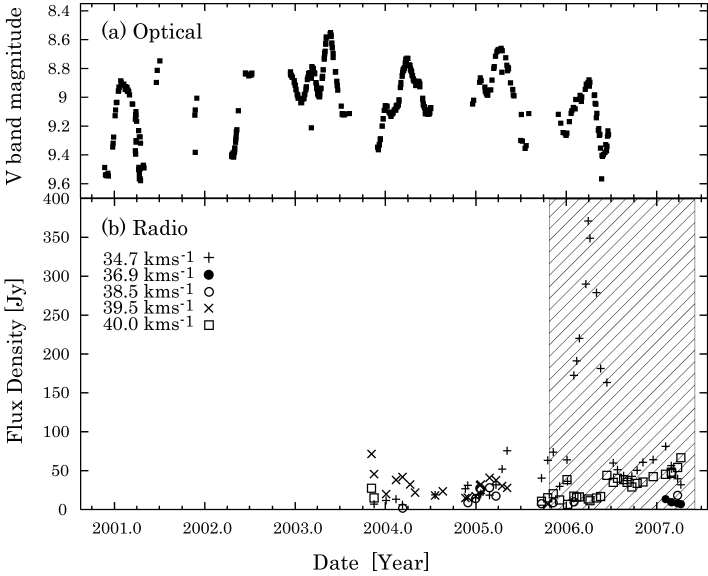
An annual parallax gives a simple geometrical measure of the distance, free from the complex assumptions required in other distance estimators. Studies of Asymptotic Giant Branch (AGB) stars by Whitelock et al. (2008), Kurayama et al. (2005), and Vlemmings et al. (2003) are based on the annual parallax derived from VLBI observations, and demonstrated the the ability of VLBI astrometry. More recently, successful measurements of distances and proper motions with VERA have been reported (Hirota et al., 2007; Honma et al., 2007; Imai et al., 2007; Hirota et al., 2008; Sato et al., 2007). In the present paper, we report the observations of S Crt, concentrating on the distance measurement. S Crt (IRAS115010719, IRC10259, AFGL4830S) is an AGB star, with a pulsation period of 155 days (Benson et al., 1990). S Crt has a variability type of SRb in the General Catalog of Variable Stars (Antipin et al., 2005). The apparent magnitude at band is 0.7860.314 mag (Cutri et al., 2003). The optical light curve in band is presented in figure 1(a) exhibiting 0.8 mag variation.
The distance to S Crt has been measured in various ways. Bowers & Johnston (1994) and Patel et al. (1992) determined the distance to be 420 pc and 285 pc, respectively, using the period-luminosity (PL) relation of Mira variables. Perryman et al. (1997) used HIPPARCOS data to measure a parallax of 2.041.31 mas, corresponding to a distance of 490 pc, but with an large uncertainty. Recently, the new HIPPARCOS catalog (van Leeuwen, 2007) gives the parallax of 1.270.92 mas, corresponding to a distance of 787 pc. VERA offers the potential to determine the parallax with a better accuracy so that the inconsistencies in these distance measurements can be resolved.
The observations and data reduction are described in section 2. In section 3, we present absolute positions and internal motions of maser spots. The annual parallax of S Crt is presented and converted to the absolute distance in this section. Finally, in section 4, we examine the properties of S Crt in the context of the new distance measurement.
2 Observations and data reduction
2.1 Observations
We have conducted a series of monthly VLBI observations from October 2005 to May 2007 with VERA. The duration of each observation was typically 8.5 hours, yielding a net integration time of 5 to 6 hours. The typical synthesized beam size (FWHM) was 1.5 mas 0.8 mas with a position angle (P.A.) of . To obtain the positions of maser spots in S Crt, the quasar J11470724 was simultaneously observed as the position reference. The J2000 a priori coordinates of two sources are (, ) (11 h 52 m 45.0981 s, 07∘ 35’ 48.072”) for S Crt, and (11 h 47 m 51.554035 s, 07∘ 24’ 41.14109”) for J11470724. J11470724 is classified as a “candidate” source in the catalog of the International Celestial Reference Frame (ICRF), and its position errors are 270 as and 290 as in R.A. and Dec, respectively (Ma et al., 1998). The separation and P.A. of these sources are 1.23∘ and .
From a total of 17 observations, we used 12 observations in the present study. The observation in 2005 November was not used because the Ishigaki-jima antenna did not participate. Bad weather conditions in four observations held between August and October in 2006 resulted in much higher system noise temperatures (500 K) at some of the stations. The shorter integration times and unsolved phase fluctuations in these four observations degraded the image qualities of S Crt in both self-calibration and phase reference analyses.
The observation status is summarized in table 1, which is organized as follows: Column (1)—The ID number of epoch. The numbers with an asterisk “*” indicates that the observation was used in the estimation of the annual parallax. Column (2)—Date of the observation. Column (3)—The year and day of the year (DOY). In the observations in 2007/013, 2007/096, and 2007/130, the phase referenced images are scattered into several components, while the self-calibrated images resulted in a single bright component, clearly indicating that the atmospheric conditions on these days prohibited succesful 22 GHz phase referencing. We did not use these three observations for the parallax estimation. In parallel with the VLBI program, we have monitored S Crt with single-dish observations at Iriki station since 2003 September with the typical interval of one month (see also Shintani et al. (2008)).
A data recording rate of 1024 Mbps was adopted with the VERA DIR2000 recording system, which yields the total receivable bandwidth of 256 MHz with 2-bit digitization. The 256 MHz bandwidth data of left-hand circular polarization were divided into 16 IF channels of 16 MHz band width, one of which was used to receive the maser emission and the others were used to receive the continuum emission from J11470724. Cross-correlation was carried out with the Mitaka FX correlator (Shibata et al., 1998) at the National Astronomical Observatory of Japan (NAOJ). In most observations, the IF channel assigned to the water maser was divided into 512 spectral channels, yielding a frequency spacing of 31.25 kHz corresponding to a velocity resolution of 0.42 km s-1. The observations in 2006/069 and 2006/129 provide two times higher frequency resolution than other observations, yielding a velocity resolution of 0.21 km s-1. For the data of J11470724, the IF channels were divided into 64 spectral channels in all observations.
2.2 Calibration and Imaging
We used the Astronomical Imaging Package Software (AIPS) developed in the National Radio Astronomical Observatory in the data reduction. Amplitude calibration was achieved using the system noise temperatures and gains logged during the observations at each station. In the fringe search process of the reference source J11470724, we used the task fring with a typical integration time of 2 minutes, with solutions of fringe phases, group delays, and delay rates obtained every 30 seconds. Using the task tacop, these solutions were transfered to the data of S Crt in order to calibrate the visibility data. Phase and amplitude solutions obtained from self-calibration of the J11470724 were also transferred to the S Crt data.
Since the delay-tracking models used to estimate a priori delays in the Mitaka FX correlator were not accurate enough for astrometry with VERA, we have applied better estimates calculated with the CALC3/MSOLV software package (Jike et al., 2005). Manabe et al. (1991) gave a brief description of this package in the report to the International Earth Rotation Service (IERS). CALC3 has slight differences in the physical models than those adopted in CALC which was developed by the research group at NASA Goddard Space Flight Center (GSFC). Comparing the two a priori values from Mitaka FX correlator and the CALC3/MSOLV package, we obtained the difference between the two estimates, then applied them to the visibility data using the tasks tbin and clcal in AIPS. We note that the zenith excess path lengths due to the wet atmosphere measured by the global positioning system (GPS) at each station are considered in the CALC3/MSOLV package.
We estimated the residual atmospheric zenith delay offset using the method described in Honma et al. (2007). This correction was applied to one of the four stations of VERA where the coherence of the phase-referenced image was maximized. Typically, the offsets were found within 3 cm.
The instrumental delay caused by the difference between two signal paths was estimated using an artificial noise source (Kawaguchi et al., 2000). These delays were then loaded into AIPS and applied in the same manner as the delay tracking model correction. For each observation, we fitted a two dimensional Gaussian model to the brightness distribution to find the position of the maser spot. Then we used these to derive the annual parallax and linear proper motions (, ).
In the single-beam VLBI imaging of S Crt, group delays solved with 3C279 were applied, then fringe-fitting was done using the brightest emission showing the LSR velocity of 34.7 km s-1. Thus relative positions of all maser spots in self-calibrated images were determined with respect to this reference spot. For each velocity channel, position of the spot is defined as the brightness peak of the image. To estimate the relative motion of each spot, a linear least-squares analysis was applied to the spot seen at the same velocity channel during at least two continuous observations. The signal to noise ratio of 10 was adopted as the detection criterion in the self-calibrated images. The rms noise of the self-calibrated images was typically 90 mJy beam-1. On the other hand, the rms noise of the phase-referenced images was typically 700 mJy beam-1, about one order of magnitude larger than that of self-calibrated images. Due to limited phase coherence the phase referenced images have limited signal-to-noise (30 vs 307 in the self-calibrated images).
| ID | Date | Year/DOY |
|---|---|---|
| 1* | 2005 October 19 | 2005/292 |
| 2* | 2005 December 3 | 2005/337 |
| 3* | 2006 January 5 | 2006/005 |
| 4* | 2006 February 11 | 2006/042 |
| 5* | 2006 March 10 | 2006/069 |
| 6* | 2006 May 9 | 2006/129 |
| 7* | 2006 November 13 | 2006/317 |
| 8* | 2006 December 11 | 2006/345 |
| 9 | 2007 January 13 | 2007/013 |
| 10* | 2007 February 21 | 2007/052 |
| 11 | 2007 April 06 | 2007/096 |
| 12 | 2007 May 10 | 2007/130 |
3 Results
3.1 Annual parallax and distance
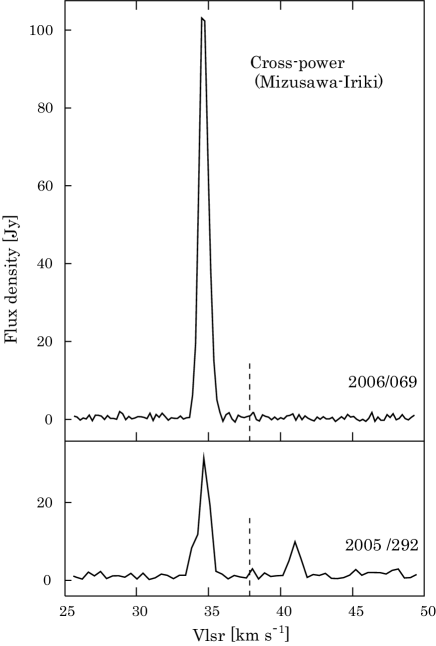
In figure 2, cross-power spectra of S Crt from 2005/019 (upper) and 2006/069 (lower) on the Mizusawa–Iriki baseline are presented. The time variation of the flux densities with the total power spectrum are presented in figure 1(b) with an indication of each LSR velocity. The 34.7 km s-1 spot underwent a radio flare (e.g. Shimoikura et al. (2005)). This flare started in February 2006 and reached a maximum of 371 Jy in March 31 (2006/090), then it decreased to 60 Jy in July. During the flare, this spot did not show structural change. The cross-power spectrum at the same time showed significantly weaker (30%) flux density than that of the total power spectrum, indicating that some of the flared emission is resolved on the VERA baselines.
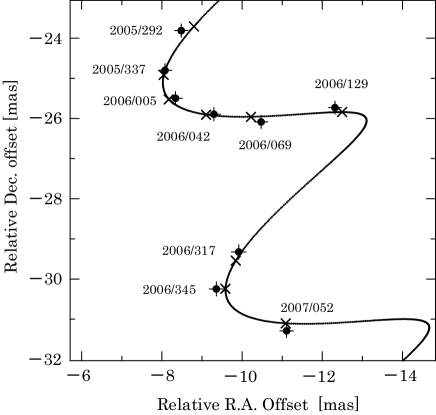
In figure 3, we present the positions of maser spot at the LSR velocity of 34.7 km s-1 relative to the phase tracking center. Throughout the present VLBI observations, this maser spot was bright enough to be detected on all baselines in the phase referencing analyses. The proper motion was clearly modulated by a parallax. Based on a least-squares fitting analysis, the parallax was determined to be 2.330.13 mas which corresponds to a distance of 430 pc. Here, we adopted position errors of each measurement that are obtained as the root sum squares of three error factors, and the details are given in section 4.1.
In the estimation of the parallax, we adopt a very small number of assumptions: the maser spot is moving on a linear trajectory with respect to the star, i.e., there is no acceleration, and the reference source is fixed on the sky, i.e., no motions due to core shift or jet features. From the fitting results, the linear proper motions of the reference spot (, ) were obtained to be (, ) ( mas yr-1, mas yr-1). This motion is the combination of the proper motion of S Crt system and internal motion of the maser spot in the system. Considering the offset of the reference spot from the phase tracking center (,) ( mas, mas), the J2000.0 absolute coordinates of this spot in 2005/292 were obtained to be (,) (11 h 52 m 44.96969 s, 07 ∘ 35’ 48.0958”). This is the position as referenced to the position of J11470742 and in relative offset to the original phase tracking centre. The uncertainty of this position is estimated as 400 as based on the errors in our phase referencing analysis (detailed in section 4.1) and ICRF position of J11470724.
The reference source J11470724 exhibited an unresolved structure. The correlated amplitude as a function of () distance is flat and the upper limit of the source size is 0.8 mas (FWHM), which is the minor axis of the synthesized beam in the present observation. In addition, we confirmed that the images of J11470724 showed no distinctive change during the observations.
3.2 Maser distribution and internal motions
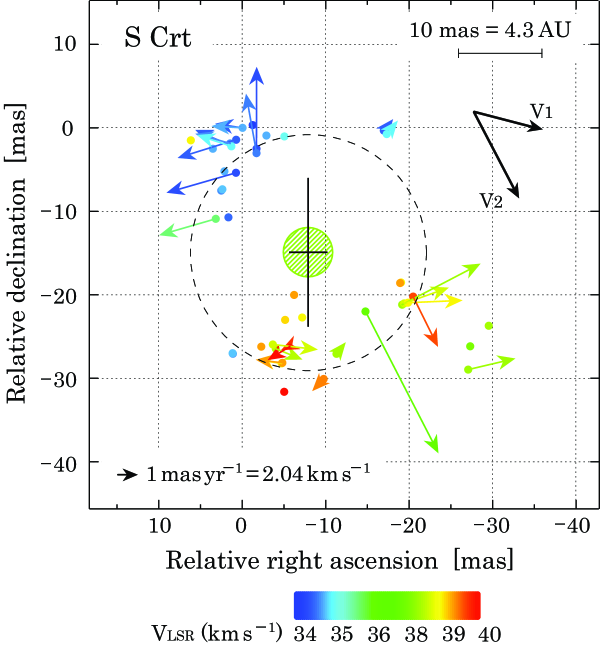
In figure 4, we present the angular distribution and three-dimensional velocity field of maser spots in S Crt covering a 60 mas 60 mas region. The maser spot with the LSR velocity of 34.7 km s-1 is placed at the map origin. At the distance of 430 pc, 1 mas corresponds to 0.43 AU, and 1 mas yr-1 corresponds to a velocity of 2.04 km s-1. The color index in figure 4 shows the LSR velocity range from 34.0 to 41.0 km s-1. The blue- and red-shifted components are separated into the northeast and southwest parts of the area. The relative motion of each spot (, ) with respect to the reference spot are used to determine the average motion (, ) and, hence we obtained (, ) (1.605 mas yr-1, 0.252 mas yr-1). Then, we subtracted (, ) from (, ) to obtain the internal motions (, ), that are presented with arrows in figure 4. We successfully detected the internal motions of 26 maser spots. The typical transverse speed was obtained to be 2.72 mas yr-1, corresponding to 5.56 km s-1, by averaging the internal motions of all 26 spots. The parameters of the motions are presented in table 2 in the increasing order of LSR velocity.
For the reference spot, we subtracted the internal motion from the proper motion (, ) and, thus, the proper motion of S Crt system was estimated to be ( mas yr-1, mas yr-1). In the new HIPPARCOS catalog (van Leeuwen, 2007), the absolute proper motion of S Crt was ( mas yr-1, mas yr-1), representing good consistency with our result within the errors.
| ID | ||||||||
|---|---|---|---|---|---|---|---|---|
| (km s-1) | (mas) | (mas) | (Jy beam-1) | (mas yr-1) | (mas yr-1) | |||
| 1 | 34.10 | 1.25 | 0.34 | 2.3 | … | … | … | … |
| 2 | 34.53 | 1.71 | 2.50 | 2.7 | 0.01 | 0.01 | 4.90 | 2.58 |
| 3 | 34.55 | 0.76 | 5.39 | 4.4 | 4.15 | 0.55 | 1.19 | 0.06 |
| 4 | 34.68 | 0.00 | 0.00 | 19.5 | 1.61 | … | 0.25 | … |
| 5 | 34.68 | 16.97 | 0.34 | 4.6 | 0.55 | 0.02 | 0.69 | 0.09 |
| 6 | 34.68 | 2.85 | 0.91 | 8.1 | … | … | … | … |
| 7 | 34.72 | 0.73 | 1.42 | 1.8 | 3.50 | 0.29 | 1.09 | 0.45 |
| 8 | 34.72 | 1.43 | 2.00 | 1.9 | 2.10 | 0.54 | 0.88 | 0.14 |
| 9 | 34.74 | 1.64 | 10.71 | 5.8 | … | … | … | … |
| 10 | 34.94 | 1.72 | 3.04 | 1.6 | 0.63 | 0.50 | 3.56 | 0.37 |
| 11 | 34.95 | 1.45 | 1.86 | 35.4 | 2.08 | 0.89 | 0.58 | 0.06 |
| 12 | 34.97 | 2.51 | 7.51 | 2.3 | … | … | … | … |
| 13 | 34.97 | 1.11 | 27.05 | 2.5 | … | … | … | … |
| 14 | 35.10 | 0.03 | 0.01 | 8.4 | 1.85 | 0.74 | 0.10 | 0.04 |
| 15 | 35.10 | 2.89 | 0.92 | 4.9 | … | … | … | … |
| 16 | 35.16 | 3.52 | 2.50 | 3.5 | … | … | … | … |
| 17 | 35.16 | 2.13 | 5.20 | 3.2 | … | … | … | … |
| 18 | 35.18 | 2.38 | 7.37 | 2.1 | … | … | … | … |
| 19 | 35.18 | 1.14 | 27.01 | 2.1 | … | … | … | … |
| 20 | 35.52 | 1.30 | 2.21 | 1.5 | 2.05 | 0.90 | 0.68 | 0.36 |
| 21 | 35.52 | 17.32 | 0.74 | 1.3 | 0.66 | 0.06 | 0.80 | 0.11 |
| 22 | 35.54 | 5.04 | 1.04 | 0.9 | … | … | … | … |
| 23 | 36.45 | 3.17 | 10.90 | 1.3 | 3.39 | 0.52 | 0.98 | 0.49 |
| 24 | 37.89 | 14.77 | 22.00 | 0.8 | 4.37 | 0 | 8.49 | 0 |
| 25 | 38.32 | 27.32 | 26.17 | 1.3 | … | … | … | … |
| 26 | 38.73 | 27.06 | 28.97 | 1.0 | 2.83 | 0.15 | 0.67 | 0.45 |
| 27 | 38.73 | 19.16 | 21.19 | 0.9 | 4.70 | 0 | 2.46 | 0 |
| 28 | 38.74 | 29.53 | 23.72 | 0.9 | … | … | … | … |
| 29 | 38.74 | 11.30 | 27.07 | 1.0 | 0.55 | 0.02 | 0.69 | 0.09 |
| 30 | 38.91 | 4.01 | 26.46 | 1.1 | 1.60 | 0.43 | 0.65 | 0.29 |
| 31 | 39.15 | 3.67 | 25.96 | 0.8 | 2.69 | 0.30 | 0.30 | 0.18 |
| 32 | 39.15 | 19.40 | 21.04 | 2.2 | 2.67 | 0.37 | 0.95 | 0.44 |
| 33 | 39.57 | 19.87 | 20.95 | 3.4 | 3.26 | 0 | 0.14 | 0 |
| 34 | 39.57 | 7.18 | 22.73 | 2.2 | … | … | … | … |
| 35 | 39.57 | 19.02 | 18.52 | 2.0 | … | … | … | … |
| 36 | 39.59 | 6.15 | 1.49 | 1.8 | … | … | … | … |
| 37 | 39.61 | 4.73 | 28.23 | 0.7 | 1.49 | 0 | 0.23 | 0 |
| 38 | 39.74 | 5.14 | 23.02 | 1.0 | … | … | … | … |
| 39 | 40.00 | 18.91 | 18.58 | 1.2 | … | … | … | … |
| 40 | 40.01 | 6.22 | 20.02 | 4.7 | … | … | … | … |
| 41 | 40.03 | 4.81 | 28.14 | 1.0 | 1.59 | 0 | 0.18 | 0 |
| 42 | 40.03 | 2.29 | 26.22 | 2.0 | … | … | … | … |
| 43 | 40.16 | 9.75 | 30.09 | 1.6 | 0.68 | 0.38 | 0.72 | 0.06 |
| 44 | 40.42 | 20.47 | 20.21 | 1.1 | 1.49 | 0.23 | 3.01 | 0.51 |
| 45 | 40.58 | 5.73 | 26.12 | 2.6 | 0.54 | 0.05 | 0.26 | 0.17 |
| 46 | 41.00 | 5.03 | 31.63 | 1.1 | … | … | … | … |
| 47 | 41.00 | 5.70 | 26.20 | 5.4 | 1.32 | 1.27 | 0.81 | 0.42 |
| Column (1)—Component ID. Column (2)—LSR velocity in km s-1. Column (3)—offset positions in R.A. relative to the original phase center. Column (4)—offset positions in Dec. relative to the original phase center. Column (5)—brightness of the spot at the first detection in Jy beam-1. Column (6)—best fit linear motion in R.A. in mas yr-1. Column (7)—standard errors of the motions in R.A. In case the number of successful detections were restricted to be only twice, we adopted the standard errors and for the spot as zero. Column (8)—best fit linear motion in Dec in mas yr-1. Column (9)—standard errors of the motions in Dec. | ||||||||
4 Discussion
4.1 Errors in the positions
Since it is difficult to identify contributions to positional errors in individual VLBI observations (Kurayama et al., 2005; Hachisuka et al., 2006; Honma et al., 2007; Sato et al., 2007; Hirota et al., 2007; Imai et al., 2007), we applied errors in each observation by evaluating following three error sources: (1) a zenith atmospheric delay offset at each station, (2) station position errors, and (3) image quality. The best estimates of the zenith atmospheric delay offsets fell within the range of 3 cm. Errors in the a priori station positions can result in additional phase residuals. Therefore, we assumed the offset of 3 cm even after the atmospheric offset calibration was done.
For a given separation of zenith angles between two sources , the difference of signal path lengths between the two directions caused by the zenith atmospheric delay residual can be estimated as follows,
| (1) |
where is the mean zenith angle of the observed sources. We adopted 1.23∘ as the approximation of . During our observations, the elevation angles higher than 30∘ were dominant. We assumed as the zenith angle for estimating errors of the worst case, and obtained 0.12 cm. Using a root sum squares of major and minor axes of the synthesized beam ( = 1.7 mas), we estimated a positional error of 156 as from the following expression,
| (2) |
where is the wavelength corresponding to the rest frequency of water masers. Since the position accuracy of antennas are determined to be 3 mm based on geodetic observations at S and X bands, we estimated the positional error () attributed to the baseline errors to be 5 as using the following expression,
| (3) |
where is the separation angle of the source pair. In addition, we estimated the measurement errors () which depends on the SNRs of the phase-referenced images. Finally, we obtained the position errors of each phase-referenced image by adding up quadratically the error factors, , and . The error bars in figure 3 represent the errors in each observation, and the averaged value of the errors is 167 as.
4.2 Maser Morphology
Figure 4 shows the internal motions of the masers pots around S Crt found in the present observations. Since the maser spots show a bimodal distribution about radial velocities and positions, we extract the kinematic essentials. The analytic tools based on the diagonalization of the velocity variance-covariance matrix (VVCM) (Bloemhof, 2000) and position variance-covariance matrix are used.
The elements of the VVCM matrix are presented as
| (4) |
where the diagonal elements are the velocity dispersion. Here and denote three orthogonal space axes (e.g., R.A., Dec., and radial coordinate ), denotes the th maser spot in a collection totalling N(26), and the bar indicates averaging over maser spots.
The vector (figure 4), which is a two-dimensional projections of the eigenvector for the largest eigenvalue, is the major principal axis of the VVCM. This axis of maximum internal velocity dispersion is the outflow axis. The axis of lies at a P.A. of , and also make an inclination angle with the plane of the sky, with the southwest lobe directed into the page (away from the observer). The VVCM was initially evaluated in a coordinate system with axes R.A., Dec., and radial coordinate z increasing toward the source, and then it was diagonalized.
We also considered the two-dimensional variance-covariance matrix to quantify the angular distribution of the maser spots. Here, the number of maser spots is 26, same as the case of VVCM. In the diagonalization of this matrix, one eigenvalue which is larger than the other by a factor of 3.1 was obtained. The corresponding eigenvector presented in figure 4 indicate the spatial elongation of the maser distribution. The position angle of this axis is found to be . Although maser velocity and position axes show a discrepancy of , the directions of these model-independent axes indicate the bipolar outflow with the major axis along northeast-southwest.
This dynamical property is not revealed by previous observation (Bowers & Johnston, 1994).
We estimate the stellar position from the present result by using the kinematic information. Since the motion of each maser spot are powered by the forming star, its position can be estimated as an origin of these motions. Here, we take one of the simplest kinematic models, which assumes a linear motion with a constant velocities from a single origin. This technique is essentially same as that used in Imai et al. (2000) and Honma et al. (2007). Based on this modeling, we obtained the origin of the maser motions which most effectively explain the observed positions and velocities. The stellar position from this kinematic analysis, the kinematic center was obtained to be (, ) (7.91.8 mas, 14.913.3 mas), which is indicated with the cross with error bars in figure 4. We used the first order moment with respect to the determined stellar position in order to find a typical distance of maser spots. The obtained distance was 14.23.5 mas, and presented with dashed line in figure 4. At the distance of 430 pc, the corresponding linear length is 6.11 AU. Since we estimated the inclination angle of the outflow axis, this projected length can be converted to the linear radius of 8.96 AU.
Nineteen years ago, the angular distribution of the masers was firstly observed with the NRAO Very Large Array in its A configuration (Bowers & Johnston, 1994). The masers were uniformly distributed over a 40 mas40 mas region with the LSR velocities ranging evenly from 33.4 to 44.2 km s-1 (figure 13 of Bowers & Johnston (1994)). In their study, the blue-(red-)shifted spots were found in the northeast(southwest) of the maser region. In addition, masers with intermediate velocities were found in the central region. Although the extent of the distribution is consistent with our result, we did not detect the masers in central region. In figure 4, the maser spots are mainly found at the peripheral region of the distribution. During the period of 2006.3 – 2007.0, we could not find the emission with intermediate velocities(see figure 2(b)), and it can explain the the absence of intermediate velocity maser spots . On the other hand, at the beginning and end of our VLBI observations, the masers with intermediate velocities are found in total power spectrum, and they distributed in the peripheral region. As Bowers & Johnston (1994) did not precisely mention the flux densities and sizes of each spot, it is difficult to specify the reason for our non-detection of the masers in central region. However, we can speculate as to the reason; (1) Our image sensitivities were not high enough to detect them. The rms noise 38 mJy beam-1 of Bowers & Johnston (1994) was lower than that of the present VLBI observations, 90 mJy beam-1. (2) The masers in central region have faded before the present VLBI observations. (3) The masers were extended and diffuse, therefore they were resolved out with the synthesized beam of VERA. For example, we find the effect of resolve-out (e.g. 30 % in 2006 March) from the comparison between cross-power spectrum (figure 2) and total-power spectrum (figure 1(b)).
4.3 Stellar diameter and temperature
We extract the stellar properties of S Crt using the distance. Aringer et al. (1999) determined the temperature of photosphere () in S Crt to be 3097100 K by fitting two blackbodies to its infrared spectrum. Using this temperature, we estimated an acceptable temperature range of 2600 – 3500 K. Here we assume that the light variation of 0.8 mag (figure 1(a)) is same in the infrared and caused only by the temperature variation. Aringer et al. (1999) reported that Mira variables show 2418 – 2902 K and SRVs shows 3005 – 3500 K. The estimated temperature range of S Crt is consistent with their finding.
It is worthwhile estimating the stellar radius of S Crt, since there is no direct measurement. Using the apparent magnitudes in infrared (J, H, and K), (3097 K) and the distance (430 pc), we estimated the radius of S Crt photosphere () to be cm (26020 ). This is presented with a shaded-circle in figure 4, and the center of circle is placed on the kinematic center. Using this radius, we estimated an acceptable radius range of 213 – 309, under the assumption that the light variation is caused, now, only by the radius variation. In the studies of Haniff et al. (1995) and van Leeuwen et al. (1997), s of dozen of Mira variables are presented, and most / is larger than 300. The photospheric radius of S Crt is close to the lower limits to those of Mira variables in the literature. Since the estimates of and are now available, the luminosity () of S Crt is estimated to be 2.291030 [W], resulting in the ratio / of 5970.
A similar analysis of data for a larger number of Mira and SRVs would be very useful for a better understanding of the difference and similarities between Mira variables and SRVs.
5 Summary
We have used VLBI monitoring observations with VERA to measure the absolute proper motions of a maser spot in S Crt with respect to the quasar J11470724. We obtained an annual parallax of 2.330.13 mas corresponding to a distance of 430 pc.
Nearly two years astrometric observations revealed the internal motions of 26 maser spots for the first time. Taking into account the internal motions of the reference maser spot, the absolute proper motion of S Crt system was obtained to be ( mas yr-1, mas yr-1), which is consistent with the result in the new HIPPARCOS catalog.
The three-dimensional velocity field of the maser spots in S Crt was also detected, clearly outlining a bipolar outflow with the major axis along northeast-southwest. The inclination of the axis with respect to the sky plane was . The angular size of the maser distribution can be converted to the linear maser distribution radius of 8.96 AU.
Using the photospheric temperature of 3097 K (Aringer et al., 1999), the band apparent magnitude 0.79, and the distance of 430 pc, the linear radius of S Crt photosphere () was estimated to be cm (26020 ). This radius is comparable with the lower limits to those of Mira variables in literatures.
References
- Antipin et al. (2005) Antipin, S. V., Pastukhova, E. N., & Samus, N. N. 2005, Informational Bulletin on Variable Stars, 5613, 1
- Aringer et al. (1999) Aringer, B., Höfner, S., Wiedemann, G., Hron, J., Jørgensen, U. G., Käufl, H. U., & Windsteig, W. 1999, A&A, 342, 799
- Benson et al. (1990) Benson, P. J., Little-Marenin, I. R., Woods, T. C., Attridge, J. M., Blais, K. A., Rudolph, D. B., Rubiera, M. E., & Keefe, H. L. 1990, ApJS, 74, 911
- Bloemhof (2000) Bloemhof, E. E. 2000, ApJ, 533, 893
- Bowers & Johnston (1994) Bowers, P. F., & Johnston, K. J. 1994, ApJS, 92, 189
- Cutri et al. (2003) Cutri, R. M., et al. 2003, The IRSA 2MASS All-Sky Point Source Catalog, NASA/IPAC Infrared Science Archive. http://irsa.ipac.caltech.edu/applications/Gator/,
- Hachisuka et al. (2006) Hachisuka, K., et al. 2006, ApJ, 645, 337
- Haniff et al. (1995) Haniff, C. A., Scholz, M., & Tuthill, P. G. 1995, MNRAS, 276, 640
- Hirota et al. (2007) Hirota, T., et al. 2007, PASJ, 59, 897
- Hirota et al. (2008) Hirota, T., et al. 2008, PASJ, 60, 37
- Honma et al. (2007) Honma, M., et al. 2007, PASJ, 59, 889
- Imai et al. (2000) Imai, H., Kameya, O., Sasao, T., Miyoshi, M., Deguchi, S., Horiuchi, S., & Asaki, Y. 2000, ApJ, 538, 751
- Imai et al. (2007) Imai, H., et al. 2007, PASJ, 59, in press
- Jike et al. (2005) Jike, T., Fukuzaki, Y., Shibuya, K., Doi, K., Manabe, S., Jauncey, D.L. Nicolson, G.D. & McCulloch, P.M. 2005, Polar Geoscience, 18, 26
- Kawaguchi et al. (2000) Kawaguchi, N., Sasao, T., & Manabe, S. 2000, Proc. SPIE, 4015, 544
- Kleinmann et al. (1978) Kleinmann, S. G., Sargent, D. G., & Dickinson, D. F. 1978, AJ, 83, 1206
- Kobayashi et al. (2003) Kobayashi, H., et al. 2003, ASP Conference Series, 306, 48P
- Kurayama et al. (2005) Kurayama, T., Sasao, T., & Kobayashi, H. 2005, ApJ, 627, L49
- Ma et al. (1998) Ma, C., et al. 1998, AJ, 116, 516
- Manabe et al. (1991) Manabe, S., Yokoyama, K. & Sakai, S. 1991, IERS Techn. Note, 8, 61
- Patel et al. (1992) Patel, N. A., Joseph, A., & Ganesan, R. 1992, Journal of Astrophysics and Astronomy, 13, 241
- Perryman et al. (1997) Perryman, M. A. C., et al. 1997, A&A, 323, L49
- Petrov et al. (2007) Petrov, L., Hirota, T., Honma, M., Shibata, K. M., Jike, T., & Kobayashi, H. 2007, AJ, 133, 2487
- Pojmanski (1997) Pojmanski, G. 1997, Acta Astronomica, 47, 467
- Sato et al. (2007) Sato, M., et al. 2007, PASJ, 59, 743
- Shibata et al. (1998) Shibata, K. M., Kameno, S., Inoue, M., & Kobayashi, H. 1998, IAU Colloq. 164: Radio Emission from Galactic and Extragalactic Compact Sources, 144, 413
- Shimoikura et al. (2005) Shimoikura, T., Kobayashi, H., Omodaka, T., Diamond, P. J., Matveyenko, L. I., & Fujisawa, K. 2005, ApJ, 634, 459
- Shintani et al. (2008) Shintani, M., et al. 2008, Submitted to PASJ.
- van Leeuwen et al. (1997) van Leeuwen, F., Feast, M. W., Whitelock, P. A., & Yudin, B. 1997, MNRAS, 287, 955
- van Leeuwen (2007) van Leeuwen, F. 2007, Hipparcos, the New Reduction of the Raw Data. By Floor van Leeuwen, Institute of Astronomy, Cambridge University, Cambridge, UK Series: Astrophysics and Space Science Library
- Vlemmings et al. (2003) Vlemmings, W. H. T., van Langevelde, H. J., Diamond, P. J., Habing, H. J., & Schilizzi, R. T. 2003, A&A, 407, 213
- Whitelock et al. (2008) Whitelock, P. A., Feast, M. W., & van Leeuwen, F. 2008, MNRAS, 386, 313