Power-Law Scaling in Protein Synthesis of a Stochastic Regulon
Abstract
We investigate the protein expression pattern of the lamB gene in Escherichia coli LE392. The gene product LamB is an important membrane protein for maltose transport into cells but it is also exploited by bacteriophage for infection. Although our bacterial population is clonal, stochastic gene expression leads to a majority population with a large receptor number and a minority population with a small receptor number. We find that LamB receptor distribution of the small- population is scale invariant, , where the exponent depends on growth conditions. A heuristic model is proposed that relates the observed exponent to the protein production rate.
The occurrence of scale invariance in physics and biology often reflects an important underlying principlePascual and Guinchard (2005); Volkov et al. (2003); McKane et al. (2000). Herein, we present a novel observation of spontaneous/stochastic gene expression that gives rise to a power-law distribution , where is the number of LamB receptors in individual bacteria. The experiment is made possible by a dual-colored phage labeling technique that renders the minority population quantifiable in a flow cytometer. The LamB is a maltose channel, but it is also exploited by phage as an infection site. We find that in addition to the main population with an average , there is a small sub-population () with a small receptor number. This small population increases the likelihood that the bacterial population as a whole survives a phage attackChapman-McQuiston (2007). Surprisingly, the small- population has a scale-invariant distribution , behaving very differently from the log-normal distribution commonly seen for major proteins in a bacteriumFurusawa et al. (2005); Krishna et al. (2005). We propose a model that takes into account the rate of protein synthesis and protein dilution due to cell division. This model yields a steady-state distribution with being a continuous function of the rate of protein synthesis.
Our experiments were carried out using E. coli LE392 that are sensitive to phage Chapman-McQuiston and Wu (2008). The maltose regulon of this strain is inducible; the LamB receptor number can be varied from a few to depending on culture conditionsSchwartz (1980). The bacteria were grown in M9 minimal medium supplemented with either 0.4% glucose or 0.4% maltose. Standard protocols were used to grow the bacteria and to purify the phageChapman-McQuiston and Wu (2008). The lamB is an essential gene for maltose metabolism when the substrate is present at a very low level (). However, in the current experiment, the maltose level is sufficiently high that the low receptor numbers does not impede the growth of the minority population (Chapman-McQuiston and Wu, 2008; Chapon, 1982). To quantify the number of LamB receptors for individual cells, bacteria were incubated with high concentrations of fluorescently labeled phage (dye/phage ratio ), and the brightness of each bacterium was interrogated using flow cytometry (Dako Cyan ADP). Using our labeling procedure, individual phage particles were bright enough to reach the detection threshold of the flow cytometerChapman-McQuiston and Wu (2008), making them quantifiable by the instrument.
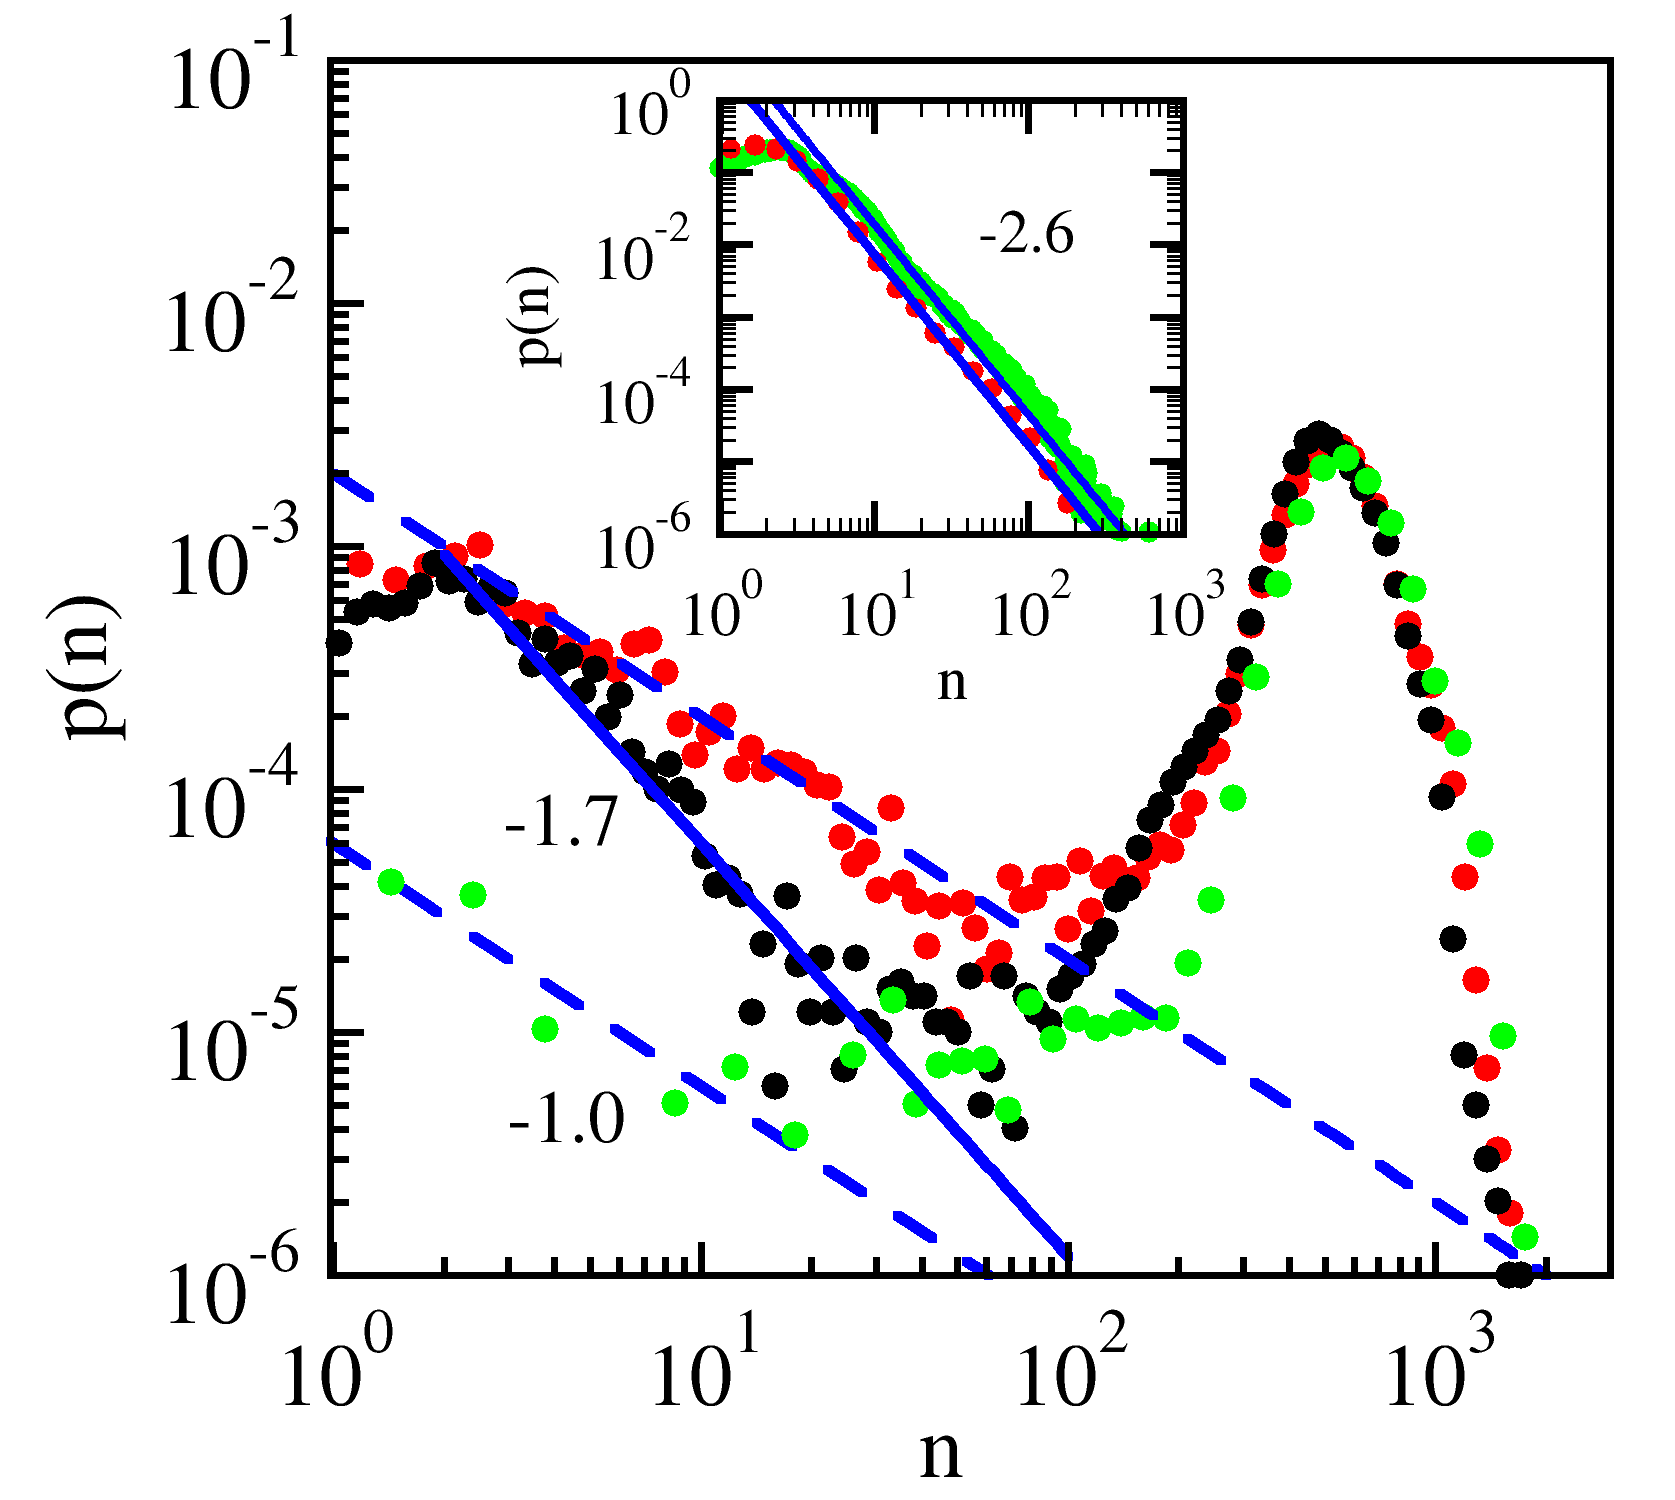
We show several runs of LE392 grown in M9+maltose in Fig. 1. The steady-state LamB probability distribution function (PDF) has two peaks, one around and the other near . The minority peak appears prominently in the log-log plot, but this sub-population is only a few percent of the total population. In rare cases, the fraction is even smaller, as indicated by the lowest curve in the figure. For all runs, the minority population has a power-law distribution that extends more than a decade in . The measured exponent is not constant but varies from run to run with ranging from to . This variation may reflect the sensitivity of to the varying protein production rates in different bacterial cultures. On the other hand, the PDF of the majority population is quite reproducible, and has the usual log-normal formKrishna et al. (2005). We conjecture that segregation of cells into minority and majority populations is shaped by phage selection. The low phenotype allows the bacterial population to hedge its bets due to the dual functionality of LamB receptors. These minority cells are less fit when maltose is not abundant in the environment, but their presence increases the chance that the population as a whole survives a phage attack.
We used a dual-colored phage labeling technique to investigate the role of the minority cells in the recovery of a bacterial population after a phage attack. Specifically, we are interested in the time scale of recovery, and the relationship between the minority and the majority populations. Our method consists of introducing red-labeled (AlexaFluor 633) phage into the bacterial population. The bacteria is exposed to the phage for 30 minutes, and the phage pressure, defined as the initial phage concentration , is then relieved by several washing stepsChapman-McQuiston (2007). The phage selectively decimates bacteria that express a large number of receptors, leaving only cells with small number of receptors. The surviving bacteria were then allowed to regrow in a fresh medium. Throughout the regrowth period, the bacteria were continuously diluted into prewarmed fresh media. This procedure ensures that the bacterial concentration is always less than , and the background phage concentration is below so that the probability that a phage binds to a bacterium is very smallChapman-McQuiston (2007). To quantify the time-dependent receptor distribution , a small sample was periodically taken from the exponentially growing culture. The receptors on individual cells were tagged with green-labeled (AlexaFluor 488) phage and interrogated via flow-cytometryChapman-McQuiston and Wu (2008). To stringently discriminate deceased cells, the bacterial sample was also treated with propidium iodide, which specifically labels the dsDNA of infected cells making them fluoresce brightly in orange. The green channels of the flow cytometer is conditioned on the red (the killing phage) and the orange channels (the dead cells) to get rid of the background count.

Figure 2 depicts a sequence of LamB PDFs, , before and after the bacteria were exposed to phage. Before the phage exposure (Fig. 2a), the LamB distribution has a primary peak at and a secondary peak at similar to the data in Fig. 1. The minority peak at small in this case scales as as delineated by the solid lines in Fig. 2a. The majority population is quickly eliminated by the exposure to the phage (Fig. 2b), but cells with a small remain unaffected. Here we observed that the scaling extends over more than three decades . After the removal of phage, the majority cell population slowly grows back to its original form in hrs (Fig. 2(c-f)), with the distribution of the minority cells maintaining the same shape the entire time. This result is robust in that the functional form of the minority population is time invariant for a wide range of initial phage concentrations so long as is not large enough to erode the minority population. This observation suggests that stochastic switching between the minority and the majority states is relatively slow, indicating a weak coupling between the two populations. In other words, the minority population is able to replenish itself, maintaining the self-similar form independent of the majority population.
The maltose regulon is inactivated if LE392 is grown in M9+glucose instead of maltose. This is a part of catabolic repression resulting from a sharp drop of cAMP concentration in cells when glucose is present. However, stochastic events still lead LamB to be expressed at a very low level . The inset of Fig. 1 displays measurements of the steady-state LamB distribution for this case. We observe that, over a broad range of , also decays as a power law with the exponent . In this case, the run-to-run variation of is smaller than that of the maltose-grown cells. Therefore, the uninduced (or chemically repressed) bacteria and the minority population of the induced bacteria both have power-law LamB distributions although with somewhat different and . The larger seen in the maltose-grown cells suggests that this minority population is more sensitive to external variations than uninduced cells and are hence more susceptible to environmental changes.
The population-balance approachRamkrishna (2000) can be used to help understand the protein distributions in a bacterial population. The number of cells with proteins at time , , obeys a master equation:
| (1) |
where is the partition probability of a daughter cell inheriting receptors from a mother cell with receptors, and and are respectively the state-dependent protein production rate and the cell division rate. The integration on the right-hand side of Eq. 1 takes into account the long-range effect of protein redistribution as a result of cell division. Based on our experiments, the division rate for the majority and minority cells are about the same, and as an approximation, we assume . In the steady state, a separation of variables is possible, , where is the exponentially growing bacterial population and is the normalized steady-state PDF. In this case, Eq. 1 simplifies to:
| (2) |
During cell division, daughter cells inherit proteins from mother cells. If the partition of proteins is random, we expect that the sharing of proteins between the two daughter cells will follow a binary distribution. As a simplification, we treated as a -function with . This approximation becomes progressively better with increasing . Finally, we follow Ref.Krishna et al. (2005) and assume that the protein production rate is linear in with . This means that in the absence of cell division the proteins in an individual cell grows exponentially, . With these assumptions, Eq. 2 becomes
| (3) |
To appreciate the important role of cell division in redistribution of proteins, consider a simple biologically relevant situation where a group of cells, spanning a broad range of receptor states (), produces no protein . This could be a result of kinetic reasons such as deficiency in some transcriptional factor or, as discussed below, a lack of a DNA loop necessary for the transcription initiation of LamBRichet and Sogarrd-Andersen (1994). Although these cells produce no protein, they are genetically and physiologically identical to their cousins in the majority population and should be capable of producing a large number of proteins if this kinetic barrier is eliminated. If this protein production is rare and temporary, we would have a simple fire-and-divide scenario in which a large number of LamB receptors can be generated in a short burst. Cell division then dilutes the protein number, filling the low states. We can account for this mechanism by adding a term to the right hand side of Eq. 3, where represents a burst of proteins from the state. We assume that is a continuous function peaked at , which defines the upper bound of the minority population. It follows that within , the steady-state solution is , which is consistent with some of our observations in the induced minority populations displayed in Figs. 1 and 2.

We show below that a finite protein production rate () can significantly alter the protein PDF, but the distribution remains as a solution of Eq. 3. Note that if is an homogeneous function of degree, , then so is . Substituting this power-law form into Eq. 3 gives the transcendental equation , where is the reduced protein production rate. This equation has two roots, one being independent of , and the other root being a monotonically increasing function of , as shown in Fig. 3. We find that the second root is less than for small protein production rate , indicating that is an accumulation point. For , with becoming positive for . In this case, the cummulative probability is infinite for large . We interpret this to mean that the cells leave the minority state for . Fig. 3 also shows that is a steep function of for small . This may be why the exponent varies from run to run. For instance, for the maltose-grown cells, the variations seen in ( ) only corresponds to a relatively small change in , i.e., .
It is unclear at present what mechanism gives rise to the segregation of cells into the majority and the minority populations. One possibility is due to the DNA loop required to initiate the transcription of lamB (see Fig. 3), which is under control of the malKp promoterBoos and Shuman (1998). Previous genetic studies have shown that the binding of an RNA polymerase to malKp requires the repositioning of three MalTs, the primary transcriptional activators, from a set of non-productive sites (3-5) to a set of productive sites (3’-5’) that is staggered by 3 bpRichet and Sogarrd-Andersen (1994). The repositioning requires the formation of a loop involving two additional MalTs at sites bp apart from the first three, and the binding of CRPs (cAMP receptor protein) to three sites located in the intervening region of the DNA as delineated in Fig. 3. Unlike lac and ara operons, where the DNA loop enhances repression, here it is essential for the initiation of lamB transcription. If the bacteria in the minority population cannot form the loop due to a deficiency either in CRP or MalT proteins, LamB will be transcribed at a very low rateRichet and Sogarrd-Andersen (1994). Since the formation of a loop is a statistical event subject to thermal fluctuations, the ratio of the minority to the majority populations may reflect the energy difference between the open and the closed conformations. For a large population, the statistical nature of the process ensures that the ratio between the two populations will be constant as seen in our experimentVilar and Leibler (2003). Early experiments also showed that MalT expression is limited both in the transcription and in the translationChapon (1982), indicating that maltose regulon has evolved in a way that enhances the expression noise in the population. This is in contrast with most regulatory proteins for which the system is typically constructed in a way to minimize the protein-number fluctuations. LamB, however, is exploited not only by but also by several other bacteriophage such as K10 and TP1. The noisy expression pattern makes biological sense because the phenotype can help the bacterial population cope with environmental fluctuations. In the uninduced state, the repressed cells still have a broad distribution of receptors, making them ready for full induction in the case that maltose or maltodextrins become available. In the fully induced case, the majority of cells can prosper in the environment but a small minority is protected from potential phage infections. This scenario is consistent with our recent observations that the heterogeneous bacterial population is more fit in an environment where phage is presentChapman-McQuiston and Wu (2008).
In conclusion, we found that when lamB gene is fully induced in a bacterial culture, the cells segregate into two populations with very different LamB receptors numbers per bacterium. The majority population, which consists of more than 98% of bacteria, has a mean receptor number but the minority population has only a few receptors on average. We believe that this novel phenotype is selected for because the bacterium coevolves with viruses that exploit its receptor. We propose that the controlling mechanism is the DNA loop structure for transcriptional initiation of lamB gene. A noticeable feature of the minority population is that the number of proteins obeys a power-law distribution with varying from run to run in induced cell cultures. Using a simple model, we showed that the power-law scaling for can be accounted for by a low protein production rate and a back-cascade process due to cell division. Since the model relies on very general features of protein production and cell division, we believe that our result is applicable to other proteins in the minority population.
We would like to thank C.C. Chen and D. Jasnow for useful discussions.
References
- Pascual and Guinchard (2005) M. Pascual and F. Guinchard, Trends in Ecology and Evolution 20, 88 (2005).
- Volkov et al. (2003) I. Volkov, J. Banavar, S. Hubbell, and A. Maritan, Nature 424, 1035 (2003).
- McKane et al. (2000) A. McKane, D. Alonso, and R. Sole, Phys. Rev. E 62, 8466 (2000).
- Chapman-McQuiston (2007) E. Chapman-McQuiston, Ph.d., University of Pittsburgh (2007).
- Furusawa et al. (2005) C. Furusawa, T. Suzuki, A. Kashiwagi, T. Yomo, and K. Kaneko, arXiv:q-bio.MN/0503040 v1 (2005).
- Krishna et al. (2005) S. Krishna, B. Banerjee, T. Ranmakrishnan, and G. Shivashankar, Proc. Nat. Acad. Sci. USA 102, 4771 (2005).
- Chapman-McQuiston and Wu (2008) E. Chapman-McQuiston and X. Wu, Biophys. J. 94, 4525 and 4537 (2008).
- Schwartz (1980) M. Schwartz, Virus Receptors (Receptors and Recognition, Series B, Vol. 7 (Chapman and Hall, London, 1980).
- Chapon (1982) C. Chapon, The EMBO Journal 1, 369 (1982).
- Ramkrishna (2000) D. Ramkrishna, Population Balances: Theory and Applications to Particulate Systems in Engineering (Academic Press, San Diego, CA, 2000).
- Richet and Sogarrd-Andersen (1994) E. Richet and L. Sogarrd-Andersen, EMBO J. 13, 4558 (1994).
- Boos and Shuman (1998) W. Boos and H. Shuman, Microbiol. Mol. Biol. Rev. 62, 204 (1998).
- Vilar and Leibler (2003) J. Vilar and S. Leibler, JMB 331, 981 (2003).