On the phase diagrams of the ferromagnetic superconductors UGe2 and ZrZn2
Michael G. Cottam1, Diana V. Shopova2, and Dimo I. Uzunov1,2∗
1 Department of Physics and Astronomy, University of Western Ontario, London, Ontario N6A 3K7, Canada.
2 CP Laboratory, Institute of Solid State Physics, Bulgarian Academy of Sciences, BG-1784 Sofia, Bulgaria.
∗ Corresponding author. Email: d.i.uzunov@gmail.com.
Pacs: 74.20.De, 74.25.Dw, 64.70.Tg
Keyword: unconventional superconductivity, quantum phase transition, strongly correlated electrons, multi-critical point, phase diagram.
Abstract
A general phenomenological theory is presented for the phase behavior of ferromagnetic superconductors with spin-triplet electron Cooper pairing. The theory accounts in detail for the temperature-pressure phase diagram of ZrZn2, while the main features of the diagram for UGe2 are also described. Quantitative criteria are deduced for the U-type (type I) and Zr-type (type II) unconventional ferromagnetic superconductors with spin-triplet Cooper electron pairing. Some basic properties of quantum phase transitions are also elucidated.
The remarkable coexistence of itinerant ferromagnetism and unconventional (spin-triplet) superconductivity at low temperatures ( K) was discovered experimentally in the intermetallic compounds UGe2 [1, 2, 3], ZrZn2 [4], and URhGe [5]. Other metallic compounds, such as UCoGe [6, 7] and UIr [8, 9], were also found to be spin-triplet ferromagnetic superconductors. In ZrZn2, URhGe, and UCoGe, the mixed phase of coexistence of ferromagnetism and unconventional superconductivity (labeled the FS phase) occurs over a wide range of pressure (i.e., from ambient pressure bar up to kbar). By contrast, in other compounds (e.g., UGe2 and UIr) this FS phase is found only in the high-pressure part ( kbar) of the phase diagram.
Another feature of the above compounds is that the FS phase occurs only in the ferromagnetic phase domain of the diagram. Specifically, at equilibrium and a given , the temperature of the normal-to-ferromagnetic phase (or N-FM) transition is never lower than the temperature of the ferromagnetic-to-FS phase (or FM-FS) transition. This is consistent with the point of view that the superconductivity in these compounds is triggered by the spontaneous magnetization , by analogy with the well-known triggering of the superfluid phase A1 in 3He at mK temperatures by the external magnetic field . This helium-analogy has been used in some theoretical studies (see, e.g., [10, 11, 12, 13]), where Ginzburg-Landau (GL) free energy terms to describe the FS phase were derived by symmetry arguments.
For the spin-triplet ferromagnetic superconductors the trigger mechanism was recently examined in detail [13]. The main system properties are affected by a term in the GL expansion of the form , which represents the interaction of with the complex superconducting vector field . Specifically, this term triggers for certain and values. An analogous trigger mechanism is familiar in the context of improper ferroelectrics [14].
A crucial consideration in this work is the nonzero magnetic moment of the spin-triplet Cooper pairs of the electrons. While the spin-singlet Cooper pairs have net spin zero and are quite sensitive to the magnitude of the magnetic induction , the spin-triplet pairs are known to be robust with respect to relatively large . The phenomena of spin-triplet superconductivity and itinerant ferromagnetism are both due to the same electron bands of the compounds: the -band electrons in uranium-based compounds and the -band electrons in ZrZn2. However, the microscopic band theory of magnetism and superconductivity in non-Fermi liquids of strongly interacting heavy electrons is either too complex or insufficiently developed to describe the complicated behavior in itinerant ferromagnetic compounds. Consequently, several authors (see [10, 11, 12, 13, 15]) have explored a phenomenological description within self-consistent mean field theory, and we build on a similar approach here.
In this Letter, by focusing on ZrZn2 and UGe2 with their contrasting types of behavior, we show that the phase diagrams of spin-triplet ferromagnetic superconductors can be successfully described starting from the general GL free energy established in Refs. [10, 11, 12, 13]. The present phenomenological approach includes both mean-field and spin-fluctuation theory (SFT), as in [16], considerations. We propose a simple, yet comprehensive, modeling of the dependence of the free energy parameters, from which it is shown that the phase diagram of ZrZn2 is obtained in good quantitative agreement with the experimental data [4]. Further, the main features [1] of the diagram of UGe2 are also well-described within our approach. The theory is capable of outlining several different possible topologies for the phase diagram, depending on the GL parameters of the material which can be chosen in accordance with experiment. Quantitative criteria emerge for two distinct types of behavior for unconventional ferromagnetic superconductors, which we label Zr-type and U-type. Further possible applications are to URhGe, UCoGe, and UIr. Our results address questions regarding the order of the quantum phase transitions at ultra-low and zero temperatures. They also pose intriguing questions pointing to further experimental investigations of (e.g.) the detailed structure of the phase diagrams in the high-/low- region.
Following Ref. [13] the free energy per unit volume, , can be written in the form
| (1) |
The material parameters satisfy, as in [13], , , , and , where gives the standard form of , and applies for SFT [16]. The terms proportional to and describe, respectively, the anisotropy of the spin-triplet electron Cooper pairs and the crystal anisotropy. Next, (with the ferromagnetic exchange constant) and are parameters of the - interaction terms. Previous mean-field studies have shown that the anisotropies represented by the and terms in Eq. (1) slightly perturb the size and shape of the stability domains of the phases, while similar effects can be achieved by varying the factor in the term. For these reasons, in the present analysis we ignore the anisotropy terms, setting , and consider as an effective parameter. Then, without loss of generality, we are free to choose the magnetization vector to have the form .
A convenient dimensionless free energy can now be defined by , where is the value of corresponding to the pure magnetic subsystem at and . On scaling the order parameters as and we obtain
| (2) |
where , , and is the phase angle between the complex and . The dimensionless constants are , with , , and . The reduced temperatures are , , .
The analysis involves making simple assumptions for the dependence of the , , , and parameters in Eq. (2). Specifically, we assume that only has a significant dependence, described by , where and is a characteristic pressure deduced later. In ZrZn2 and UGe2 the values are very close to the critical pressure at which both the ferromagnetic and superconducting orders vanish, but in other systems this is not necessarily the case. As we will discuss, the nonlinearity () of in ZrZn2 and UGe2 is relevant at relatively high , at which the N-FM transition temperature may not coincide with .
The simplified model in Eq. (2) is capable of describing the main thermodynamic properties of spin-triplet ferromagnetic superconductors. There are three stable phases: (i) the normal (N) phase, given by ; (ii) the pure ferromagnetic (FM) phase, given by , ; and (iii) the FS phase, given by , , where and satisfies
| (3) |
We note that FS is a two-domain phase as discussed in Ref. [12, 13]. Although Eq. (3) is complicated, some analytical results follow, e.g., we find that the second order phase transition line separating the FM and FS phases is the solution of
| (4) |
Under certain conditions, the curve has a maximum at with pressure found by solving . Examples will be given later, but generally this curve extends from ambient up to a tri-critical point labeled B, with coordinates , where the FM-FS phase transition occurs at a straight line of first order transition up to a critical-end point C. The lines of all three phase transitions (N-FM, N-FS, and FM-FS) terminate at C. For the FM-FS phase transition occurs on a rather flat, smooth line of equilibrium transition of first order up to a second tricritical point A with and . Finally, the third transition line terminating at C describes the second order phase transition N-FM. The temperatures at the three multi-critical points correspond to , , and , while the values can be deduced from the previous equations. These results are valid whenever , which excludes any pure superconducting phase () in accord with the available experimental data. Note that, for any set of material parameters, and .
A calculation of the diagram from Eq. (2) for any material requires some knowledge of , , , , and . The temperature can be obtained directly from the experimental phase diagrams. The model pressure is either identical to or very close to the critical pressure at which the N-FM phase transition line terminates at . The characteristic temperature of the generic superconducting transition is not available from the experiments and thus has to be estimated using general consistency arguments. For we must have at , where . For , and therefore for cases where is too small to be observed experimentally, can be ignored. For systems where is measurable this argument does not hold. This is likely to happen for (for , is very small). However, in such cases, pure superconducting phase should be observable. To date there are no experimental results reported for such a feature in ZrZn2 or UGe2, and thus we can put . We remark that negative values of are possible, and they describe a phase diagram topology in which the FM-FS transition line terminates at for . This might be of relevance for other compounds, e.g., URhGe.
Typically, additional features of the experimental phase diagram must be utilized. For example, in ZrZn2 these are the observed values of and the slope at . For UGe2 one may use , , and , where the last quantity denotes the other solution (below ) of . The ratios and can be deduced using Eq. (4) and the expressions for , , and , while is chosen by requiring a suitable value of .
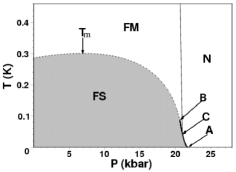
Experiments [4] for ZrZn2 indicate K, K, kbar, and is almost a straight line, so describes the -dependence. The slope for at is harder to estimate; its magnitude should not exceed on the basis of a straight-line assumption, implying . However, this ignores the effect of a maximum, although it is unclear experimentally in ZrZn2, at (). If such a maximum were at we would have , whereas a maximum with and provides us with an estimated range . The choice gives and , but similar values hold for any . The multi-critical points A and C cannot be distinguished experimentally. Since the experimental accuracy [4] is less than mK in the high- domain ( kbar), we suppose that mK, which corresponds to . We employed these parameters to calculate the diagram using and . The differences obtained in these two cases are negligible, with both phase diagrams being in excellent agreement with experiment.
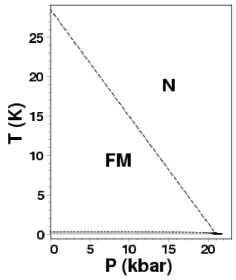
The latter value is used in Fig. 1, which gives kbar, kbar, kbar, K, K, K, and K. The low- region is seen in more detail in Fig. 2, where the A, B, C points are shown and the order of the FM-FS phase transition changes from second to first order around the critical end-point C. The curve has a maximum at kbar and K. These results account well for the main features of the experimental behavior [4], including the claimed change in the order of the FM-FS phase transition at relatively high . Within the present model the N-FM transition is of second order up to . Moreover, if the experiments are reliable in their indication of a first order N-FM transition at much lower values, the theory can accommodate this by a change of sign of , leading to a new tricritical point located at a distinct on the N-FM transition line. Since a direct N-FS phase transition of first order is predicted in accord with conclusions from de Haas–van Alphen experiments [17] and some theoretical studies [18]. Such a transition may not occur in other cases where . In SFT () the diagram topology remains the same but points B and C are slightly shifted to higher (typically by about 1 bar).
The experimental data [1, 2, 3] for UGe2 indicate K, GPa ( kbar), K, GPa, and GPa. Using again the variant for and the above values for and we obtain and . The temperature K corresponds to . Using these, together with , leads to the diagram in Fig. 3, showing only the low- region of interest. We obtain K, K, K, GPa, GPa, and GPa. There is agreement with the main experimental findings, although corresponding to the maximum (found at GPa in Fig. 3) is about 0.3 GPa higher than suggested experimentally. If the experimental plots are accurate in this respect, this difference may be attributable to the so-called () meta-magnetic phase transition in UGe2, which is related to an abrupt change of the magnetization in the vicinity of . Thus, one may suppose that the meta-magnetic effects, which are outside the scope of our current model, significantly affect the shape of the curve by lowering (along with and ). It is possible to achieve a lower value (while leaving unchanged), but this has the undesirable effect of modifying to a value that disagrees with experiment. In SFT the multi-critical points are located at slightly higher (by about 0.01 GPa), as for ZrZn2.
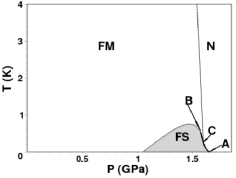
The estimates for UGe2 imply , so the condition for to have a maximum found from Eq. (4) is satisfied. As we discussed for ZrZn2, the location of this maximum can be hard to fix accurately in experiments. However, can be more easily distinguished, as in the UGe2 case. Then we have a well-established quantum (zero-temperature) phase transition of second order, i.e., a quantum critical point [19]. From Eq. (4) the existence of this type of solution in systems with (as UGe2) occurs for . Such systems (which we label as U-type) are essentially different from those such as ZrZn2 where and hence . In this latter case (Zr-type compounds) a maximum may sometimes occur, as discussed earlier. We note that the ratio reflects a balance effect between the two - interactions. When the trigger interaction (typified by ) prevails, the Zr-type behavior is found where superconductivity exists at . The same ratio can be expressed as , which emphasizes that the ground state value of the magnetization at is also relevant. In general, depending on the ratio of the interaction parameters and , the ferromagnetic superconductors with spin-triplet Cooper fermion pairing can be of two types: type I () and type II (). The two types are distinguished in their thermodynamic properties.
The quantum phase transition near is of first order. Depending on the system properties, can be either positive (when a direct N-FS first order transition is possible), zero, or negative (when the FM-FS and N-FM phase transition lines terminate at different zero-temperature phase transition points). The last two cases correspond to . All these cases are possible in Zr- and U-type compounds. The zero temperature transition at is found to be a quantum critical point, whereas the zero-temperature phase transition at is of first order. As noted, the latter splits into two first order phase transitions. This classical picture may be changed through quantum fluctuations [12]. An investigation [20, 21] of the quantum fluctuations and the quantum dimensional crossover by renormalization group methods revealed a fluctuation change in the order of this transition to a continuous phase transition belonging to an entirely new class of universality. However, this option exists only for magnetically isotropic order (Heisenberg symmetry) and is unlikely to apply in the known spin-triplet ferromagnetic superconductors.
Even in its simplified form, this theory has been shown to be capable of accounting for a wide variety of experimental behavior. A natural extension to the theory is to add a term which provides a formalism to investigate possible metamagnetic phase transitions [22] and extend some first order phase transition lines. Another modification of this theory, with regard to applications to other compounds, is to include a dependence for some of the other GL parameters.
Finally, let us emphasize that our results are based on a general thermodynamic analysis in which the surface and bulk phases are treated on the same footing. For this reason, our results do not contradict to experiments [23] showing a lack of bulk superconductivity in ZrZn2 but the occurrence of a surface FS phase at surfaces with higher Zr content than that in ZrZn2.
Acknowledgements: The authors are grateful to A. Harada and S. M. Hayden for valuable communications and discussions of experimental problems. One of us (D.I.U.) thanks the University of Western Ontario for hospitality. NFSR-Sofia (through grant Ph. 1507) and NSERC-Canada are acknowledged for partial support.
References
- [1] S. S. Saxena, P. Agarwal, K. Ahilan, F. M. Grosche, R. K. W. Haselwimmer, M.J. Steiner, E. Pugh, I. R. Walker, S.R. Julian, P. Monthoux, G. G. Lonzarich, A. Huxley, I. Sheikin, D. Braithwaite, and J. Flouquet, Nature 406 (2000) 587.
- [2] N. Tateiwa, T. C. Kobayashi, K. Hanazono, A. Amaya, Y. Haga, R. Settai, and Y. Onuki, J. Phys. Condens. Mat. 13( 2001) L17.
- [3] A. Harada, S. Kawasaki, H. Mukuda, Y. Kitaoka, Y. Haga, E. Yamamoto, Y. Onuki, K. M. Itoh, E. E. Haller, and H. Harima , Phys. Rev. B 75 (2007) 14502 (R).
- [4] C. Pfleiderer, M. Uhlatz, S. M. Hayden, R. Vollmer, H. v. Löhneysen, N. R. Berhoeft, and G. G. Lonzarich, Nature 412 (2001) 58.
- [5] D. Aoki, A. Huxley, E. Ressouche, D. Braithwaite, J. Flouquet, J-P.. Brison, E. Lhotel, and C. Paulsen, Nature 413 (2001) 613.
- [6] N. T. Huy, A. Gasparini, D. E. de Nijs, Y. Huang, J. C. P. Klaasse, T. Gortenmulder, A. Visser, A. Hamann, T. Görlach, and H. v. Löhneysen, Phys. Rev. Lett. 99 (2007) 067006.
- [7] N. T. Huy, D. E. de Nijs, Y. K. Huang, and A. de Visser, Phys. Rev. Lett. 100 (2008) 077001.
- [8] T. Akazawa, H. Hidaka, H. Kotegawa, T. C. Kobayashi, T. Fujiwara, E. Yamamoto, Y. Haga, R. Settai, and Y. Onuki, Physica B 359-361 (2005) 1138.
- [9] T. C. Kobayashi, S. Fukushima, H. Hidaka, H. Kotegawa, T. Akazawa, E. Yamamoto, Y. Haga, R. Settai, and Y. Onuki, Physica B 378-361 (2006) 378.
- [10] K. Machida and T. Ohmi, Phys. Rev. Lett. 86 (2001) 850.
- [11] M. B. Walker and K. V. Samokhin, Phys. Rev. Lett. 88 (2002) 207001.
- [12] D. V. Shopova and D. I. Uzunov, Phys. Lett. A 313 (2003) 139; Bulg. J. Phys. 32 (2005) 81; D. V. Shopova, T. E. Tsvetkov, and D. I. Uzunov, Cond. Matter Phys. 8 (2005) 181.
- [13] D. V. Shopova and D. I. Uzunov, Phys. Rev. B 72 (2005) 024531.
- [14] R. A. Cowley, Adv. Phys. 29 (1980) 1.
- [15] J. Linder, I. B. Sperstad, A. H. Nevidomskyy, M. Cuoco, and A. Sodbo, Phys. Rev. 77 (2008) 184511.
- [16] H. Yamada, Phys. Rev. B 47 (1993) 11211.
- [17] N. Kimura, M. Endo, T. Issiki, S. Minagawa, A. Ochiai, H. Aoki, T. Terashima, S. Uji, T. Matsumoto, and G. G. Lonzarich, Phys. Rev. Lett. 92 (2004) 197002.
- [18] M. Uhlarz, C. Pfleiderer, and S. M. Hayden, Phys. Rev. Lett. 93 (2004) 256404.
- [19] D. V. Shopova and D. I. Uzunov, Phys. Rep. C 379 (2003) 1.
- [20] D. I. Uzunov, Phys. Rev. B74 (2006) 134514.
- [21] D. I. Uzunov, Europhys. Lett. 77 (2007) 20008.
- [22] A. Huxley, I. Sheikin, and D. Braithwaite, Physica B 284-288 (2000) 1277.
- [23] E. A. Yelland, S. M. Hayden, S. J. C. Yates, C. Pfleiderer, M. Uhlarz, R. Vollmer, H. v Löhneysen, N. R. Bernhoeft, R. P. Smith, S. S. Saxena, and N. Kimura, Phys. Rev. B 72 (2005) 214523.