Kondo Effect and Spin Glass Behavior of Dilute Iron Clusters in Silver Studied by Mössbauer Spectroscopy and Resistivity
Abstract
Thin films of silver containing have been prepared by vapor co-deposition. Depending on substrate temperature and iron concentration we could systematically follow the formation of nanometer size clusters of iron from initially dilute iron monomers. samples were characterized via -ray diffraction, resistivity and Mössbauer spectroscopic measurements.
The magnetic behavior derived from Mössbauer data can be best described with an ensemble of ferromagnetic mono-domain particles. The magnetic freezing observed at low temperatures, is controlled via the inter-particle interactions mediated via conduction electron polarization, i.e. interaction.
The interaction of the cluster magnetic moments with the conduction electron sea is best quantified by the electrical resistivity data. For all studied concentrations we find a non-monotonic variation with temperature which can be understood by competing shielding of the cluster moments by conduction electron spin scattering due to Kondo effect and the magnetic coupling.
I Introduction
In the past precipitates in noble metals have been studied following various tracks of preparation. Mostly precipitates are formed from concentrated solid solutions under thermal treatment. Less common is starting out from very dilute Fe impurities embedded in the metal host and subsequent annealing leading to diffusion of impurities and clustering. For characterizing the electronic state of Fe in these precipitates and its magnetic properties Mössbauer spectroscopy is a highly suitable method.
Of particular interest are systems with very low miscibility in solid and liquid state, like e.g. :. Even very dilute alloys with low concentration of in may only be achieved via non-equilibrium preparation, i.e. vapor depositionmorales1 ; larica ; elisa , electron-beam co-evaporationpeng , mechanical alloyinggomez or implantationlongworth ; marest . Well known are the early Mössbauer spectroscopic studies of ppm concentrations of in prepared via diffusion of into the host matrix with the radioactive decay of leading to steiner .
Morales et al morales1 succeeded in preparing films in the range of percent concentration of in by evaporating the elements in proper proportion and co-depositing them onto Kapton substrates kept at 16 . From the Mössbauer spectra isolated monomeric and dimeric in the matrix could be clearly identified as major components. In addition minor contribution was found which was attributed to clusters of fcc iron.
Upon annealing at room temperature the formation of clusters is enhanced, but only for annealing around 480 bcc precipitates are formed. An identification of the various species is possible from their distinctly different hyperfine parameters.
II Experimental
In continuation of these studies we prepared films by co-deposition of and with nominal concentrations between 0.3 and 1.5 of . We have characterized the samples by X-ray diffraction, Mössbauer spectroscopy and electrical resistivity measurements. In order to receive a sufficient amount of for performing Mössbauer experiments we used iron metal enriched to % of . The preparation procedure and the evaporation facility were the same as described in refs. morales1 ; larica ; elisa . The base vacuum pressure in the deposition chamber was , increasing to during deposition. The films were deposited onto Kapton foils kept either at 285 or 85 . The deposition rate was monitored using piezo-crystals and typical values were 4 Å for and 0.02 Å for (see table 1). The total film thicknesses were typically 1000 to 4000 . Under these preparation conditions we expected clusters to be formed directly during the deposition process and not only after annealing.
First sets of Mössbauer experiments were performed in situ, i.e. in the cryostat where the preparation was done. The spectrometer was of standard type with sinusoidal velocity sweep. The source was kept at room temperature. It turned out that the films could be transferred to a variable temperature cryostat () without observing any change of the spectra. So it was possible to perform ex situ experiments without inducing structural changes of the film.
Resistivity measurements were taken between 1.5 and 300 using a standard 4 contacts technique. X-ray diffraction was performed on a Rigaku MiniFlex using and .
| % | (Å) | (Å) | () | () | |
| 0.3 | 0.009 | 4.0 | 285 | 120 | 2886 |
| 0.5 | 0.01 | 3.0 | 285 | 115 | 2076 |
| 0.8 | 0.007 | 1.3 | 285 | 124 | 972 |
| 1.0 | 0.028 | 4.05 | 283 | 117 | 2862 |
| 1.2 | 0.031 | 1.55 | 283 | 120 | 1138 |
| 1.5 | 0.035 | 4.6 | 280 | 130 | 3615 |
| 1.0 | 0.02 | 4.5 | 85 | 124 | 3349 |
| 0.4 | 0.01 | 3.9 | 85 | 140 | 3307 |
| 0.0 | 0.0 | 3.0 | 285 | 140 | 2322 |
III Results and discussion
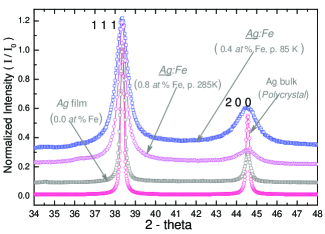
X-ray diffraction of the iron doped films revealed significant broadenings of the silver Bragg peaks indicating the formation of small grains. Using the Scherrer formula we estimate mean grain sizes of about 22 and 11 for films deposited onto 285 and 85 substrates, respectively. All films reveal a high degree of texture (see fig. 1).
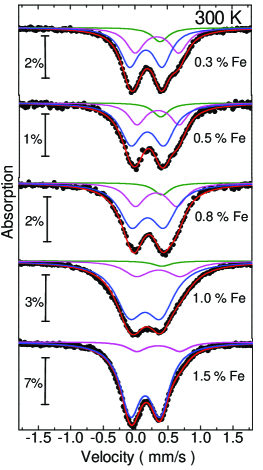
Fig. 2 it shows a series of Mössbauer spectra taken at 300 for various concentrations of iron in films prepared at 285 . Below 1 the spectra are composed by a superposition of three subspectra. One singlet line can be identified as being caused by iron monomersmorales1 ; longworth ; kataoka1 ; pereira ; we observe in addition two quadrupole split doublets which for all concentrations have practically the same hyperfine parameters. In contrast to the earlier samples prepared by vapor quenching onto substrates kept at morales1 , we find no resolved contribution from iron dimers. There is also no indication for the presence of fcc clusters of the type that was found after deposition at low temperatures. We therefore performed a re-analysis of these earlier data and it turned out that they are even better adjusted by the monomer, the dimer and the same two doublet contributions as found for the new samples.
We label these two doublets with and . The hyperfine parameters and the variation of their relative intensities for the three species are shown in figure 3. The relative amount of monomers is continuously decreasing with increasing iron concentration and finally for more than 1 the singlet sub-spectrum can be no more traced and only a superposition of the two quadrupole doublets is found ( fig. 2 ).
Whereas the relative spectral area of is decreasing with increasing iron concentration, the area of is increasing. A close lying possible interpretation for the two doublets would be to attribute them to iron on the surface and from the core of one type of cluster. From the variation of relative areas with concentration one then would have to relate to the surface and to the core which however would imply cluster sizes in the micrometer range. This definitively can be excluded since such clusters should have fcc or bcc structure and reveal magnetic blocking in the 100 range or even higher what is not observed (see below).
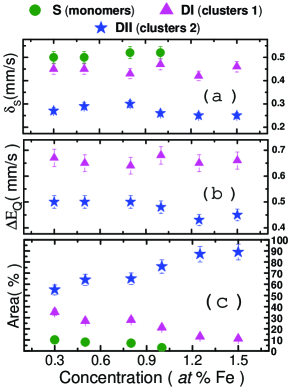
We attribute the two doublets to clusters in the nanometer range, with representing smaller and bigger clusters. has the higher isomer shift rather close to the value of the monomer and a big quadrupole splitting indicative for a low symmetry surrounding. The isomer shift for is smaller meaning that the number of iron neighbors is higher; the quadrupole splitting is smaller, i.e. coming closer to a cubic arrangement. Such clusters are supposed not to fit into the fcc lattice of silver and should appear at grain boundaries especially in view of the small grain structure of our films.
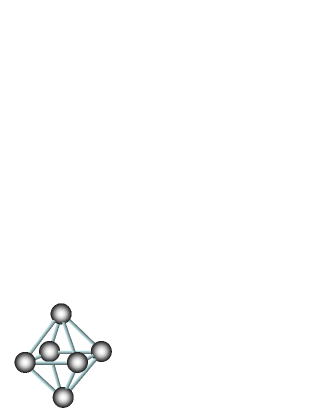
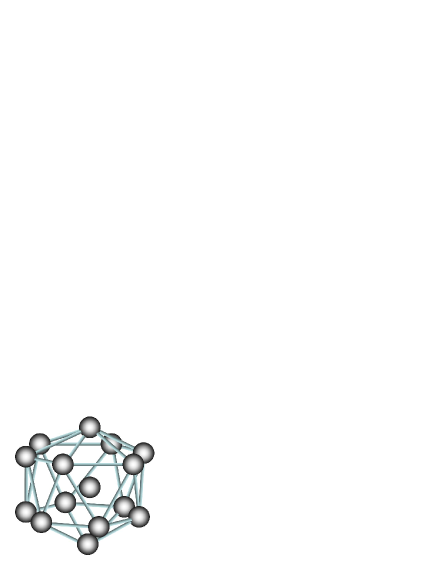
As tentative model one could consider some stable free iron clusters as proposed from theoretical calculations by Rollman et alRollmann , e.g. clusters and (to see fig. 4). Note that these clusters are so small that practically all iron atoms are on surfaces and the spectral contribution from the core of the particles is zero or negligible.
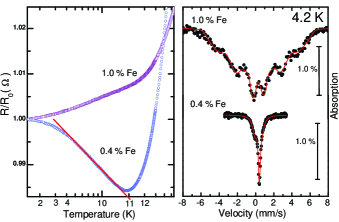
For temperatures below about 15 we find an onset of magnetic hyperfine interaction connected with the freezing of the magnetic moments of the clusters. The spectra taken at 4.2 are shown in fig. 5.
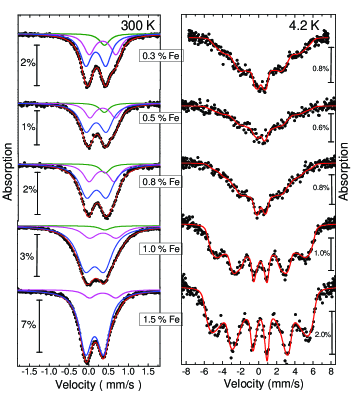
It is clearly seen that there is a distribution of the magnetic hyperfine interaction which becomes better defined with increasing iron concentration, i.e. with larger number of clusters. The drawn lines through the data points of the spectra are simplistic fits using a distribution of hyperfine fields. For the present discussion it may suffice to notice the onset of magnetic interaction. A more detailed interpretation of these patterns (e.g. taking into account the role played by magnetic fluctuations, cluster-cluster interactions etc.) will be presented elsewhere together with susceptibility, magnetization and Mössbauer measurements in applied magnetic field over a wide temperature range. These data yield further support for small clusters with moments on the order of about .
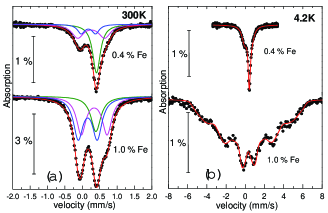
The room temperature spectra of the samples prepared at 85 reveal the same three species , and , yet with a clearly higher contribution by the monomer (see fig. 6). At 4.2 the sample with 1.0 % shows a magnetic hyperfine pattern which however indicates a lower degree of freezing than found for the sample prepared at 285 . For the sample with 0.4 % there is still no indication of a magnetic hyperfine interaction (fig. 6) at 4.2 .
When comparing the freezing behaviour one has to take into account that the concentration of clusters in the samples prepared at 295 (with dominant bigger clusters) is in fact lower than in the samples prepared at 85 , so their distances are larger than those between the isolated monomers for the same nominal concentration of iron. Their interaction however, is increased due to the augmented moment of each cluster and one can thus understand the stronger tendency for freezing with increasing concentration despite longer distances between clusters. Using a RKKY model adopted for clustersAltbir with the known Fermi surface vectors of silver and ferromagnetic cluster moments with about 40 we arrive for our concentrations at average cluster-cluster interaction energies corresponding to . This is in agreement with the freezing temperatures derived from the Mössbauer data.
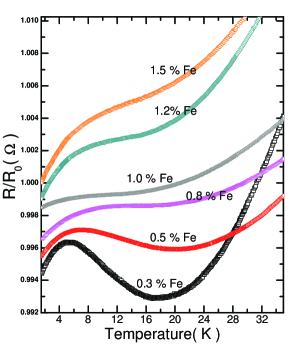
The resistivity results for the samples prepared at 285 and 85 are shown in the Fig. 7 and Fig. 8, respectively. For low iron concentrations we find clear minima in the temperature dependence of the resistivity (typically around 20 ) followed by maxima at lower temperatures. The minima are indicative for the onset of Kondo effect. The typical logarithmic increase of resistivity with decreasing temperature may most clearly be traced for the samples with low concentrations, i.e. with a high number of monomers. Saturation is only achieved below about 2 which is in agreement with earlier data obtained by Mössbauersteiner , TDPAC riegel1 ; riegel2 and susceptibility hanson measurements on monomers in bulk silver where Kondo temperatures of about were found.
Actually an increased value was derived from TDPAC mishra for dilute iron impurities in nanocrystalline silver. This discrepancy of found between bulk and nanocrystalline silver was attributed to a pressure induced increased hybridization of iron electrons with the conduction electrons near the grain surfaces crepieux ; crepieux2 . The silver grain size of 19 is actually nearly the same as found for our samples prepared at 285 with grain sizes of about 22 , however, our data do not support an increase of Kondo temperature.
The mentioned resistivity maxima are observed for samples containing a higher amount of clusters and also revealing spin freezing from Mössbauer effect. The decrease of resistivity for temperatures below the maxima is related to the onset of the magnetic interaction between the clusters. It is getting clearly stronger with increasing concentration of iron, i.e. also with number of clusters. The shape of the resistivity curves are in very good qualitative agreement with the calculations of Larsen larsen and more recently by Vavilov et al vavilov predicting a non monotonic variation of resistivity with temperature when in concentrated systems the RKKY interaction between magnetic impurities is strong compared to the Kondo interaction. Similar observations have been reported, e.g., for and matrices doped with and impurities, there however at much lower concentrationsschilling . For concentrations above about 1 the resistivity minimum can no more clearly be traced in our data and only the turn-down of resistivity due to the magnetic freezing is visible. Despite the temperature where the maximum of resistivity occurs does not directly correspond to the spin glass temperatures as derived e.g. from the susceptibility cusp (see refs. larsen ; schilling ), we plot this temperature in fig. 9 for demonstrating the concentration dependence of spin freezing. The values were obtained from the first derivative for 0.3, 0.5 and 0.8 % and from the second derivate for 1.0, 1.2 and 1.5 %. A straight line in fig. 9 indicates the the temperature at which the Mössbauer measurements were taken. This illustrates why the spectra for 1.0 % are not static since the freezing is very close to 4.2 .
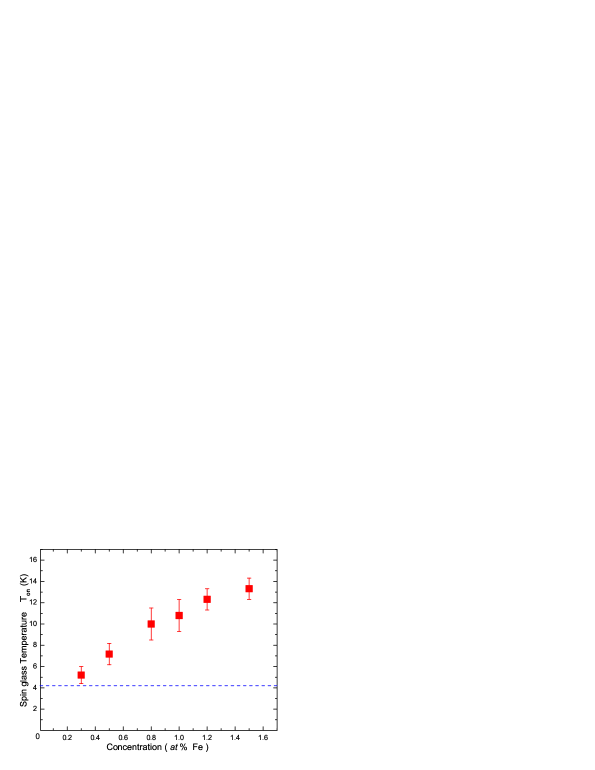
For the higher concentrations we take the temperatures where the downturn of resistivity from the phonon contribution becomes apparent. These values between about 5 and 15 K are again in fair agreement with the observed onset of magnetic hyperfine interaction from the Mössbauer data for these concentrations. The disappearance of the Kondo minimum occurs in parallel to the vanishing of the monomer contribution in the Mössbauer spectra and also of the clusters of type . There is no clear indication for Kondo scattering when clusters of type become dominant. We therefore have to conclude that the Kondo anomalies observed in the resistivity data are mainly caused by contributions from monomeric iron and eventually of clusters . In any case the Kondo temperatures for samples with iron concentrations above about 1 % must to be below about 3 .
IV Conclusions
In summary we have observed the formation of well defined nano-sized iron clusters in silver films prepared by co-deposition from iron and silver atomic beams under varying conditions and for a series of concentrations. Resistivity data give clear evidence for Kondo effect for samples containing monomeric iron impurities and clusters of type but not for clusters of type , i.e for iron concentrations up to about 1 %. Samples containing clusters reveal the typical non-monotonic resistivity behaviour expected for spin glass freezing competing with Kondo effect. The spin glass freezing is clearly visible from the appearance of magnetic hyperfine splitting. The spin glass transition temperature is in good agreement with estimates from a RKKY model for interacting clusters.
ACKNOWLEDGMENTS
Financial support from FAPERJ, CNPQ, CAPEs and DAAD are acknowledged by the authors.
References
- (1) M. A. Morales, E. C. Passamani, E. Baggio-Saitovitch, Phys. Rev. B 66, 144422, (2002).
- (2) C. Larica, E. M. Baggio-Saitovitch, S. K. Xia, J. Magn. Magn. Mater. 110 106-112 (1992)
- (3) E. M. Baggio Saitovitch, J. Terra and F. J. Litterst, Phys. Rev. B 39, 6403 (1989).
- (4) C. Peng, S. Zhang, G. Li, D. Dai, J. Appl. Phys. 76, 998 (1994).
- (5) J. A. Gómez, S.K. Xia, E. C. Passamani, B. Giordanengo and E. M. Baggio-Saitovitch, J. Magn. Magn. Mater., 223 112-118 (2001).
- (6) G. Longworth and R. Jain, J. Phys. F: Met. Phys. 8, 993-1007 (1978)
- (7) G. Marest, H. Jaffrezic, J. Stanek, and H. Bineczycka, Nucl. Instrum. Methods Phys. Res. B 80-81, 357 (1993)
- (8) P. Steiner and S. Hüfner, Phys. Rev. B 12, 842 (1975)
- (9) N. Kataoka, K. Sumiyama and Y. Nakamura, J. Phys. F: Met. Phys. 18, 1049-1056(1988).
- (10) M. M. Pereira de Azevedo et. al., J. Magn. Magn. Mater., 173, 230-240 (1997).
- (11) G. Rollmann, P. Entel, S. Sahoo, Comp. Mat. Sci. 35, 275 (2006)
- (12) D. Altbir, J. d’Albuquerque e Castro, P. Vargas, Phys. Rev. B 54, R6823 (1996)
- (13) D. Riegel, L. Büermann, K. D. Gross, M. Luszik-Bhadra, and S. N. Mishra, Phys. Rev. Lett. 61, 2129 - 2132 (1988).
- (14) D. Riegel, L. Büermann, K. D. Gross, M. Luszik-Bhadra, and S. N. Mishra, Phys. Rev. Lett. 62, 316 (1989).
- (15) M. Hanson, J. Phys. F: Met. Phys. 7, 2555 (1977)
- (16) S.N. Mishra, P. Taneja, P. Ayyub, A. A. Tulapurkar, Phys. B, 312-313, 162-164 (2002).
- (17) A. Crépieux and C. Lacroix, Phyisica B 259-261, 204-205 (1999).
- (18) A. Crépieux and C. Lacroix, Phys. Rev. B 59, 13824 (1999).
- (19) U. Larsen, Phys. Rev. B 14, 4356 (1976)
- (20) M. G. Vavilov, L.I. Glazman, and A.I. Larkin, Phys. Rev. B 68, 075119 (2003).
- (21) J. S. Schilling, P. J. Ford, U. Larsen, and J. A. Mydosh, Phys. Rev. B 14, 4368 (1976)