Observations of the Gas Reservoir around a Star Forming Galaxy in the Early Universe
Abstract
We present a high signal-to-noise spectrum of a bright galaxy at = 4.9 in 14 h of integration on VLT FORS2. This galaxy is extremely bright, , and is strongly-lensed by the foreground massive galaxy cluster Abell 1689 (). Stellar continuum is seen longward of the Ly emission line at Å, while intergalactic H I produces strong absorption shortward of Ly. Two transmission spikes at 6800 Å and 7040 Å are also visible, along with other structures at shorter wavelengths. Although fainter than a QSO, the absence of a strong central ultraviolet flux source in this star forming galaxy enables a measurement of the H I flux transmission in the intergalactic medium (IGM) in the vicinity of a high redshift object. We find that the effective H I optical depth of the IGM is remarkably high within a large 14 Mpc (physical) region surrounding the galaxy compared to that seen towards QSOs at similar redshifts. Evidently, this high-redshift galaxy is located in a region of space where the amount of H I is much larger than that seen at similar epochs in the diffuse IGM. We argue that observations of high-redshift galaxies like this one provide unique insights on the nascent stages of baryonic large-scale structures that evolve into the filamentary cosmic web of galaxies and clusters of galaxies observed in the present universe.
Subject headings:
galaxies: clusters: general — galaxies: clusters: individual (A1689)—galaxies: high-redshift—gravitational lensing—techniques: spectroscopic—methods: data analysis1. Introduction
Hydrodynamic simulations tell us that dark matter near the epoch of galaxy formation collapses into an ordered filamentary pattern, the so-called “cosmic web.” In turn, this cosmic web is thought to cradle high-redshift galaxies in dense nodes that are opaque to the extragalactic ultraviolet background radiation. Observations of H I surrounding these high-redshift objects provide information on the likely reservoirs from which galaxies assemble their gas. Hitherto, it has only been possible to measure H I opacities towards bright Quasi-stellar Objects (QSOs); unfortunately, the high ultraviolet flux from the QSOs ionizes the hydrogen clouds in their vicinity, thereby making the determination of H I cloud physical conditions unreliable close to the QSO.
New techniques and facilities in the past decade have enabled detailed observational studies of the IGM in the early universe (). For example, the spectra of high-redshift QSOs show a plethora of H I Ly absorption lines, the “Ly forest”, as well as lines from a wide variety of heavier elements, all of which provide detailed information about the high-redshift IGM along the line-of-sight towards the QSO. Around the QSOs themselves, however, the ultraviolet flux is so high that it typically ionizes the surrounding gas. Thus QSOs are not ideal for studying the pervasive IGM close to the QSO. Instead, we suggest that bright galaxies may provide better probes for the study of IGM conditions in the proximity of high-redshift objects, as these objects emit fewer ultraviolet photons than QSOs do.
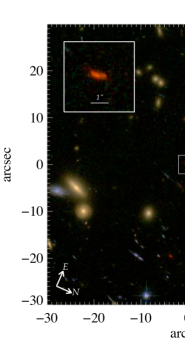
The subject of this paper is the Ly forest in the spectrum of an unusually bright high-redshift galaxy at (Frye et al. 2002, 2007). The galaxy is situated behind the massive galaxy cluster Abell 1689 (), which magnifies the starlight of this background object by a factor of 10.3 by the effect of gravitational lensing (Broadhurst et al. 2005). Multicolor Hubble Space Telescope (HST) imaging of one of the faint lensed images, hereafter designated , is shown in Figure 1. We assume a cosmology for this paper of km s-1 Mpc-1, , and .
2. Observations and Spectrum
Our spectrum of is made possible with present telescopes only by the combination of strong lensing and unusually-long observations. We obtained the spectrum for in 14 hours at the Very Large Telescope (VLT) with the Focal Reducer and low-dispersion Spectrograph (FORS2) in 2001 June and July and report a spectral resolution of 111The observations were made on VLT/Kueyen FORS2 under observing programme 67.A-0618B. We fluxed the data with the standard star LTT9239, and performed the reductions with a code written by the first author in IDL designed to maximize the signal to noise of background-limited objects. See Frye:07 for more details on this purpose-built spectroscopic reduction package.
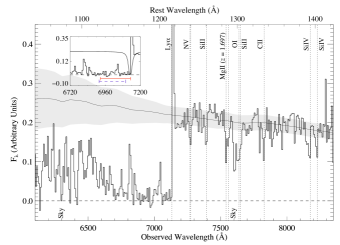
The spectrum of (Figure 2) shows an H I Ly emission line and several strong low- and high-ionization metal absorption lines detected against the stellar continuum. On the basis of a mean velocity difference of = 470 km s-1 between the positional centroids of the metal absorption features and the Ly emission line, we apply an offset correction (Adelberger et al., 2003) and measure a systemic redshift of for the galaxy. Interestingly, Ly absorption immediately shortward of the emission line is not obviously damped at our spectral resolution, with a column density of log [ (cm dex (see Figure 2 inset). At our spectral resolution, the detected absorption lines are strongly-saturated and thus are not suitable for deriving metallicities. The most unusual feature of the spectrum is the broad absorption trough in the Ly forest first appearing at the Ly emission feature and extending towards shorter wavelengths. Although two transmission spikes are visible at 6800 Å and 7040 Å, nearly 100 % of the continuum is absorbed between wavelengths of 6850 - 7100 Å.
What might this absorption represent? It is likely that we are detecting the presence of many more overlapping Ly forest clouds closer to the galaxy than can survive the UV radiation field of QSOs at comparable distances. At the resolution of our data, individual Ly forest lines cannot be resolved, and we would see only the effects of a large number of blended lines. It is also possible that the enhanced absorption could be from only a few overlapping, but very high- clouds, but we might then expect to see more metal absorption lines from these clouds redward of the Lya emission line, which are absent in our data. Even less likely is that this H I overdensity signals the late completion of cosmic reionization, as recent observational studies have set convincing constraints for this epoch at 6.3 (Fan et al. 2006; Songaila 2004).
We explore the nature of this remarkably large absorption trough with a comparison to the Ly absorption seen towards their brighter counterpart objects, the QSOs. QSOs produce radiation fields that ionize hydrogen over large, 16 physical Mpc regions at (Fan et al. 2006) (red solid line in Figure 2 inset). Although evidence has emerged of a softening of this proximity effect in the transverse direction on small scales of Mpc from studies of QSO pairs (Bowen et al. 20006; Tytler et al. 2007). detailed studies of the Lyman-series forest are made routinely only outside the ionizing influence of the QSOs. In contrast, ordinary star forming galaxies have modest proximity zones of size physical Mpc (Adelberger et al., 2003), thereby enabling the study of H I and its structure in the vicinity of deep potential wells where the gas is not ionized. Despite the advantage of a small proximity zone, galaxies suffer from being much fainter in the ultraviolet. Unlike the vast majority of star-forming galaxies, our target is bright because it is strongly-lensed, thereby yielding a spectrum suitable for measuring the transmitted flux in the Ly forest in the proximity of a galaxy.
3. H I Flux Transmission
We calculate the Gunn-Peterson (GP) optical depth (Gunn & Peterson, 1965), , where is the ratio of the average observed flux to the average unabsorbed continuum flux, , and is determined by stellar synthesis models fit to the photometric data. We compute in several redshift bins extending from a wavelength clear of the red wing of Ly up to the blue edge of our model fit to the H I in the source (blue dashed line in Figure 2 inset delimits the extent of the highest redshift bin). Uncertainties in are dominated by the intrinsic scatter of the continuum flux levels due to the stochastic nature of the absorption in the IGM, or sample variance (Tepper-García & Fritze, 2008), but also include continuum placement errors and shot noise. Figure 3 shows the results measured from the spectrum and compares our values for to those observed toward a large sample of QSOs (Fan et al. 2006; Songaila 2004).
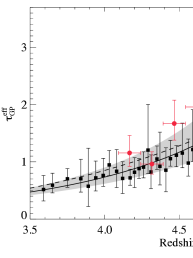
We emphasize that the values for are measured in the same way towards both the QSOs and the galaxy, and after first excluding the proximity zone, thereby yielding information only on the pervasive IGM; that is the IGM immediately outside the photoionizing influence of the source. Assuming to be the same in the standard IGM towards any background object, we would expect to rise steadily towards with absorption redshift following the bulk of the QSO points. Compared to the predictions of a power-law model based on the density distribution (Fan et al. 2006) and a lognormal optical depth distribution (Becker et al. 2007), measurements toward are in good agreement at ; at , however, we see a significant excess in . If the underlying mass distribution were unaltered by the presence of the galaxy, then this highest-redshift point, the one in closest physical proximity of the galaxy, should have also followed the behavior of the other points. The highest redshift point is the most deviant; it corresponds to a physical radius (physical) Mpc, and this result suggests that there is more H I gas close to the galaxy compared to the standard IGM.
4. Population Synthesis Modeling
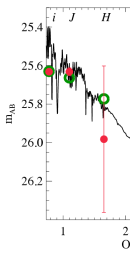
is imaged in several bands, as follows: (HST ACS), (HST NICMOS), and (Son of Isaac Instrument on ESO New Technology Telescope), and , and (IRAC on Spitzer Space Telecope). The observing details for these data are discussed elsewhere (Frye et al. 2007). From these data we set initial constraints on the galaxy age and dust extinction. Our high quality , and points indicate only a modest H I Balmer series continuum break at rest-frame 4000 Å and thus a young underlying stellar population dominated by O stars with a minimum age of Myr (Figure 4). The age of the universe for our adopted cosmology sets the upper limit on the galaxy age of 1.2 Gyr. The dust extinction, as parameterized by the color excess , is fit with a broad range spectral energy distribution templates. From these fits it is found that any model with provides a poor fit to the slope of data, as the continuum becomes significantly flatter in the blue with the addition of even moderate amounts of dust. Thus we restrict our parameter space to .
Model spectral energy distributions are generated using the stellar synthesis code of Bruzual & Charlot (2003). We select a Chabrier initial mass function (Padova 1994), stellar evolution tracks, and solar metallicity. We choose a single starburst model with a range of decay rates and a star formation rate (SFR) that depends exponentially on as follows: with 0.1, 0.2, 0.3, 0.5, 1, and 1.2 Gyr. Continuous star-formation models are also considered, as approximated by selecting to be the age of the universe at , and we do not consider more complicated star formation histories. For each , three parameters remain to be fit to the data: age , , and stellar mass . A suite of models are constructed over the allowable parameter space for these three variables, and each model is corrected for the effects of dust extinction (Calzetti et al., 2000), and attenuation by the intervening Lyman-series forest (Madau, 1995).
We compute synthetic photometry on our models by a convolution of the model spectra with the observed filter bandpass transmission functions. We compare the synthetic photometry with the observed photometric values until the lowest value of reduced is obtained. Figure 4 shows our best fit model to the joint variation of the parameters of dust extinction, age, and mass, with values: , Myr, and . Note that as the exponentially-decaying models are normalized to have a total mass of 1 as , we obtain the mass for by the flux normalization that yields the lowest value for the reduced fit. Our best fit is for a no-dust model. We compute formal uncertainties that represent 68 % uncertainties for our input model. We follow the prescription in Cash (1976) originally developed for use with X-ray spectral data that allows for the joint estimation of confidence intervals.
The best fit synthetic spectrum is also shown in Figure 2 in the main text, but without corrections for dust extinction and absorption by the intervening Ly forest. This intrinsic form is used to define the unabsorbed continuum level for against which the flux transmission of the Ly forest is measured.
5. Discussion
Despite the strong magnification, the intrinsic luminosity of the galaxy is not high; we measure an unabsorbed luminosity of ergs s-1 Hz-1, and an unlensed , two magnitudes fainter than at (Shapley et al., 2001). Galaxies at are faint, and hence only a few high quality spectra exist (Price et al. 2007; Kawai et al. 2006; Dow-Hygelund et al. 2007; Franx et al. 1997). Some of these are at where is expected to be high (from the QSO measurements), but the spectrum of the gamma-ray burst GRB060510B at (Price et al. 2007). shows some similar characteristics to the spectrum of . The IGM transmission measured over a broad redshift bin of the former is , similar to the values observed toward QSOs. However, this broad average smears out the structure in as a function of redshift. The GRB060510B spectrum shows evidence of higher than expected GP optical depth extending beyond the region affected by the damped Ly absorption at the redshift of the GRB host. It would be interesting to reanalyze this GRB spectrum using smaller redshift bins. H I opacities were also measured inside the proximity zones of QSOs; although significantly ionized, the proximity zones are found to have neutral hydrogen fractions that exceed theoretical expectations. This indicates that at least some QSOs are also found in regions of gaseous overdensity with large sizes of Mpc (Guimarães et al., 2007).
Might still be in the process of accreting much of its mass from its overdense surrounding cosmic structure? Theoretical models predict that H I gas is funneled into young galaxies via large-scale filamentary structures (Kereš et al., 2005; Birnboim & Dekel, 2003). We have presented here observational evidence that H I column densities are higher than expected near one high-redshift galaxy. Based on the large physical size implied by the H I excess, it is unlikely that this gas will accrete onto a single galaxy. Alternatively, post-starburst galaxies are known to drive high-velocity outflows with velocities of km s-1 in low-ionization stages such as Mg II (Tremonti et al., 2007). Given sufficient time, the observed excess of H I optical depth could be explained by such an outflow; however is too young by a significant factor given the best fit stellar age of 100 Myr. On the other hand, QSOs are known to drive outflows with terminal velocities in excess of km s-1. does not show obvious signatures of being an AGN, but even if there was a low-metallicity outflow undetected in our spectrum, the velocities would still fall short by more than a factor of ten of that required to explain the H I excess. As more data become available to study the neutral H I absorption towards the several recently discovered strongly-lensed LBGs, it may be found to be typical for high-redshift objects, both galaxies and QSOs, to be located in regions of space with neutral hydrogen gas fractions significantly larger than that of the pervasive IGM. This re-evaluation of the H I structure in the densest regions of the universe at these epochs will provide the necessary calibration for modeling the formation and evolution of galaxies in the early universe.
References
- Adelberger et al. (2003) Adelberger, K. L., Steidel, C. C., Shapley, A. E., & Pettini, M. 2003, ApJ, 584, 45
- Becker et al. (2007) Becker, G. D., Rauch, M., & Sargent, W. L. W. 2007, ApJ, 662, 72
- Birnboim & Dekel (2003) Birnboim, Y., & Dekel, A. 2003, MNRAS, 345, 349
- Bowen et al. (2006) Bowen, D., et al. 2006, ApJ, 645, L105
- Broadhurst et al. (2005) Broadhurst, T., et al. 2005, ApJ, 621, 53
- Bruzual & Charlot (2003) Bruzual, G., & Charlot, S. 2003, MNRAS, 344, 1000
- Calzetti et al. (2000) Calzetti, D., Armus, L., Bohlin, R. C., Kinney, A. L., Koornneef, J., & Storchi-Bergmann, T. 2000, ApJ, 533, 682
- Cash (1976) Cash, W. 1976, A&A, 52, 307
- Dow-Hygelund et al. (2007) Dow-Hygelund, C., et al. 2007, ApJ, 660, 47
- Fan et al. (2006) Fan, et al. 2006, AJ, 132, 117
- Franx et al. (1997) Franx, M., Illingworth, G. D., Kelson, D. D., van Dokkum, P. G., & Tran, K.-V. 1997, ApJ, 486, L75
- Frye et al. (2002) Frye, B., Broadhurst, T., & Benítez, N. 2002, ApJ, 568, 558
- Frye et al. (2007) Frye, B., et al. 2007, ApJ, 665, 921
- Guimarães et al. (2007) Guimarães, R., Petitjean, P., Rollinde, E., de Carvalho, R. R., Djorgovski, S. G., Srianand, R., Aghaee, A., & Castro, S. 2007, MNRAS, 377, 657
- Gunn & Peterson (1965) Gunn, J. E., & Peterson, B. A. 1965, ApJ, 142, 1633
- Kawai et al. (2006) Kawai, K., et al. 2006, Nature, 440, 184
- Kereš et al. (2005) Kereš, D., Katz, N., Weinberg, D. H., & Davé, R. 2005, MNRAS, 363, 2
- Madau (1995) Madau, P. 1995, ApJ, 441, 18
- Price et al. (2007) Price, et al. 2007, ApJ, 663, L57
- Shapley et al. (2001) Shapley, A. E., Steidel, C. C., Adelberger, K. L., Dickinson, M., Giavalisco, M., & Pettini, M. 2001, ApJ, 562, 95
- Songaila (2004) Songaila, A. 2004, AJ, 127, 2598
- Tepper-García & Fritze (2008) Tepper-García, T., & Fritze, U. 2008, MNRAS, 383, 1671
- Tremonti et al. (2007) Tremonti, C. A., Moustakas, J., & Diamond-Stanic, A. M. 2007, ApJ, 663, L77
- Tytler et al. (2007) Tytler, D., et al. 2007, ArXiv e-prints, 0711.2308