Hubble Space Telescope Spectroscopic Observations of the Narrow-Line Region in Nearby Low-Luminosity Active Galactic Nuclei111Based on observations made with the NASA/ESA Hubble Space Telescope, obtained from the Data Archive at the Space Telescope Science Institute, which is operated by the Association of Universities for Research in Astronomy, Inc., under NASA contract NAS 5-26555. These observations are associated with programs GO-7403 and GO-7354.
Abstract
We present Space Telescope Imaging Spectrograph observations of 14 nearby low-luminosity active galactic nuclei, including 13 LINERs and 1 Seyfert, taken at multiple parallel slit positions centered on the galaxy nuclei and covering the H spectral region. For each galaxy, we measure the emission-line velocities, line widths, and strengths, to map out the inner narrow-line region structure, typically within 100 pc from the galaxy nucleus. There is a wide diversity among the velocity fields: in a few galaxies the gas is clearly in disk-like rotation, while in other galaxies the gas kinematics appear chaotic or are dominated by radial flows with multiple velocity components. In most objects, the emission-line surface brightness distribution is very centrally peaked. The [S II] line ratio indicates a radial stratification in gas density, with a sharp increase within the inner 10–20 pc, in the majority of the Type 1 (broad-lined) objects. The electron-density gradients of the Type 1 objects exhibit a similar shape that is well fit by a power law of the form , where . We examine how the [N II] line width varies as a function of aperture size over a range of spatial scales, extending from scales comparable to the black hole’s sphere of influence to scales dominated by the host galaxy’s bulge. For most galaxies in the sample, we find that the emission-line velocity dispersion is largest within the black hole’s gravitational sphere of influence, and decreases with increasing aperture size toward values similar to the bulge stellar velocity dispersion measured within ground-based apertures. We construct models of gas disks in circular rotation and show that this behavior can be consistent with virial motion, although for some combinations of disk parameters we show that the line width can increase as a function of aperture size, as observed in NGC 3245. Future dynamical modeling in order to determine black hole masses for a few objects in this sample may be worthwhile, although disorganized motion will limit the accuracy of the mass measurements.
Subject headings:
galaxies: active – galaxies: bulges – galaxies: kinematics and dynamics – galaxies: nuclei1. Introduction
With its 01 resolution, the Space Telescope Imaging Spectrograph (STIS) aboard the Hubble Space Telescope (HST) has provided the exceptional ability to spatially resolve gas kinematics within the gravitational sphere of influence of the putative central black hole in nearby galaxies. Resolving the gas kinematics very close to the black hole allows for the determination of black hole mass in a relatively straightforward manner, provided that the gas is in Keplerian rotation in a thin, disk-like structure. STIS has thus had a major impact on the field of supermassive black hole detection in galactic nuclei, and data from STIS have contributed greatly toward establishing the correlations between black hole mass and host-galaxy properties, such as those with the stellar velocity dispersion (Ferrarese & Merritt, 2000; Gebhardt et al., 2000; Tremaine et al., 2002) and bulge luminosity (Kormendy & Gebhardt, 2001).
More recently, ground-based integral field unit (IFU) observations have provided two-dimensional (2D) kinematic information on the ionized gas in galaxy centers (Sarzi et al., 2006; Dumas et al., 2007). Additionally, ground-based IFU observations with the assistance of adaptive optics have produced gas dynamical black hole mass measurements (Hicks & Malkan, 2007; Neumayer et al., 2007). Without the use of adaptive optics, however, ground-based observations are usually unable to resolve scales comparable to the black hole radius of influence in nearby galaxies. Although STIS is a long-slit instrument, 2D information similar to IFU data can be obtained with STIS by using multiple slit positions.
Even with the past decade of high-resolution observations, only about 30 dynamical black hole mass measurements have been made (Ferrarese & Ford, 2005). Consequently, searching for regular gas velocity fields dominated by gravitational motion is essential for extending the number of black hole mass measurements and further establishing the connections between black holes and host galaxies. While searching for regular gas velocity fields is clearly important, it appears, however, that they are fairly rare. Instead, complicated and chaotic emission-line velocity fields are more commonly found near the centers of galaxies (Ho et al., 2002; Atkinson et al., 2005). Although only upper limits on the black hole mass can be estimated using gas dynamical modeling in these situations (Sarzi et al., 2002), subarcsecond-resolution observations can still be useful for studying the dynamical state of the gas and searching for radial motions that might be related to active galactic nucleus (AGN) fueling or outflows. Modeling AGN outflows on subarcsecond scales (Capetti et al., 1996; Crenshaw & Kraemer, 2000) is important for furthering our understanding of the connection between AGN feedback and host-galaxy properties. Of particular interest are the connection to star formation, the growth of the supermassive black hole, and how gas may be driven out from the host galaxy as predicted in some feedback scenarios (Springel et al., 2005; Hopkins et al., 2006; Sijacki et al., 2007).
Moreover, the narrow-line region (NLR) velocity dispersion (), often measured from the width of the [O III] line, may provide a reasonable estimate of the host-galaxy stellar velocity dispersion (), albeit with substantial scatter (Nelson & Whittle, 1996; Greene & Ho, 2005). Detailed NLR studies are essential in understanding the origin of the scatter in the – relationship. This relationship can be useful for distant and luminous AGNs where measurement of the stellar velocity dispersion is not feasible (Salviander et al., 2007; Shields et al., 2003). Using the narrow emission-line widths as a proxy for stellar velocity dispersion is only meaningful if the NLR gas is dominated by virial motion in the host-galaxy bulge and not by the gravitational influence of the black hole or nongravitational motions. Therefore, outflows and similar nongravitational motions, which can disrupt viral motion, are one potential cause of the scatter in the – relationship.
While nongravitational motions are clearly important in setting the narrow-line widths in AGNs with strong outflows, there can be an important contribution to the line widths from nongravitational motion even in objects that are not outflow-dominated. From HST STIS observations, Verdoes Kleijn et al. (2006) found that circumnuclear gas in Fanaroff-Riley 1 radio galaxies typically has an intrinsic velocity dispersion in excess of that expected from purely gravitational motion in the host-galaxy potential. They concluded that this excess line width is driven by the injection of energy by the AGN, although there was no obvious relationship between the AGN radiative luminosity and the magnitude of the nongravitational line dispersion.
Other origins for the scatter were studied by Greene & Ho (2005) using a large sample of Sloan Digital Sky Survey (SDSS) type 2 AGNs. They looked for correlations of nuclear properties (radio power, AGN luminosity, Eddington ratio), as well as global properties (host-galaxy morphology, local environment, star-formation rate), with the excess line width, defined to be the difference between the dispersion of the [O III] line and the stellar velocity dispersion. They found a strong correlation between the excess line width and Eddington ratio, where larger excess line widths, indicative of outflowing gas, were seen in the higher Eddington ratio objects.
Another potential explanation for the scatter in the – relationship is the effect of observational aperture size. Rice et al. (2006) investigated the relationship between line width and aperture size in a sample of nearby Seyferts using single-slit STIS observations. They found a wide range of behavior in how the widths of the [O III] and [S II] 6716, 6731 lines varied as a function of radius, but the most common trends were either a roughly constant width or an increase in width with increasing aperture size. Their analysis showed that the line widths measured within the largest STIS aperture were systematically smaller by 10%–20% than both the stellar velocity dispersion and the line widths measured within a ground-based sized aperture. They concluded that the smaller line width measured within the randomly oriented STIS slit is the result of sampling a smaller portion of the velocity field than the larger ground-based aperture.
Beyond the – relationship, we can address other open questions concerning low-luminosity AGNs. Laor (2003) pointed out that while the NLR in luminous AGNs occurs on scales of tens of parsecs, where its dynamics are dominated by the bulge, the NLR in low-luminosity AGNs is more compact, and its dynamics could be dominated by the black hole. It is therefore interesting to ask whether the narrow-line widths in low-luminosity AGNs are set by the black hole or by the bulge potential.
The NLR emission lines also provide information on ionization mechanisms. Spectra of low-ionization nuclear emission-line regions (LINERs; Heckman, 1980) can be reproduced with photoionization models involving a nonstellar continuum and low ionization parameters (Ferland & Netzer, 1983; Halpern & Steiner, 1983), but high electron densities, as well as a large range of densities, are needed in order to reproduce the strength of the [O III] line (Filippenko & Halpern, 1984; Filippenko, 1985; Ho et al., 1993). Filippenko & Halpern (1984) demonstrated that such conditions exist in the LINER NGC 7213, and that there is a correlation between line width and the critical density for collisional deexcitation. A similar relationship between line width and ionization potential was also previously seen in Seyferts (Pelat et al., 1981). This implied that the NLR is not a homogeneous environment, but must have radial gradients in velocity and density. In ground-based spectra these spatial gradients were generally unresolved, but using STIS it is possible to directly resolve the density gradients in the inner NLR (Barth et al., 2001a; Shields et al., 2007). It is therefore of interest to determine what fraction of LINERs show spatially resolved density gradients, and whether the type 2 LINERs, where a central photoionizing source is not always seen, exhibit density gradients.
In this paper, we present multislit HST STIS observations of 14 low-luminosity AGNs, including 13 LINERs and 1 Seyfert. We use the high spatial resolution of STIS to map out the 2D kinematic structure of the NLR within the inner pc, and search for velocity fields that show signs of regular rotation for which gas dynamical modeling may be performed. The subarcsecond resolution STIS data also allow us to detect electron-density gradients through the [S II] line ratio diagnostic. Finally, we examine how the [N II] line width varies as a function of aperture size over spatial scales ranging from those comparable to the black hole sphere of influence to scales dominated by the bulge.
2. Observations and Data Reduction
Our goal is to examine the NLR of low-luminosity AGNs through STIS spectra of the H spectral region at multiple slit positions. Eight galaxies observed under program GO-7354 (PI Dressel) fit this description, and we retrieved those from the HST archive. We combined these eight galaxies with six galaxies that were observed as part of our own program, GO-7403, to arrive at a sample of 14 galaxies. Program GO-7354 was originally designed to study LINER nuclei with compact, flat-spectrum radio cores, while the observations under program GO-7403 focused on obtaining black hole masses in a sample of low-luminosity broad-lined AGNs. All of the galaxies are optically classified as LINERs except NGC 3227, which contains a Seyfert 1 nucleus, and NGC 3245, which is a transition object. Properties of all 14 galaxies in the sample are given in Table Hubble Space Telescope Spectroscopic Observations of the Narrow-Line Region in Nearby Low-Luminosity Active Galactic Nuclei111Based on observations made with the NASA/ESA Hubble Space Telescope, obtained from the Data Archive at the Space Telescope Science Institute, which is operated by the Association of Universities for Research in Astronomy, Inc., under NASA contract NAS 5-26555. These observations are associated with programs GO-7403 and GO-7354. and details of the observations are presented in Table 2.
With the exception of NGC 3998, NGC 4594, and NGC 6500, all of the galaxies from program GO-7354 were observed with the STIS 52x0.1 aperture with no gap between the three adjacent slit positions. NGC 3998, NGC 4594, and NGC 6500 were observed with the same 52x0.1 aperture, but consist of five slit positions, again with no gap between neighboring slit positions. The CCD was read out with binning by two along the dispersion axis, creating a scale of pixel-1 along the spatial axis and Å pixel-1 along the dispersion axis. The slit position angle was constrained to be within 15∘ of the major axis of the gaseous disk. The G750M grating provided coverage of 6490–7050 Å, which included the [N II] 6548, 6583, H, and [S II] 6716, 6731 lines. For this program, a typical exposure time per position was s.
Observations of the six galaxies under program GO-7403 were obtained with the STIS 52x0.2 and a spacing of between adjacent slits (i.e., a gap of between slits). Two of these galaxies, NGC 1052 and NGC 3227, were observed with seven parallel slit positions, while NGC 3245, NGC 4036, NGC 4278, and NGC 4579 were observed with five slit positions. For these galaxies, the CCD was read out in unbinned mode, and the slit position angle was left unconstrained. With this setting the 2D spectral image has a scale of pixel-1 along the slit and Å pixel-1 along the dispersion direction. The G750M grating was used to cover 6300–6860 Å, which included the H[N II], [S II] 6716, 6731, and [O I] 6300, 6364 emission lines. A typical exposure time per position was s. The combination of longer exposure times and the use of a wider slit made it possible to map out the NLR to larger radii and at higher signal-to-noise ratio (S/N) than for program GO-7354.
The data for all 14 galaxies were reduced using the standard STScI pipeline. Dark and bias subtraction, as well as flat-field corrections, were performed, along with the rejection of cosmic-ray events through the combination of multiple subexposures. The data were wavelength and flux calibrated and rectified for geometric distortions. Occasionally a number of hot pixels remained even after the data were run through the pipeline. In those cases, we performed an additional cleaning step by replacing the bad pixel with a local mean value in the flattened data, and then applied the geometric distortion correction to the cleaned images.
In addition to the STIS observations, we obtained Wide Field Planetary Camera 2 (WFPC2) images from the archives in order to examine the nuclear morphology. When available, we retrieved the images from the WFPC2 Associations web site 111http://archive.stsci.edu/hst/wfpc2/search.html .. Otherwise, they were retrieved from the HST archive. In order to remove cosmic rays, “CR-split” observations were combined using the IRAF combine task. If only single exposures were available, they were cleaned using the LA-COSMIC task (van Dokkum, 2001).
Black hole mass measurements have been previously made for three of the galaxies in the sample: NGC 3245 (Barth et al., 2001b), NGC 3998 (de Francesco et al., 2006), and NGC 5077 (de Francesco et al., 2008). In addition, de Francesco et al. (2008) presented velocity curves for NGC 6500 and IC 989; however, both velocity fields were too complex to model the gas as a thin circularly rotating disk, so no black hole masses were determined for these two galaxies.
3. Measurement of Emission Lines
Spectra were extracted from individual rows of the geometrically rectified 2D images, and the rows were extracted as far out as emission lines were detectable. For the eight galaxies from program GO-7354, the emission lines were typically detectable out to about from the slit center, and for the six galaxies from program GO-7403, emission lines were measured out to about . Before any fitting was performed, the continuum was removed from the spectrum on a row-by-row basis by fitting a straight line to the continuum regions covering – Å, – Å, and – Å. This continuum fit was then subtracted from the spectrum. In general, a straight line is not a very good continuum model near H, but given the low S/N in the continuum at most positions, the small wavelength range, and the AGN dominance in the nuclei of some objects, a proper starlight subtraction could not be performed. During the emission-line fitting process, multiple rows that contained weak emission lines far from the slit center were binned together to improve the S/N.
In order to obtain the emission-line velocity, velocity dispersion, and flux, we fit each spectrum with a set of Gaussians, where the fit was carried out row-by-row with a Levenberg-Marquardt least-squares minimization technique using C. Markwardt’s “MPFIT” library in IDL222http://cow.physics.wisc.edu/craigm/idl/idl.html .. Single Gaussians were simultaneously fit to all the emission lines present in the spectra that were strong enough to be fit accurately. The fluxes of the [N II] 6548, 6583 lines were held at a 3:1 ratio, and all lines were required to have a common velocity. The [N II] lines were constrained to have equal velocity widths. The widths of the [S II] lines were also required to be the same, which was necessary due to the lower S/N in the off-nuclear rows. Although the widths of the two [S II] lines can differ, the effect is small (Filippenko & Halpern, 1984; Filippenko & Sargent, 1988). If present, the [O I] line widths were constrained to be equal.
Whenever this basic model did not return adequate fits due to either low S/N or to severe blending between the [N II] and H lines, we applied further constraints, such as tying together the H and [N II] widths, or linking the H, [N II], and [S II] widths. Additionally, some spectra appeared to contain two kinematically separate components at some locations. In these instances, we fit two Gaussians to each of the H, [N II] 6548, 6583, [S II] 6716, 6731, and the [O I] lines. We fit a single Gaussian to the [O I] line, and sometimes to the [O I] line, in place of two Gaussians since often these lines were too weak to constrain a multiple-component model. Each set of Gaussians in the multiple-velocity component model was constrained in the manner previously described above for the basic model.
Near the nuclear regions, several galaxies in the sample exhibited a broad H component in addition to the narrow lines of H and [N II] 6548, 6583. For these regions, an additional component in the form of either a single or a double Gaussian was added to the fit. If the broad component could not be adequately fit by two Gaussians, we selected points along the broad base of the H line and fit a cubic spline to trace the shape of the broad component. This was then subtracted from the spectrum, leaving just the narrow emission lines. A cubic-spline model was needed for several rows while fitting the broad component in NGC 3227, NGC 4278, and NGC 4579. We judged the effectiveness of an additional H broad component both by eye and by comparing the reduced , where if the reduced was improved by or more, we accepted the broad-component fit. Figure 1 shows examples of fits with single or double narrow-line components and with a broad H component.
From the model fits, we obtained the velocity, velocity dispersion, and flux for the [N II] emission line. In calculating the velocity dispersion, we accounted for the instrumental line width by using observations of the STIS wavelength calibration lamp. Gaussian models were fit to the emission-line profiles of extracted calibration-lamp spectra. The variation in line width as a function of wavelength was insignificant across the spectrum and as a result, we used the average value from measurements of several lines. The instrumental velocity dispersion was km s-1 for program GO-7403 and km s-1 for program GO-7354. These instrumental line widths were then subtracted in quadrature from the observed line widths.
4. Results
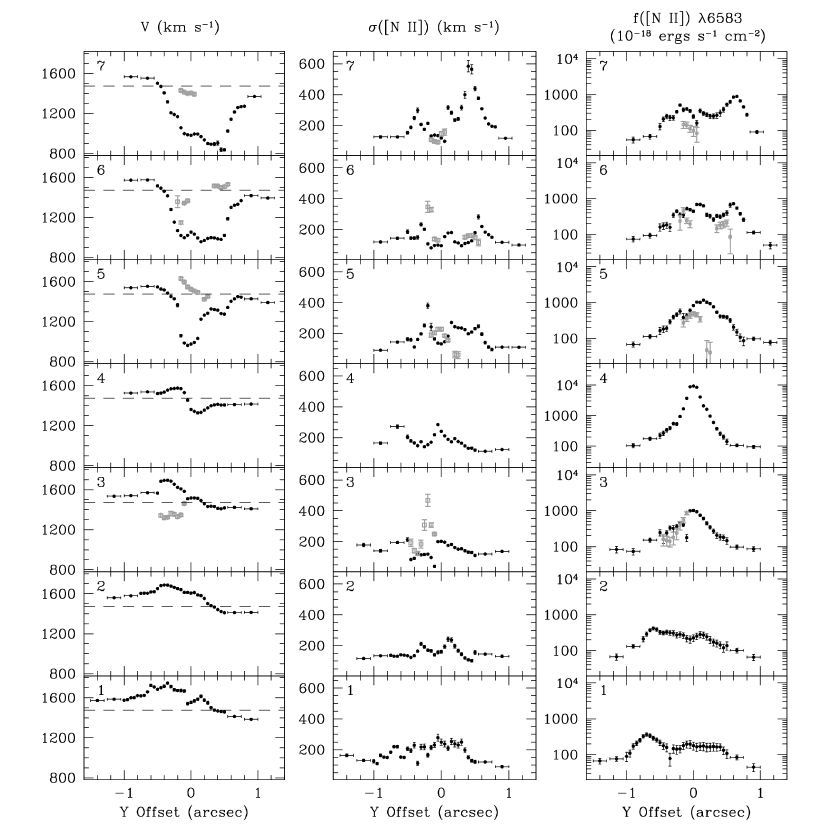
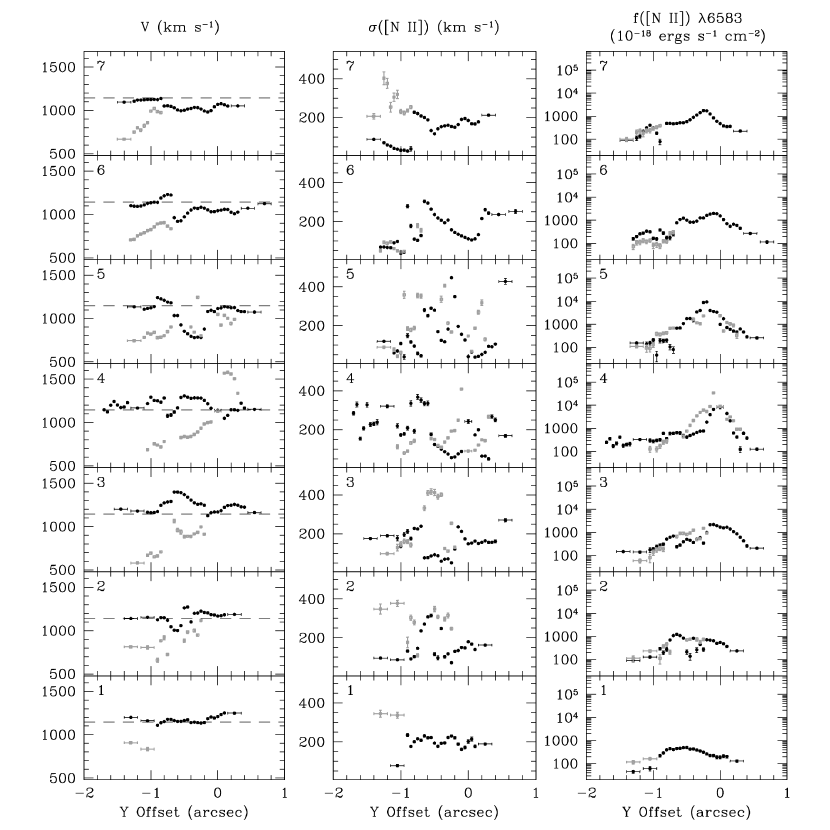
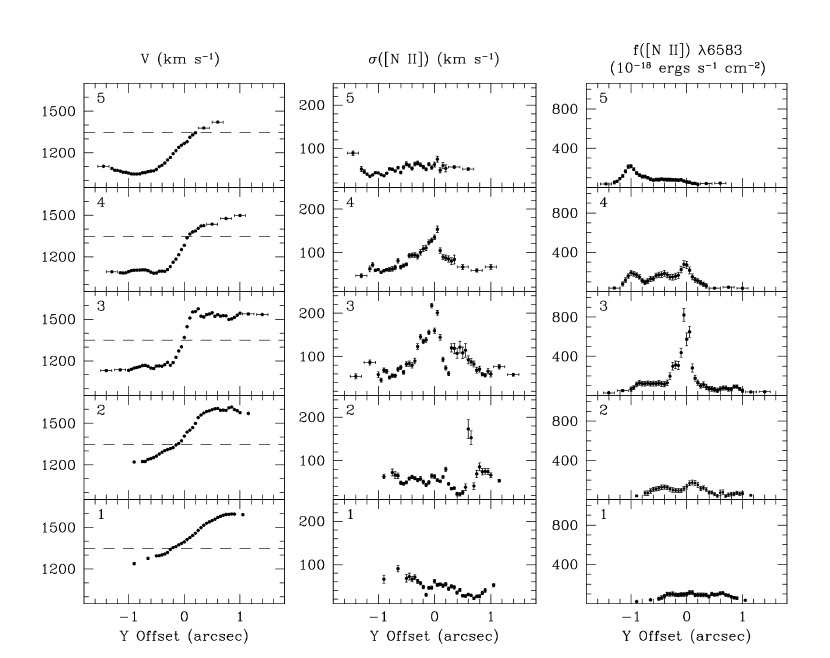
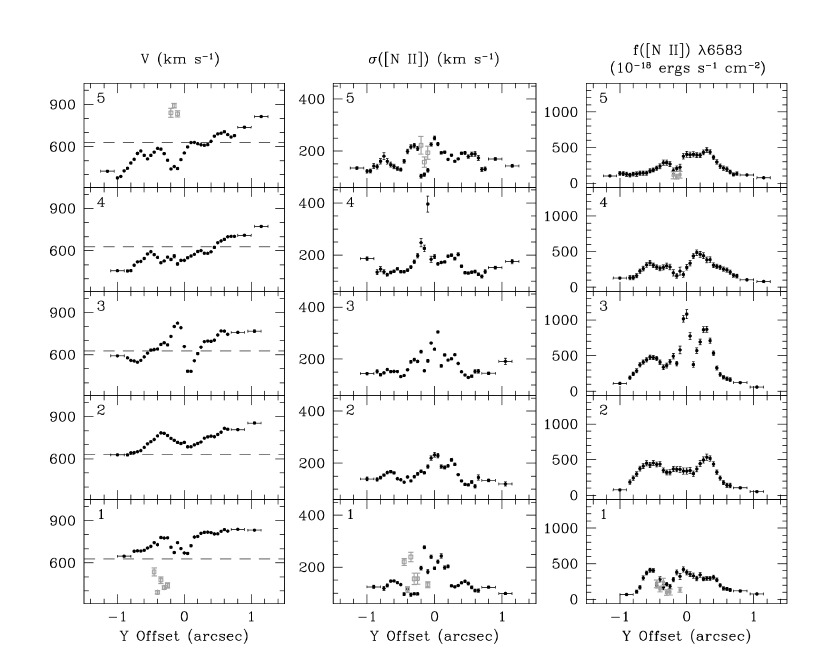
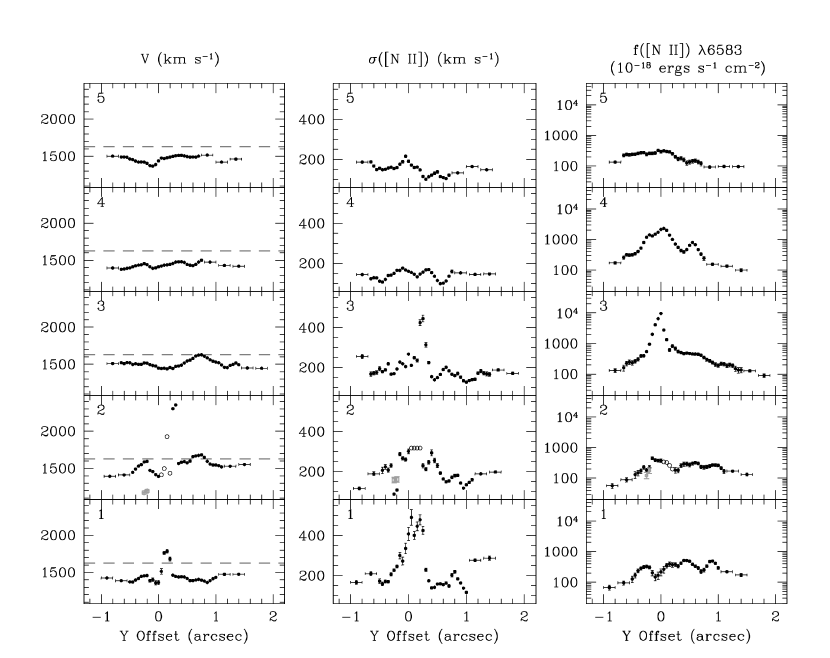
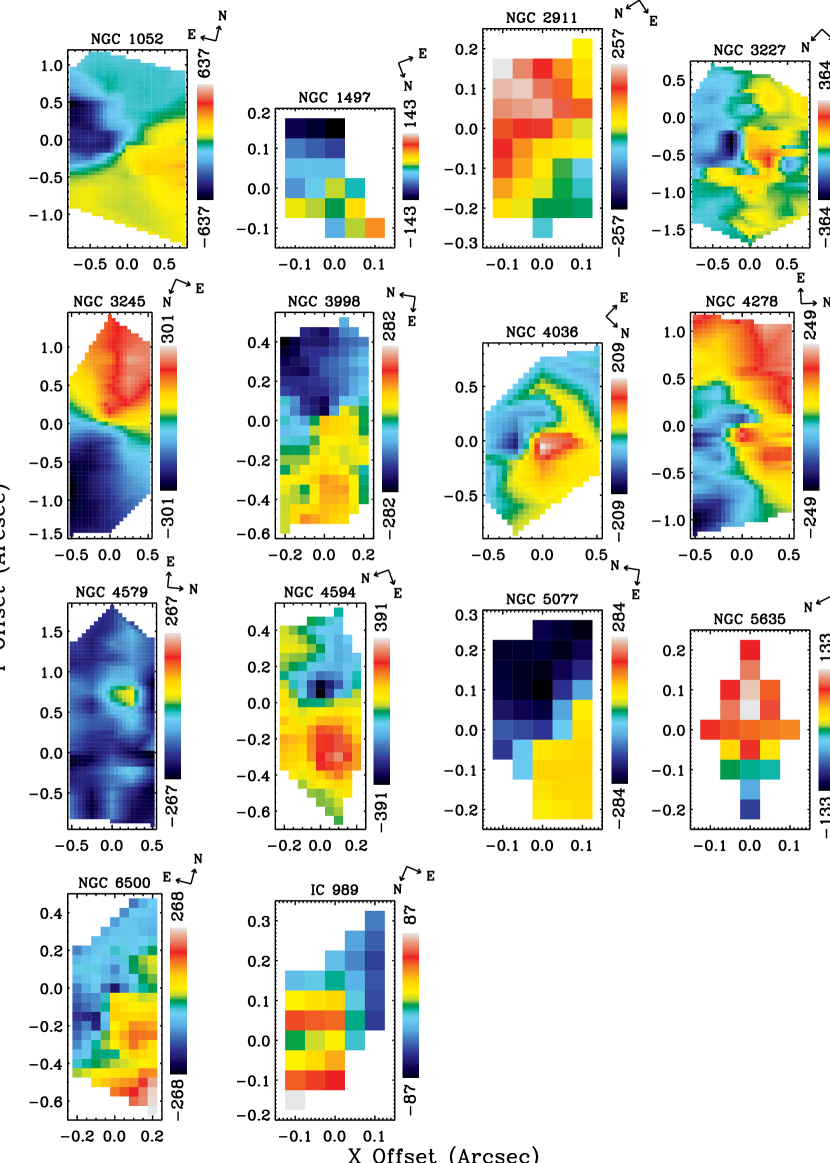
The velocity, velocity dispersion, and flux measured from the [N II] emission line for 12 of the 14 galaxies is plotted as a function of the position along a single slit in Figures 2a–2n. We show the galaxy’s systemic velocity, taken from optical line measurements in the Third Reference Catalogue of Bright Galaxies (RC3) (de Vaucouleurs et al., 1991), as the dashed line in the radial-velocity plots. For each galaxy, we also calculated the flux-weighted average velocity measured from the largest square aperture possible given the number of STIS slits for the galaxy and the number of rows from which spectra could be extracted. For five galaxies in the sample, the flux-weighted mean velocity differs from the RC3 velocity by km s-1.
We define the galaxy center (-offset = 0) to be the row with the largest continuum flux. The peak of the continuum flux coincided with the peak of the H broad-component flux in five of the seven broad-line galaxies, and in the cases of NGC 4579 and NGC 3998, the peak broad-component flux was offset from the peak of the continuum by one CCD row, corresponding to 4 and 8 pc, respectively. One possible explanation for the small offset is differential extinction between the continuum and the emission-line flux. Similarly, the peak of the narrow-line emission coincided with the peak of the continuum in five of the seven narrow-line galaxies, but for NGC 4036 and IC 989, the peak of the [N II] flux was offset from the continuum peak by one CCD row, corresponding to 5 and 50 pc, respectively. The H broad-component flux peak coincided with the narrow-line flux maximum in only two (NGC 1052 and NGC 4278) of the seven type 1 AGNs. In the other type 1 objects, the offset between broad and narrow-flux peaks was just one CCD row.
For completeness we include the velocity fields from NGC 3245, NGC 3998, and NGC 5077, although the data have been previously presented by Barth et al. (2001b), de Francesco et al. (2006), and de Francesco et al. (2008), respectively. We also include the velocity fields for NGC 6500 and IC 989 since de Francesco et al. (2008) present the velocity curves from the central slit positions, while we display the velocity fields from every slit position. Our measurements of the velocity fields from all five of these galaxies are consistent with those results previously published.
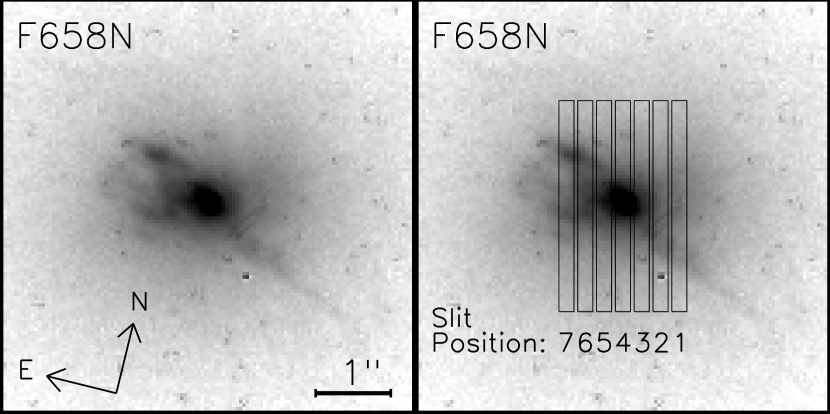
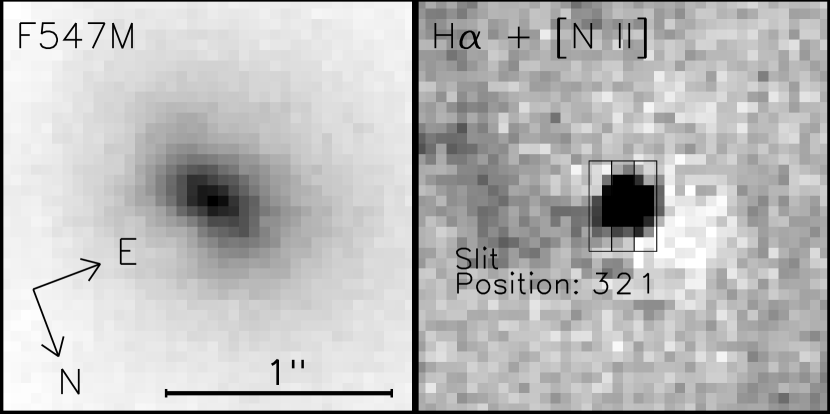
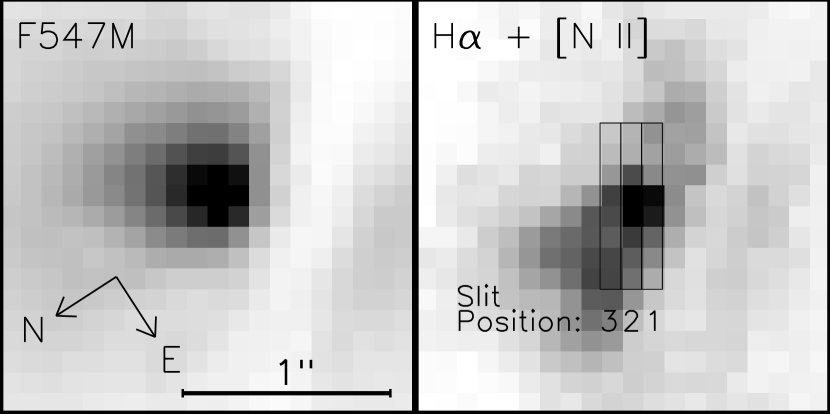
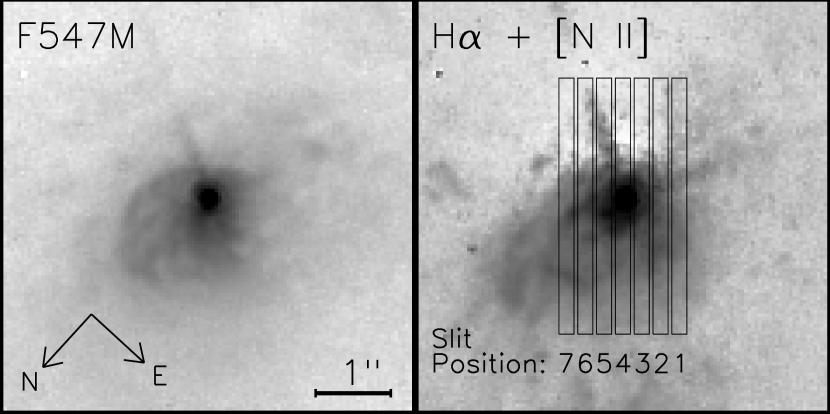
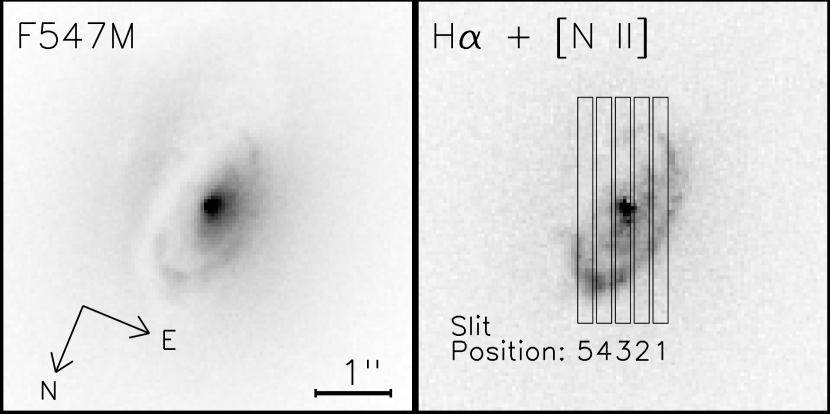
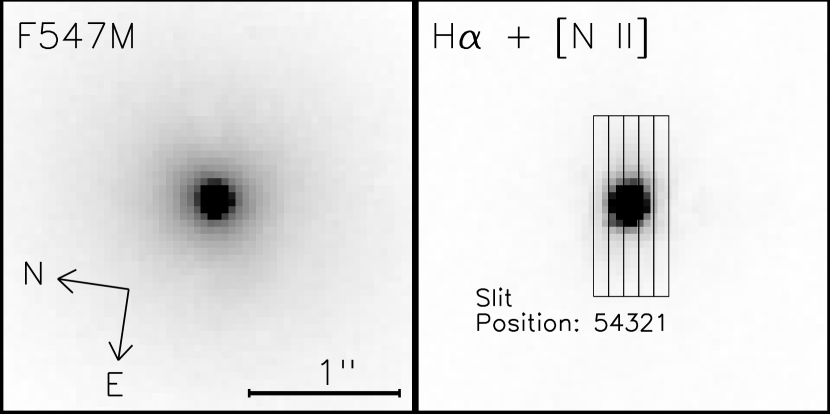
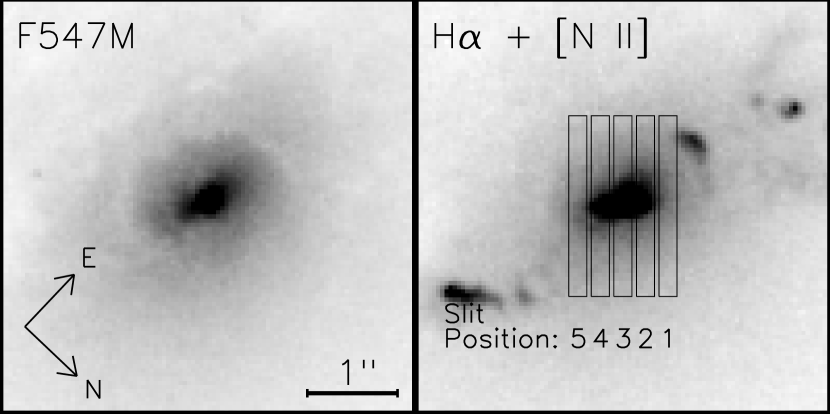
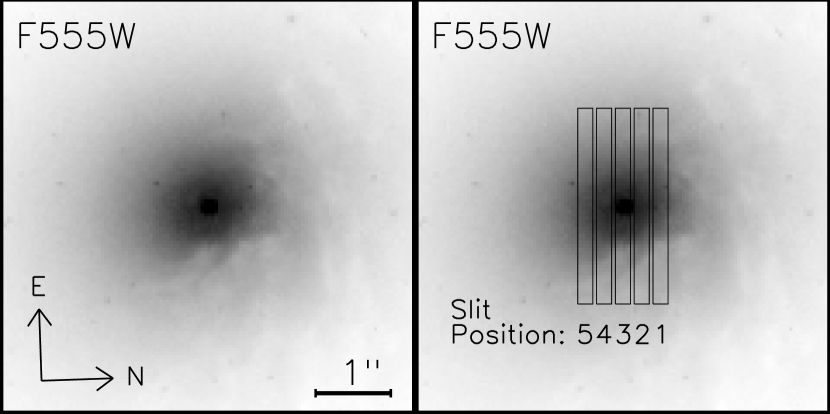
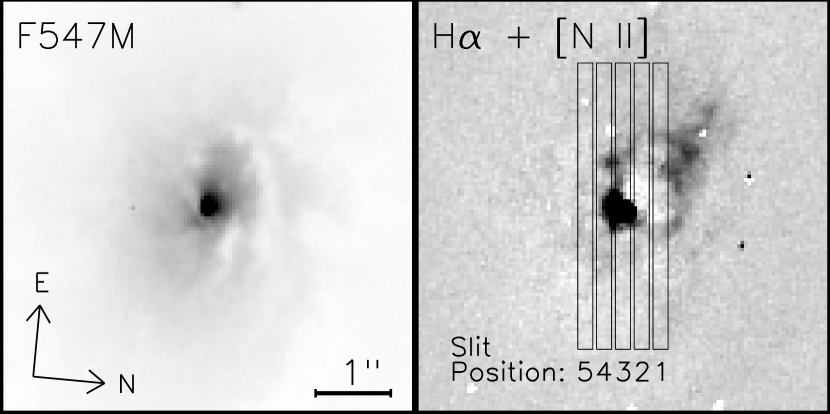
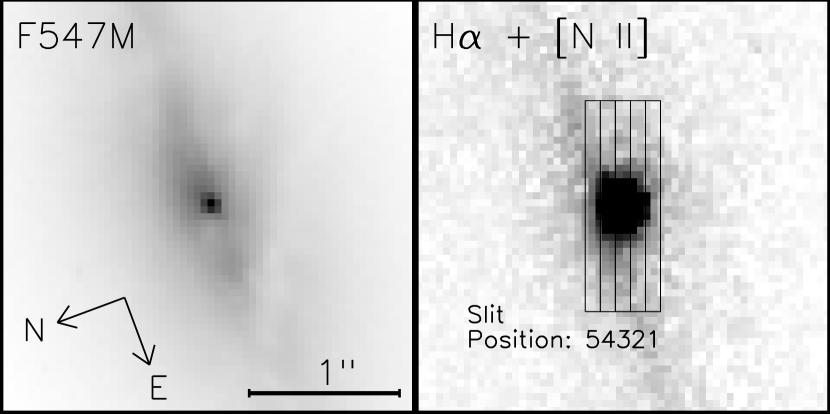
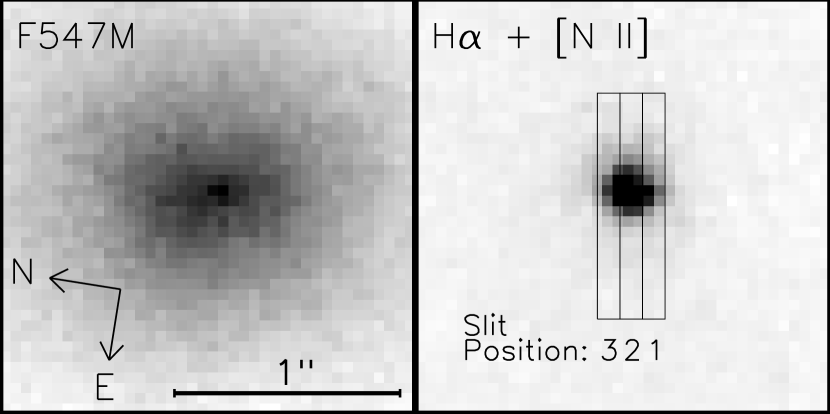
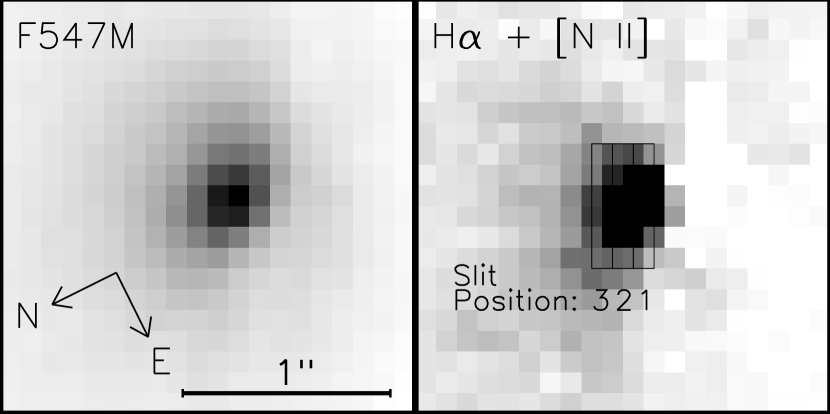
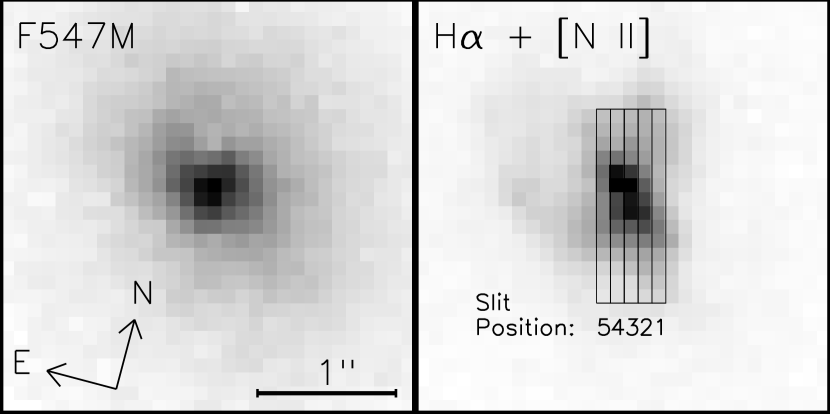
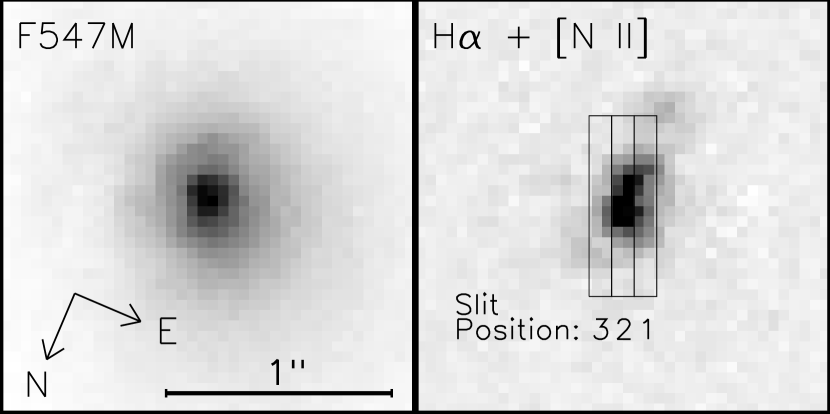
For all but two galaxies, a continuum-subtracted H[N II] image was created by subtracting a scaled WFPC2 702W image, or a scaled combination of F547M and F791W images, from a F658N image. This is shown along with the positions of the STIS slits in the second panel of the set of WFPC2 images at the top of the figures. We verified that the central slit position was placed on the nucleus by examining the peak-up image, which is an undispersed image taken through the slit, and the acquisition image, which is an initial image of the object taken with a larger aperture. We compared the spatial profile of the peak-up image to the spatial profile produced by vertical cuts through the nucleus of the acquisition image, and found similar profiles, indicating that the slit was centered on the nucleus.
The 14 galaxies in the sample show a large diversity in their observed velocity fields. Some velocity fields are consistent with rotation but perhaps at a low S/N, some galaxies seem to be in overall rotation with significant random components, some appear to be dominated by irregular motions, and others demonstrate clear evidence for outflows. As mentioned earlier, three galaxies (NGC 3245, NGC 3998, NGC 5077) have velocity fields previously shown to be consistent with circularly rotating disks. While there is no foolproof way to predict which galaxies will contain regularly rotating gas, Ho et al. (2002) determine that the morphology of dust lanes can be a reliable indicator of organized velocities fields. They find that galaxies with smooth, circularly symmetric dust rings often have velocity fields suitable for gas dynamical modeling, while those objects with clearly disorderly dust lanes almost never contain regular velocity fields.
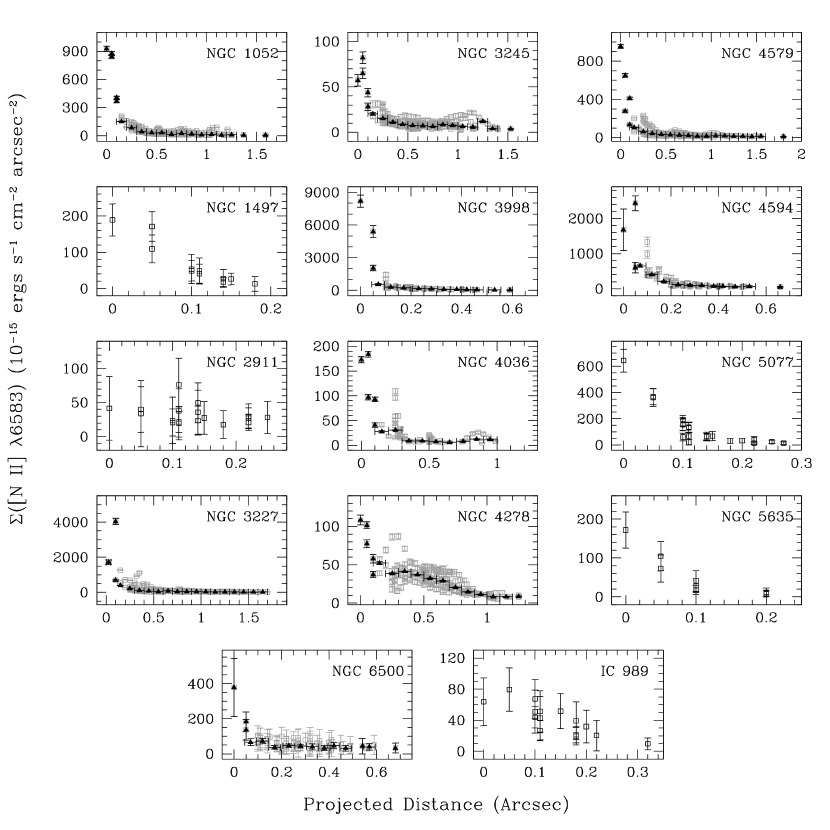
Figure 3 shows the [N II] surface brightness as a function of projected angular distance from the nucleus, where each point corresponds to a single row measurement. In order to emphasize the trends, we averaged together points within 01-wide annuli for the galaxies observed under program GO-7403. For NGC 3998, NGC 4594, and NGC 6500, we averaged together points that fell within 005-wide bins. These averages are plotted as black triangles. The shape of the surface brightness profile varies between galaxies, where some galaxies show a dramatic increase in surface brightness within the innermost regions and other galaxies exhibit a gradual rise in surface brightness over a larger range of radii. However, almost all of the galaxies in the sample do exhibit a centrally peaked surface brightness profile. NGC 3998 shows the sharpest peak in surface brightness, where the [N II] surface brightness falls by about a factor of 58 between and 028. Conversely, NGC 4278, NGC 3245, and IC 989 show the flattest profiles, where the [N II] surface brightness decreases by a factor of about 3–4 within the inner 025. NGC 2911 does not exhibit a central peak in the emission-line surface brightness, although the error bars are large and may mask a weak rise in surface brightness at smaller radii. In general, both type 1 and 2 LINERs have central peaks in emission-line surface brightness.
Radial-velocity maps of each galaxy are shown in Figure 4. For galaxies having multiple velocity components, we show the radial-velocity map for the velocity component plotted in black in Figures 2a, 2d, 2h, and 2i. In these multiple-slit velocity curves for NGC 1052, NGC 3227, NGC 4278, and NGC 4579, we attempt to label what appears to be coherent kinematic systems by using black and grey colors. However, we cannot definitively say that all black points represent a single component and all grey points represent a separate component. This ambiguity in the identification of coherent velocity components affects the radial-velocity maps in Figure 4 and may cause the velocity field we show to be more chaotic than it is in reality. While the multiple-slit velocity curves presented in Figures 2a–2n contain the same information, the velocity maps show more clearly whether the gas is dominated by rotational motion or chaotic motions.
Below we discuss the velocity fields for each galaxy in the sample, with the exception of NGC 3245 and NGC 3998.
4.1. NGC 1052
Overall the gas does not exhibit a regular rotation curve, and the presence of strong outflows can clearly be seen in the STIS data. The multiple velocity components identified in our spectra are spatially coincident with the structure seen in the narrow-band H[N II] emission-line image from Pogge et al. (2000), who detected an ionization cone at a position angle of . Two kinematically distinct components are seen in four of the off-nucleus slit positions and correspond to the location of jet-like features seen in the WFPC2 F658N image. The velocity splittings are as large as km s-1. The jet-like feature emerging from the nucleus toward the east is blueshifted by km s-1 relative to the galaxy’s systemic velocity of 1474 km s-1, and the western jet is redshifted by km s-1. In the eastern jet, in slit position 7, the line widths are extremely large, with a velocity dispersion of 600 km s-1.
Previous ground-based spectroscopic work by Sugai et al. (2005) has also found two components to the emission-line profiles, where one component is due to disk rotation at radii greater than ″ with an axis of rotation at a position angle of 153∘. The second component is attributed to a bipolar outflow, seen at a radius of 1″ from the nucleus, whose axis is at a position angle of . The blueshifted side of the outflow has a higher velocity of at least km s-1 relative to the systemic velocity, while the redshifted side has a velocity of km s-1 relative to the systemic velocity (Sugai et al., 2005). Additionally, Davies & Illingworth (1986) and Schulz & Henkel (2003) found evidence for outflows on large scales from ground-based spectra.
The fit to the spectrum from the nuclear region of the central slit was improved by the addition of a broad H component, as expected since this is a well-known type 1.9 LINER; the broad H emission has been shown to be polarized, indicating that the broad-line region is seen in reflected light (Barth et al., 1999).
Although the velocity map of NGC 1052 and the central slit velocity curve superficially resemble a rotational velocity field, the velocity structure shown in Figure 4 indicates that the NLR is actually dominated by an outflow. The color-coded velocity map shows only one of the two velocity components, where the component we plot shows redshifted and blueshifted sides that correspond to the jet-like features seen in the WFPC2 image.
4.2. NGC 1497
Due to the poor S/N of the spectra, especially from the first slit position, only a few rows in each exposure could be fit. Consequently, it is difficult to determine whether the gas is rotating. However, a velocity gradient of 150 km s-1 is seen across 015 in the central slit position, and this could be consistent with rotation, although the velocity gradient is not symmetric about the location of the peak of the narrow-line region flux.
4.3. NGC 2911
Only a small number of velocity measurements could be made at each slit position due to the low S/N of the spectra. However, the velocity map suggests that the gas is dominated by rotational motion. The central slit position exhibits a gradient of 270 km s-1 across the innermost 03. With higher quality spectra, this galaxy could be a good candidate for dynamical modeling. The flux-weighted average velocity measured in a 03 square aperture is 3285 km s-1, while the systemic velocity taken from RC3 is 3167 km s-1. Other optical measurements of the systemic velocity given by the NASA Extragalactic Database (NED) span a large range of velocities, km s-1. The inconsistencies between the various systemic velocity measurements may be the result of dust obscuration of the galaxy nucleus and one side of the emission-line disk, as a dust lane is visible in the WFPC2 image.
4.4. NGC 3227
The velocity field is very complex and chaotic. Two separate kinematic components are seen in all seven slit positions. At some locations, the velocity differences between the multiple velocity components are as large as km s-1. Our kinematic mapping of NGC 3227 shows that the NLR contains components with low velocities and low velocity dispersions, as well as components with high velocities and high velocity dispersions. In particular, in the eastern direction in slit positions 1 and 2, one of the components has a velocity of km s-1 relative to the systemic velocity and a velocity dispersion of km s-1. In slit position 7, in the northern direction, one component has a velocity of km s-1 relative to the systemic velocity, and a velocity dispersion of km s-1. Similar multicomponent structures have been seen in other Seyferts as well, including NGC 4151 (Kaiser et al., 2000; Nelson et al., 2000).
An additional H broad component was fit to spectra in all but the outermost two slit positions. The brightness of the H broad component in the central slit position, as well as in the adjacent slit positions 2 and 3, appears to be consistent with a bright point source that has been smeared by the STIS point-spread function (PSF). However, the flux of the broad component found at a Y Offset of 03 to 005 in slit position 5, and the broad component flux at a Y Offset of 025 to 015 in slit position 6, appear to be in excess of that expected from the wings of a point source. It is possible that NGC 3227 exhibits scattered broad-line region light located in this region to the northwest of the nucleus.
Previous studies of the ionized gas in NGC 3227 have also found chaotic velocity fields, as well as asymmetries and double-peaked profiles of the narrow H, [S II], [N II], and [O III] emission lines. These asymmetries were attributed to the superposition of several physically and kinematically distinct components, where the broader component was attributed to outflowing gas (Arribas & Mediavilla, 1994; González Delgado & Pérez, 1997; García-Lorenzo et al., 2001). Although strong outflows are seen in the ionized gas, the molecular gas in NGC 3227 appears to be in regular rotation with a major axis at a position angle of 140∘ (Schinnerer et al., 2000; Reunanen et al., 2002; Davies et al., 2006; Hicks & Malkan, 2007). Our data show that one of the two velocity components, given by the black points in Figure 2d and shown in Figure 4, exhibits similar overall features as the molecular gas velocity field presented in Hicks & Malkan (2007). The redshifted and blueshifted ionized gas in this kinematic component roughly corresponds spatially to the redshifted and blueshifted portions of the molecular gas. While one of the [N II] velocity components appears to trace the general features of the molecular gas, the ionized gas is still highly disturbed and is not participating in simple disk-like rotation.
4.5. NGC 4036
The radial-velocity map shows the gas is rotating, although this motion is difficult to recognize from the multiple slit velocity curves alone. Velocities measured from the two slit positions to the southwest of the nucleus are blueshifted by as much as 200 km s-1, while velocities from slit position 2 are redshifted by 150 km s-1 relative to the systemic velocity of 1397 km s-1. The central slit position exhibits a velocity gradient of km s-1 across the inner 02. Cinzano et al. (1999) examined the [O II] gas kinematics and found that NGC 4036 contained gas that was clearly not undergoing circular motion on scales less than 10″. Additionally, based upon their WFPC2 narrow-band H[N II] image, Pogge et al. (2000) noted the existence of a complicated filamentary and clumpy structure.
We did not require a H broad component in the fit to the spectra in any of the slit positions. However, through ground-based measurements, Ho et al. (1997b) determined that NGC 4036 contained a weak, very low-amplitude, broad H component. This disagreement may be the result of variability, but another possibility is that the apparent broad H component in the ground-based data arises from the unresolved high-velocity material in the inner NLR.
4.6. NGC 4278
From the multislit velocity curves and the velocity map, the gas appears to be in organized motion and displays some characteristics of rotation. However, within the inner 05, the velocity field appears to be twisted, and may be the result of a counter-rotating core. Another attractive possibility is that this central decoupled structure is related to the parsec-scale radio jet seen by Giroletti et al. (2005). According to Giroletti et al. (2005), the double-sided jet is seen at position angles of 155∘ and , which suggests that the central kinematic structure seen in the velocity field may be the result of material being pushed by the jet. The central slit position exhibits a velocity curve that is symmetric about the central row and has a gradient of 400 km s-1 across the inner 02. Two velocity components were needed to fit some of the spectra in the two outermost slit positions, where the additional component’s velocity differed by km s-1 from the primary component. An additional broad H component was fit in the inner regions of the central slit position.
4.7. NGC 4579
Both the multislit velocity curves and the velocity map show that the gas is not in regular rotation. A few spectra in the off-nucleus slit position immediately adjacent to the center slit displayed two kinematically distinct components, where the velocity separation is km s-1. The nuclear disk may be nearly face-on since the primary velocity component is almost flat at km s-1. In the central slit position, the [N II] velocity dispersion peaks at 440 km s-1 at a separation of 025 from the central row. A broad component of H was detected in the nuclear regions of the central slit as well as in slit position 4. In the STIS data, the nuclear spectrum reveals an asymmetric, very broad H component with a full width at zero intensity of km s-1 and “shoulders” on the red and blue sides (Barth et al., 2001a). In their H[N II] narrow-band image, Pogge et al. (2000) find complex, clumpy, and filamentary emission, which they liken to a shell or a ring. Ground-based measurements on larger scales also find irregular kinematics (González Delgado & Pérez, 1996). The flux-weighted average velocity measured from a 12 square aperture is 1465 km s-1, while the systemic velocity taken from RC3 is 1627 km s-1. The other optical measurements of the systemic velocity given by NED span a wide range of velocities, 1480–1750 km s-1.
4.8. NGC 4594
The data for NGC 4594 show organized motion consistent with an overall rotation pattern, but with significant irregularities. The central slit position contains a velocity gradient of km s-1 across 025. Narrow-band H[N II] WFPC2 images from Pogge et al. (2000) revealed a bright H core surrounded by spiral-like wisps that extended to 4″ east and west and 1″ south of the nucleus. Emsellem & Ferruit (2000) found that a cut through the [N II] velocity map along the galaxy’s major axis showed the existence of a strong velocity gradient near the center, and that the gas kinematics within 1″ was decoupled from the gas located in the spiral wisps.
There has been some previous debate as to whether a broad H component is present in NGC 4594. Kormendy et al. (1996) concluded that such a component existed; on the other hand, both Ho et al. (1997a) and Nicholson et al. (1998) were able to reproduce the H[N II] blend with only narrow components. In our analysis, an additional broad H component improved the fit to several of the nuclear rows of the central slit position. We also tried to fit multiple narrow components to each of the H, [N II], and [S II] lines without a broad component, but failed to find a satisfactory result. However, the H[N II] lines are severely blended together and the S/N is low in the central rows, so we are unable to conclude that a broad component is definitely required.
4.9. NGC 5077
The velocity curves and the radial-velocity map show that the gas is likely to be in regular rotation. This is in agreement with de Francesco et al. (2008), who used the same archival STIS dataset to perform gas dynamical modeling and determined the black hole mass to be . The flux-weighted average velocity measured from a square aperture of 03 is 2732 km s-1, while the systemic velocity taken from RC3 is 2832 km s-1. Other optical measurements given by NED cover the range km s-1.
4.10. NGC 5635
The velocity map and the velocity curve from the central slit position are consistent with disk rotation. The central slit position shows a velocity gradient of km s-1 across the nucleus. The spectra from the off-nucleus slit positions had such low S/N that only a single velocity measurement could be made. Unfortunately, the poor quality of the spectra precludes detailed kinematic modeling of the gas.
4.11. NGC 6500
The velocity field from the multiple slit positions is irregular and not consistent with pure circular motion. Based upon the velocity map, the gas does appear to be dominated by rotation, though with some additional random components. This is in agreement with de Francesco et al. (2008), who also find complex velocity curves and departures from regularly rotating gas, but they do note a general rotation trend from the central slit position. They suggest that the complicated velocity curves are the result of a nuclear expanding bubble. González Delgado & Pérez (1996) detected multiple velocity components out to 1 kpc away from the nucleus, indicating that the extended NLR is experiencing an outflow.
4.12. IC 989
The S/N is very low and velocities could only be measured at a few positions, so the kinematic state of the gas is not well constrained. With the same archival STIS dataset, de Francesco et al. (2008) note that the central slit position shows overall rotation with blueshifted gas southwest of the nucleus and redshifted gas northeast of the nucleus. They suggest the presence of a counter-rotating nuclear gas disk since the velocity gradient is reversed at the center. Alternatively, this may indicate the presence of a radial flow component.
5. Discussion
5.1. Density Gradients
In addition to determining the velocity, velocity dispersion, and flux from the measurement of emission lines, we measured the [S II] [S II] and the [O I] [S II] [S II] line intensity ratios. The [S II] ratio can be used to determine the electron density because of the difference between the critical densities of the two lines, where n cm-3 for [S II] and n cm-3 for [S II] (e.g., Peterson 1997). However, this ratio is only sensitive to density over the range cm n cm-3. The [O I]/[S II] ratio is also density-dependent, but not in a unique fashion since the ratio is influenced by the abundances, ionization level, and shape of the ionizing spectrum. However, the [O I]/[S II] ratio is sensitive to electron density over a range wider than the [S II] ratio because of the larger critical density of the [O I] line, where n cm-3 (e.g., Peterson 1997). Below, we show results from photoionization calculations to illustrate the use of the [O I]/[S II] ratio to probe high-density regions.
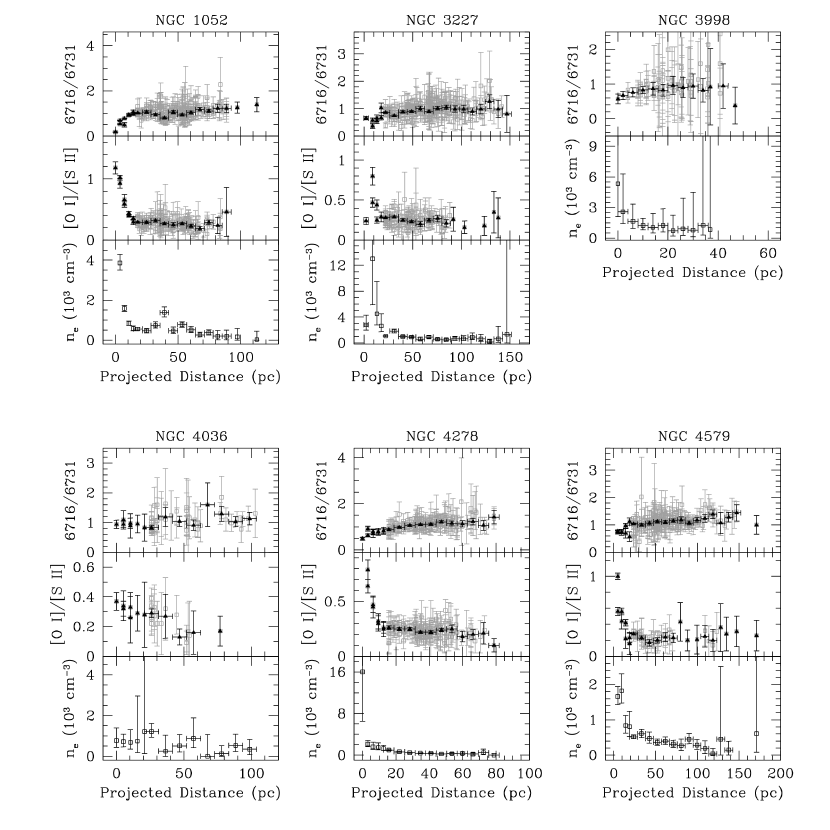
Figure 5 contains plots of the [S II] /[S II] ratio, the [O I]/[S II] ratio, and the electron density determined from the [S II] ratio as a function of projected radial distance from the nucleus. The [O I] lines were not present in the NGC 3998 spectra since the grating tilt was set to provide coverage of 6490–7050 Å, so only the [S II] ratio and the electron density are plotted as a function of distance from the nucleus. To examine the overall trends in electron density with radius, we computed average [S II] / ratios in 01-wide radial bins (or 005-wide bins for NGC 3998). With the radial averages of the [S II] [S II] ratio, the electron density as a function of radius was calculated using the IRAF task temden assuming a temperature of 10,000 K. In the instances where velocity splitting was present, the secondary component was too weak to produce an independent measurement of the electron density, and the two components were summed before the [S II] ratio was calculated. The remaining eight LINERs not included in Figure 5 have such large uncertainties in the density measurements that no information on the density structure could be extracted from the data.
Significant density gradients are seen in NGC 1052, NGC 4278, NGC 3998, and NGC 4579. Measurements of the density structure in NGC 4579 have been previously presented by Barth et al. (2001a). In these galaxies, the electron density increases from cm-3 in the outer regions to cm-3 at the center. In contrast to these four galaxies, NGC 4036 does not exhibit any systematic change in ne with respect to radial distance from the center or a central spike in density. It is interesting to note, however, that this galaxy did not need a broad H component to fit the central spectrum. Among the objects with a sufficient S/N to map ne from the [S II] lines, all of the broad-lined AGNs show central density peaks.
The [O I][S II] ratio also rises dramatically toward the nucleus in some objects, increasing to as much as in NGC 1052, in NGC 4579, and in NGC 4278. These central [O I][S II] values are very large in comparison to the average ratio typically found on scales of hundreds of parsecs from ground-based spectra of LINERs. For comparison, we used the emission-line measurements from Ho et al. (1997a) to calculate an average [O I]/[S II] ratio for both type 1 and type 2 LINERs. We first removed the galaxies for which a “low confidence” or a “high uncertainty” flag was given for either the LINER classification or the [O I]H and [S II]H ratios. This left a sample of 57 galaxies from which we calculated the average [O I][S II] ratio to be in the ground-based 2″4″ aperture. From the same sample of 57 galaxies, those galaxies classified as type 1 LINERs had [O I][S II] ratios in the range – with an average ratio of , while the type 2 LINERs had [O I][S II] ratios of – with an average ratio of .
Although the [O I]/[S II] ratios at the centers of NGC 1052, NGC 4278, and NGC 4579 are well above the typical values found in LINERs, the [O I][S II] ratio is not a unique indicator of density. The ratio is additionally affected by the abundance ratio, the ionization parameter (U, which characterizes the number of ionizing photons per nucleon), and the shape of the ionizing continuum. In order to further interpret the high values of [O I]/[S II], we used version 07.02.00 of CLOUDY (Ferland et al., 1998) to generate a few grids of simple photoionization models. In particular, we used the AGN continuum model that takes as free parameters the temperature of the thermal big blue bump component, the UV (2500 Å) to X-ray (2 keV) spectral slope , and the power-law slopes of the low-energy part of the big blue bump () and of the X-ray continuum (). We left the thermal component temperature, , and at their default values ( K, , ). The parameter was varied over to in increments of , bracketing the typical range for low-luminosity AGNs (Ho, 1999). Models were computed for a single plane-parallel slab of constant-density gas either at solar and twice solar metallicity, with gas density ranging from n cm-3 to 106 cm-3, and ionization parameter ranging from log U = to . We calculated models that did and did not include dust grains.
From these grids of photoionization models, we found small [O I]/[S II] ratios, consistent with ground-based results, at low values of nH ( cm-3 – cm-3). The ratio increases strongly for n cm-3. To illustrate our model results, in Figure 6 we plot the [O I][S II] ratio as a function of gas density for the models with twice-solar metallicity and dust-free gas, and for and . For , a [O I][S II] ratio of corresponds to a density of for U = and , and a density of for U = . For , a [O I][S II] ratio of corresponds to a density of for U = and , and a density of for U = . The smaller [O I]/[S II] ratio for is expected since the increased UV flux relative to X-ray flux results in a less extended partially ionized zone. The models where solar metallicity was used and where dust was included showed qualitatively similar results to the models presented in Figure 6 for the low ionization parameters, where densities greater than were needed in order to produce an [O I]/[S II] ratio of . Thus, while the electron density cannot be directly determined from the [O I][S II] ratio, the rise in the line ratio seen in NGC 1052, NGC 4278, and NGC 4579 gives strong evidence for a steep inner rise in density.
The single Seyfert galaxy in the sample, NGC 3227, exhibits a density gradient over a portion of the NLR, with n in the outer regions and n at a radius of pc. The electron density then decreases at the nucleus to . Additionally, the [O I][S II] ratio rises toward the nucleus to at a radius of pc, then decreases to at the center.
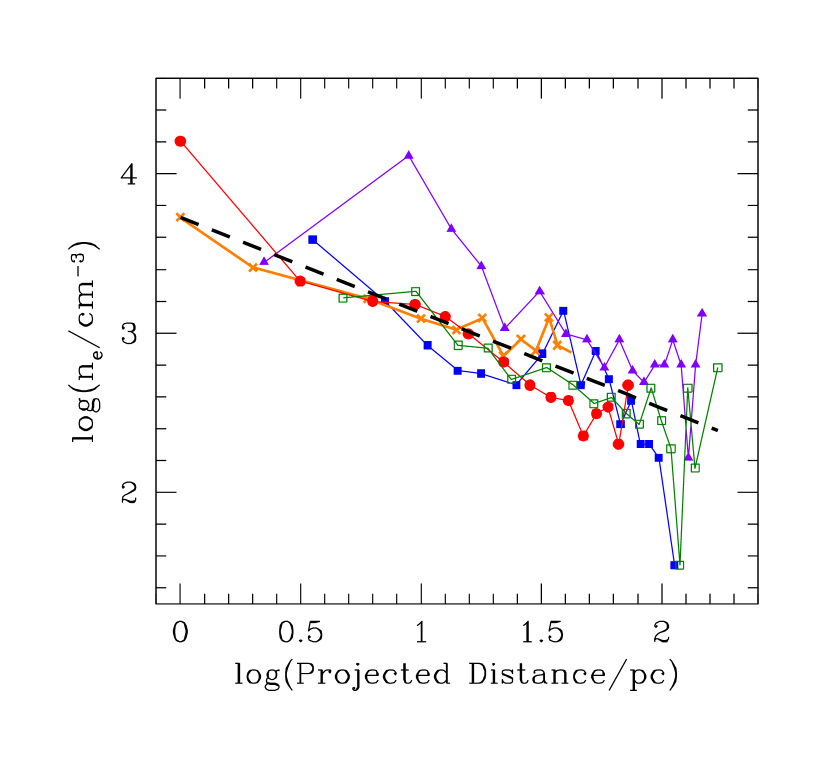
Overall, the data from NGC 1052, NGC 3998, NGC 4278, and NGC 4579 provide clear evidence that Type 1 LINERs contain a radially density-stratified NLR. The detection of density gradients in Type 1 LINERs is consistent with photoionization models of LINERs. It also appears that density gradients can persist even in the presence of strong outflows such as those seen in NGC 1052 and those seen over a portion of the NLR in NGC 3227. Moreover, these five broad-lined AGNs exhibit similar density structure as can be seen in Figure 7, where we show the electron density as a function of projected radial distance from the nucleus for the five AGNs. We fit a power law of the form to the density measurements from each galaxy separately. We calculated the average slope and normalization, as well as the standard deviation for each of the two parameters, and found cm-3 and . Although there is a large range in the normalization values between the five broad-lined AGNs, the density measurements are characterized by a similar slope.
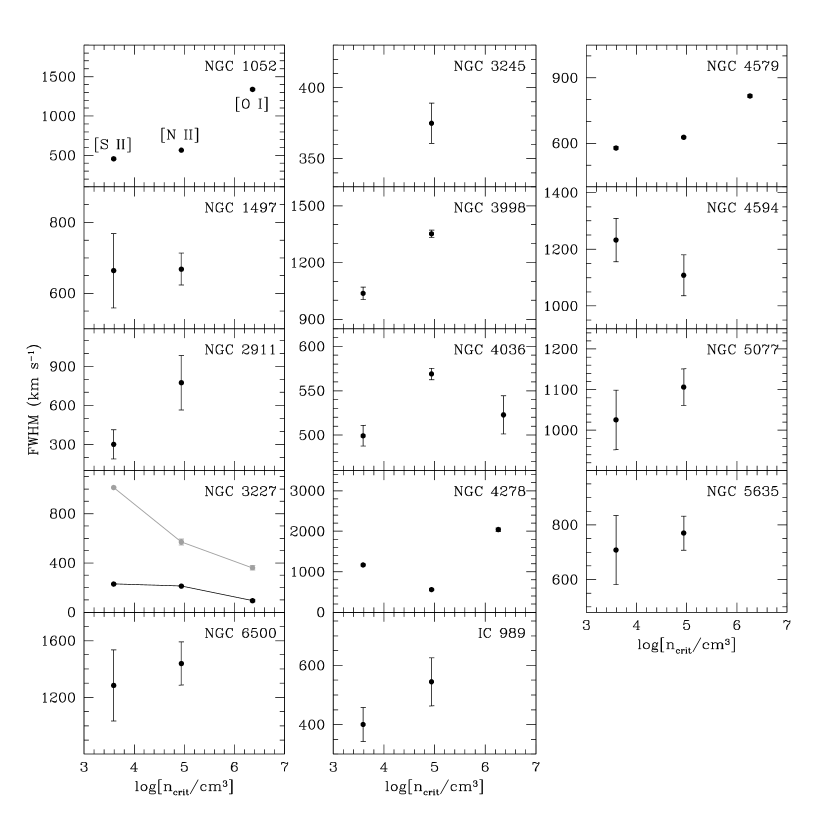
In order to determine whether unresolved density gradients exist even on the smallest angular scales probed by STIS, we examine the nuclear spectrum for evidence of a correlation between line width and critical density for collisional deexcitation (e.g., Filippenko & Halpern, 1984; Filippenko, 1985). The line-width–ncrit relationship implies that the NLR has radial gradients in velocity and density, where the broader emission lines arise from gas closer to the black hole. In Figure 8, we plot the full width at half-maximum intensity (FWHM) of the [S II] , [N II] , and [O I] lines as a function of critical density. The widths of these lines were measured from the central row of the central slit position for all the galaxies in the sample with the exception of NGC 3227. Due to the sharp peak in the surface brightness at the nucleus of NGC 3227, the geometric rectification performed during the data reduction produced anomalous bumps in the continuum as well as an irregular [O I] line profile. We therefore binned together the innermost three rows from the central slit position before fitting H[N II], the [S II] doublet, and the [O I] lines to a double-Gaussian narrow-component model. In the plot for NGC 3227 in Figure 8, we show the FWHM for each of the two Gaussian components for a single emission line.
Of the eight objects in the sample with only [S II] and [N II] measurements, seven of the galaxies show that the FWHM of the [N II] line is greater than the FWHM of the [S II] line. Although many of these width measurements have large error bars, it does appear that the FWHM rises with increasing critical density. Of the five galaxies with measurements of all three lines, NGC 1052 and NGC 4579 clearly show the presence of a line-width–ncrit relationship, while NGC 4278 exhibits an increase in the FWHM between the [S II] and the [O I] line. NGC 4036 shows an increase in the FWHM between the [S II] and the [N II] lines, but a slightly smaller FWHM for the [O I] line. In contrast, NGC 3227 shows a decreasing FWHM with increasing critical density for both the high velocity dispersion and low velocity dispersion Gaussian components. The decreasing line width with increasing critical density indicates that the lowest density gas is actually moving the fastest, which may be the result of the strong outflow in NGC 3227. It is also possible, however, that this unusual trend seen in the Seyfert NGC 3227, as well as the decrease in the electron density seen in the inner region in Figure 5, may not be real and may be due to an inadequate fit to a rather complicated nuclear spectrum. Without additional Seyferts in the sample, or higher luminosity AGNs similar to NGC 3227, it is impossible to determine whether this is an anomalous result or a more common finding related to the properties of the AGN. With the exception of the Seyfert galaxy NGC 3227, a line-width–ncrit relationship can be observed even on the smallest STIS scales corresponding to pc, making the line-width–ncrit relationship a generic property for LINERs. We are therefore seeing unresolved density structure, providing further evidence that the density continues to rise even within the innermost pc in most LINERs.
5.2. Aperture Size and Line Width
Another question that can be addressed with our measurements concerns the variations in emission-line width with aperture size. Such an analysis is useful in determining the scales over which the bulge dominates the NLR kinematics in low-luminosity AGNs. In the past, it has been assumed that ground-based observations sample NLR gas that is kinematically dominated by the virial motion in the bulge potential (Nelson & Whittle, 1996). However, as discussed by Laor (2003), low-luminosity AGNs have a more compact NLR whose kinematics may instead be dominated by the black hole.
Rice et al. (2006) examined narrow-line widths as a function of aperture size using single STIS slit observations of a sample of Seyfert galaxies. They found most of the galaxies exhibited a constant or increasing FWHM with increasing aperture size. Our sample allows us to perform a similar analysis on low-luminosity AGNs. We are able to considerably improve upon the Rice et al. (2006) analysis by using the STIS multislit observations to study the line-width variation within square apertures of increasing size, eliminating the biases introduced by studying only a relatively narrow and randomly oriented portion of the velocity field.
For the six galaxies from program GO-7403, we choose square apertures of , , , and on a side, and for the eight galaxies from program GO-7354 we used square apertures , , and on a side. The sizes of the apertures were chosen such that the width of an entire STIS slit fell within the aperture. We then used the results of the spectral fitting to the narrow [N II] emission line and summed together the Gaussian components that fell within the various aperture bins. We characterized the profile of the summed Gaussians in each aperture by measuring the line width at % of the peak height, thus defining a FWHM for the summed line profile. The FWHM was measured directly from the summed model, not from a Gaussian fit to the summed model.
The quantity FWHM/2.35 is plotted against half the length of the square aperture size (i.e., the “radius” of the aperture) in Figure 9. We plot FWHM/2.35 in order to compare with the bulge stellar velocity dispersion. Also included in the plots is an additional line-width measurement for [N II] from a ground-based ″″aperture given by Ho et al. (1997a) for all but three galaxies in our sample. The ″″aperture is taken to be an effectively ″ square aperture and is plotted at a radius of . Additionally, we found ground-based measurements of the bulge stellar velocity dispersion from the literature for of the galaxies in the sample. These values are listed in Table Hubble Space Telescope Spectroscopic Observations of the Narrow-Line Region in Nearby Low-Luminosity Active Galactic Nuclei111Based on observations made with the NASA/ESA Hubble Space Telescope, obtained from the Data Archive at the Space Telescope Science Institute, which is operated by the Association of Universities for Research in Astronomy, Inc., under NASA contract NAS 5-26555. These observations are associated with programs GO-7403 and GO-7354. and are plotted in Figure 9 as the dashed horizontal lines. We estimated the radius of the sphere of influence of the supermassive black hole, given by , in each of the 13 galaxies for which a stellar velocity dispersion measurement could be found. We used the Tremaine et al. (2002) – relation to estimate the black hole mass in all of the galaxies except NGC 3227, NGC 3245, NGC 3998, NGC 4594, and NGC 5077. For these galaxies we used black hole mass measurements from the literature (Table Hubble Space Telescope Spectroscopic Observations of the Narrow-Line Region in Nearby Low-Luminosity Active Galactic Nuclei111Based on observations made with the NASA/ESA Hubble Space Telescope, obtained from the Data Archive at the Space Telescope Science Institute, which is operated by the Association of Universities for Research in Astronomy, Inc., under NASA contract NAS 5-26555. These observations are associated with programs GO-7403 and GO-7354.). The sphere of influence was then converted into an angular scale using the distances listed in Table Hubble Space Telescope Spectroscopic Observations of the Narrow-Line Region in Nearby Low-Luminosity Active Galactic Nuclei111Based on observations made with the NASA/ESA Hubble Space Telescope, obtained from the Data Archive at the Space Telescope Science Institute, which is operated by the Association of Universities for Research in Astronomy, Inc., under NASA contract NAS 5-26555. These observations are associated with programs GO-7403 and GO-7354. and plotted as the dotted vertical lines in Figure 9.
For most of the galaxies in the sample, the [N II] velocity dispersion peaks within the black hole sphere of influence and then decreases in larger apertures, approaching the bulge stellar velocity dispersion. This implies that on scales accessible to ground-based measurements, the width of the low-ionization lines, such as [N II], is set by the bulge and not by the black hole. The work by Laor (2003) suggested that in low-luminosity AGNs, the NLR may be dominated by the black hole and not the bulge. However, the arguments put forth by Laor (2003) involved the [O III] line, which due to the higher ionization and higher critical density, originates from a region closer to the black hole than the [N II] line. Also, our finding that, for most galaxies in the sample, the velocity dispersion is largest within the black hole sphere of influence supports the idea that STIS central line-width measurements trace the black hole mass, and can therefore be used to place upper limits on black hole masses in nearby galaxies (Sarzi et al., 2002; Beifiori et al., 2007).
NGC 1052, NGC 3227, and NGC 3245, however, show a different trend, where the FWHM increases with aperture size. Both NGC 1052 and NGC 3227 contain successively wider or roughly constant [N II] narrow lines for the increasing STIS aperture sizes, but a smaller FWHM for the ground-based aperture. In the cases of NGC 1052 and NGC 3227, the strong radial motions create large velocity splitting between components, causing an increase in the FWHM. The smaller line width seen in the ground-based aperture may be the result of the outflows decelerating at larger radii, as described in the outflow cone models by Crenshaw & Kraemer (2000).
An initial expectation for the behavior of line width with aperture size for gravitationally dominated gas may be a decreasing FWHM with increasing aperture size. This is reasonable since most of the ionized gas flux comes from a region close to the black hole, where the gas is moving the fastest and thus has the largest line width due to unresolved rotation. However, the line-width variation with aperture size in NGC 3245 clearly disagrees with the above expectation, since the gas in NGC 3245 is known to be in near-perfect disk-like rotation (Barth et al., 2001b). In order to gain a more complete understanding of line-width variation with aperture size, we constructed a toy thin-disk model for gas in circular rotation. First, we generated a model velocity field on a grid where each model pixel was 000507 on a side (i.e., 10 oversampled relative to the STIS pixel size). The velocity field is set by the black hole mass, the disk inclination angle, and the stellar mass profile. We used a Hernquist (1990) model to describe the stellar mass contribution. The intrinsic line-of-sight velocity profiles were assumed to be Gaussian before passing through the telescope optics, and were calculated on a velocity grid with a bin size of 25.24 km s-1, in order to match the STIS pixel scale.
The model velocity field was then projected onto the plane of the sky, and was synthetically “observed” in a manner that closely matches the STIS observation. This synthetic observation involved summing the intrinsic line-of-sight velocity profiles at every point in the disk and including the blurring introduced by the nonzero STIS pixel size and the telescope PSF. In particular, the line-of-sight velocity profiles were weighted by the emission-line surface brightness profile, modeled by the function . We included an intrinsic velocity dispersion, similar to those observed in other early-type galaxies (van der Marel & van den Bosch, 1998), by setting the widths of the line-of-sight velocity profiles according to . Finally, we accounted for the telescope PSF by using Tiny Tim (Krist & Hook, 2004) to generate a 0202 subsection of the full STIS PSF. The PSF was subsampled to match the model pixel grid and computed for a monochromatic filter passband at Å. Each velocity slice of the pixel grid was convolved with the PSF. These modeling steps are a simplified version of the modeling described in detail by Barth et al. (2001b). For our purposes, this synthetic observation involved placing a single STIS slit with increasing aperture lengths at different angles measured from the gaseous disk major axis in order to mimic the Rice et al. (2006) analysis. We additionally placed square apertures of increasing size over the model velocity field to replicate our measurements previously discussed. In both instances, we summed the line profiles that fell within the various apertures and calculated the FWHM of the summed profile.
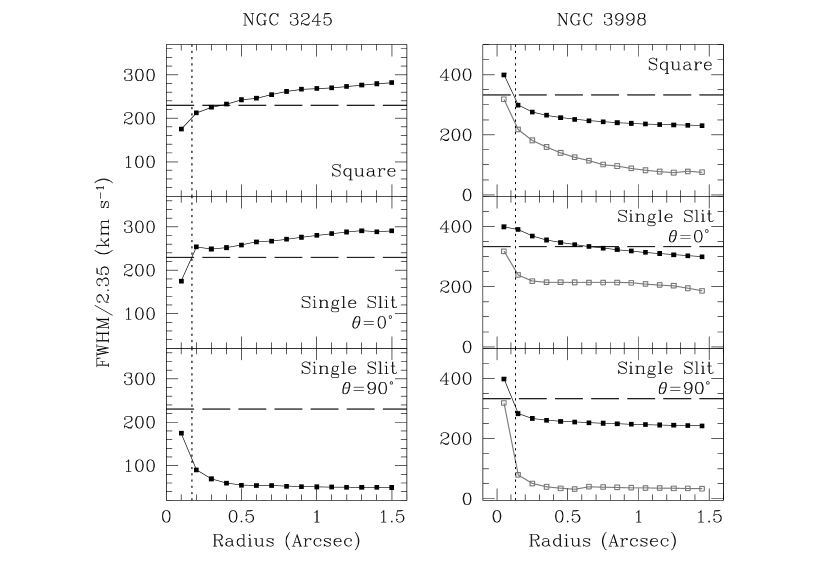
As an example, in Figure 10 we show the results of the toy model using the properties of NGC 3245 and NGC 3998 as the input parameters. We selected these galaxies because in both cases the gas is known to be in circular rotation but the behavior of line width versus aperture size is quite different for the two objects. We used the black hole mass and inclination angle determined from the models of Barth et al. (2001b) and de Francesco et al. (2006), and we choose the Hernquist (1990) bulge normalization and the scale radius such that the toy model velocity field would match the observed velocity field as closely as possible for the outermost velocity measurements. Similarly, we determined the parameters of the emission-line surface brightness profile by requiring the profile to match the observed [N II] flux distribution. Also, for NGC 3245, the parameters of the function describing the widths of the line-of-sight velocity profiles were given by Barth et al. (2001b).
Note that de Francesco et al. (2006) did not include any intrinsic velocity dispersion in their model of NGC 3998. We therefore first generated disk models using only a small constant intrinsic line width of km s-1. We found an overall trend that qualitatively matched the data, but the line widths overall were too small, as can be seen in Figure 10, and the line profile was double peaked in each of the apertures. Since a double-peaked line profile is not seen in the data, we instead included an intrinsic velocity dispersion with the parameters km s-1, km s-1, and pc. We chose this intrinsic velocity dispersion since it produced a central line width more consistent with the data and a single-peaked line profile in each of the apertures. Such values for the intrinsic velocity dispersion are not unreasonable given previous results of disk modeling by van der Marel & van den Bosch (1998) and Barth et al. (2001b). Moreover, we stress that we are employing a simplified version of the disk modeling; a complete treatment, including a more appropriate emission-line surface brightness profile and a more realistic model of how the light passes through the telescope optics, would change the values of the intrinsic velocity dispersion parameters needed to reproduce the observed line widths.
The top panels for both NGC 3245 and NGC 3998 in Figure 10 are the results from using progressively larger square apertures. Since we adopted a simplified disk model, the models in Figure 10 do not exactly numerically match the observational data. However, with our model, we are able to reproduce the qualitative behavior of line-width variation with aperture size. The model shows that the line width increases with increasing aperture size for NGC 3245, and the FWHM decreases with increasing aperture size for NGC 3998. The additional plots in each column are the results of using a single STIS slit, at an orientation that is aligned along the major or minor axis of the gaseous disk. Clearly, the orientation of the single slit not only affects the numerical values of the line widths, but also the general behavior of the line-width variation with aperture size, as can be seen in NGC 3245. In both cases, the disk models always produced a monotonic trend with line width, either an increasing or decreasing line width with increasing aperture size.
These models demonstrate how either an increasing or decreasing line width with increasing aperture size can be seen for gravitationally dominated gas. NGC 3245 contains a massive bulge that produces large circular velocities at distances far from the nucleus. While this is also true for NGC 3998, NGC 3245 has a flatter emission-line surface brightness profile with relatively more flux at larger radii than in NGC 3998, as can be seen in Figure 3. Additionally, the gaseous disk in NGC 3245 is highly inclined at i = , and the disk in NGC 3998 is less inclined with i = . The combination of the flatter surface brightness profile, the highly inclined disk, and the massive bulge of NGC 3245 results in the contribution of a significant amount of gas with large circular velocities further away from the nucleus. Consequently, the line width increases with increasing aperture size.
Therefore, based upon the results of the toy model and the analysis of the observational data, the overall behavior of line width with aperture size is not a unique indicator of the kinematic state of the gas. Outflowing gas can give an increasing line width with aperture size, as seen in NGC 1052 and NGC 3227, but decelerating outflows could produce a decreasing trend in line width with aperture size as discussed by Rice et al. (2006). Similarly, rotation can generate either a decreasing or increasing line width with increasing aperture size. Thus, while the Rice et al. (2006) results are useful for identifying which aperture sizes yield similar stellar and gas line widths, our results show that measurements such as these are not necessarily useful as an indicator of whether the line widths are primarily virial in origin.
Finally, many previous studies have examined the possible role of outflows and nongravitational motions to explain the scatter in the – relationship. However, our modeling and data have shown that, even for galaxies whose NLR gas is in overall rotation and dominated by virial motion, the gas line widths can differ significantly from the stellar velocity dispersion, as seen in NGC 3245 and NGC 3998. We find that the gaseous disk inclination, the surface brightness distribution, and the aperture size and shape are important factors that also most likely contribute to the scatter seen in the – relationship.
6. Conclusions
We have used STIS data to measure detailed velocity, velocity dispersion, flux, and line-intensity ratio information within pc from the nucleus of 14 nearby galaxies. All of the galaxies harbor low-luminosity AGNs, 13 of which are classified as LINERs and one of which is a Seyfert. We see a large diversity in the velocity fields of the 14 galaxies, where simple disk rotation is not a common state. Only a few galaxies have definite disk rotation, while some others have possible disk rotation but the emission-line S/N is too low to clearly determine the kinematic state of the gas. Some velocity fields are dominated by irregular motions, some show an overall rotation but with large random components, and others clearly exhibit outflows. Dynamical modeling of NGC 2911 and NGC 4594 to determine black hole masses may be possible and worthwhile, although chaotic and disorganized motion will limit the accuracy of mass measurements.
Through the [S II] /[S II] diagnostic, we were able to detect significant electron-density gradients in four (NGC 1052, NGC 3998, NGC 4278, and NGC 4579) of the five LINERs having a sufficient S/N. Moreover, the electron-density gradients in these objects share a similar shape that can be described by a power law with a slope of . A similar increase near the nucleus was seen in the [O I]/[S II] line ratio for the first three of these galaxies. These results demonstrate that density gradients within the inner pc are common in type 1 LINERs. This is consistent with expectations from photoionization models of LINERs and from ground-based detections of correlations between line width and ncrit in LINERs. We find that the density gradients persist in NGC 1052 and over a portion of the NLR in NGC 3227, even in the presence of strong outflows that clearly have a large impact on the NLR gas as seen through the disorganized velocity fields with multiple velocity components. We also see evidence for correlations between line width and ncrit in most LINERs even on the 01 scales probed by STIS.
Measurements of the STIS spectra additionally provided a means to study the [N II] narrow-line width variation with spectrograph aperture size. For most galaxies in our sample, the emission-line velocity dispersion peaks within the black hole sphere of influence, then decreases in larger apertures, approaching the bulge stellar velocity dispersion. This trend is consistent with, but does not uniquely imply, virial motion. The increasing line width with aperture size seen in NGC 1052 and NGC 3227 is due to the outflows that dominate the NLR kinematics. In NGC 3245, the increase is the result of the combination of the galaxy’s fairly flat emission-line surface brightness profile, the galaxy’s massive bulge, and the highly inclined gaseous disk. NGC 3245 demonstrates that even gas in pure disk rotation can exhibit an increasing line width as a function of aperture size.
While work by Boroson (2005) and Greene & Ho (2005) provide evidence for a connection between the Eddington ratio and kinematic disturbance in the NLR, which may reflect an underlying trend of outflow-dominated NLRs being more predominant at high AGN luminosities, our sample of galaxies is too small and does not span a sufficiently wide luminosity range to arrive at such a conclusion. Since such a relationship would be helpful in understanding AGN feedback and the effects on host-galaxy properties, further investigation, ideally with IFU data on a much larger sample of AGNs spanning a wide range of luminosities, is needed.
7. Acknowledgments
This material is based upon work supported by the National Science Foundation under Grants AST–0548198 and AST–0607485. Additional funding was provided by NASA grant GO-7403 from the Space Telescope Science Institute (STScI), which is operated by the Association of Universities for Research in Astronomy, Inc., under NASA contract NAS5-26555. This research has made use of the NASA/IPAC Extragalactic Database (NED) which is operated by the Jet Propulsion Laboratory, California Institute of Technology, under contract with NASA. The data presented in this paper were obtained from the Multimission Archive at STScI (MAST); support for MAST for non-HST data is provided by the NASA Office of Space Science via grant NAG5-7584 and by other grants and contracts.
References
- Arribas & Mediavilla (1994) Arribas, S., & Mediavilla, E. 1994, ApJ, 437, 149
- Atkinson et al. (2005) Atkinson, J. W., et al. 2005, MNRAS, 359, 504
- Barth et al. (1999) Barth, A. J., Filippenko, A. V., & Moran, E. C. 1999, ApJ, 525, 673
- Barth et al. (2001a) Barth, A. J., Ho, L. C., Filippenko, A. V., Rix, H.-W., & Sargent, W. L. W. 2001a, ApJ, 54, 205
- Barth et al. (2001b) Barth, A. J., Sarzi, M., Rix, H.-W., Ho, L. C., Filippenko, A. V., & Sargent, W. L. W. 2001b, ApJ, 555, 685
- Beifiori et al. (2007) Beifiori, A., Corsini, E. M., Dalla Bonta, E., Pizzella, A., Coccato, L., Sarzi, M., & Bertola, F. 2007, preprint (astro-ph/0709.0866v2)
- Bender et al. (1994) Bender, R., Saglia, R. P., & Gerhard, O. E. 1994, MNRAS, 269, 785
- Boroson (2005) Boroson, T. 2005, AJ, 130, 381
- Capetti et al. (1996) Capetti, A., Axon, D. J., Macchetto, F., Sparks, W. B., & Boksenberg, A. 1996, ApJ, 469, 554
- Cinzano et al. (1999) Cinzano, P., Rix, H.-W., Sarzi, M., Corsini, E. M., Zeilinger, W. W., & Bertola, F. 1999, MNRAS, 307, 433
- Crenshaw & Kraemer (2000) Crenshaw, D. M., & Kraemer, S. B. 2000, ApJL, 532, L101
- Davies & Illingworth (1986) Davies, R. L., & Illingworth, G. D. 1986, ApJ, 302, 234
- Davies et al. (2006) Davies, R. I., et al. 2006, ApJ, 646, 754
- de Francesco et al. (2006) de Francesco, G., Capetti, A., & Marconi, A. 2006, A&A, 460, 439
- de Francesco et al. (2008) de Francesco, G., Capetti, A., & Marconi, A. 2008, A&A, in press (astro-ph/0801.0064)
- de Vaucouleurs et al. (1991) de Vaucouleurs, G., de Vaucouleurs, A., Corwin, H. G., Buta, R. J., Paturel, G., & Fouque, P. 1991, Third Reference Catalogue of Bright Galaxies (New York: Springer-Verlag)
- di Nella et al. (1995) di Nella, H., Garcia, A. M., Garnier, R., & Paturel, G. 1995, A&AS, 113, 151
- Dopita & Sutherland (1995) Dopita, M. A., & Sutherland, R. S. 1995, ApJ, 455, 468
- Dumas et al. (2007) Dumas, G., Mundell, C. G., Emsellem, E., & Nagar, N. M. 2007, MNRAS, 379, 1249
- Emsellem & Ferruit (2000) Emsellem, E., & Ferruit, P. 2000, A&A, 357, 111
- Faber et al. (1989) Faber, S. M., Wegner, G., Burstein, D., Davies, R. L., Dressler, A., Lynden-Bell, D., & Terlevich, R. J. 1989, ApJS, 69, 763
- Ferland & Netzer (1983) Ferland, G. J., & Netzer, H. 1983, ApJ, 264, 105
- Ferland et al. (1998) Ferland, G. J., Korista, K. T., Verner, D. A., Ferguson, J. W., Kingdon, J. B., & Verner, E. M. 1998, PASP, 110, 761
- Ferrarese & Merritt (2000) Ferrarese, L., & Merritt, D. 2000, ApJL, 539, L9
- Ferrarese & Ford (2005) Ferrarese, L., & Ford, H. 2005, Space Sci. Rev., 116, 523
- Filippenko (1985) Filippenko, A. V., 1985, ApJ, 289, 475
- Filippenko & Halpern (1984) Filippenko, A. V., & Halpern, J. P. 1984, ApJ, 285, 458
- Filippenko & Sargent (1988) Filippenko, A. V., & Sargent, W. L. W. 1988, ApJ, 324, 134
- Fisher (1997) Fisher, D. 1997, AJ, 113, 950
- Fosbury et al. (1978) Fosbury, R. A. E., Mebold, U., Goss, W. M., & Dopita, M. A. 1978, MNRAS, 183, 549
- García-Lorenzo et al. (2001) García-Lorenzo, B., Mediavilla, E., & Arribas, S. 2001, Ap&SS, 276, 1121
- Gebhardt et al. (2000) Gebhardt, K., et al. 2000, ApJL, 539, L13
- Giroletti et al. (2005) Giroletti, M., Taylor, G. B., & Giovannini, G. 2005, ApJ, 622, 178
- González Delgado & Pérez (1996) González Delgado, R. M., & Pérez, E. 1996, MNRAS, 281, 1105
- González Delgado & Pérez (1997) González Delgado, R. M., & Pérez, E. 1997, MNRAS, 284, 931
- Greene & Ho (2005) Greene, J. E., & Ho, L. C. 2005, ApJ, 627, 721
- Halpern & Steiner (1983) Halpern, J. P., & Steiner, J. E. 1983, ApJL, 269, L37
- Heckman (1980) Heckman, T. M. 1980, A&A, 87, 152
- Hernquist (1990) Hernquist, L. 1990, ApJ, 356, 359
- Hicks & Malkan (2007) Hicks, E. K. S. & Malkan, M. A. 2007, ApJ, in press (astro-ph/0707.0611)
- Ho et al. (1993) Ho, L. C., Filippenko, A. V., & Sargent, W. L. W. 1993, ApJ, 417, 63
- Ho et al. (1997a) Ho, L. C., Filippenko, A. V., & Sargent, W. L. W. 1997a, ApJS, 112, 315
- Ho et al. (1997b) Ho, L. C., Filippenko, A. V., Sargent, W. L. W., & Peng, C. Y. 1997b, ApJS, 112, 391
- Ho (1999) Ho, L. C. 1999, ApJ, 516, 672
- Ho et al. (2002) Ho, L. C., Sarzi, M., Rix, H.-W., Shields, J. C., Rudnick, G., Filippenko, A. V., & Barth, A. J. 2002, PASP, 114, 137
- Ho et al. (2003) Ho, L. C., Filippenko, A. V., & Sargent, W. L. W. 2003, ApJ, 583, 159
- Hopkins et al. (2006) Hopkins, P. F., Hernquist, L., Cox, T., Di Matteo, T., Robertson, B., & Springel, V. 2006, ApJS, 163, 1
- Kaiser et al. (2000) Kaiser, M. E., et al. 2000, ApJ, 528, 260
- Kormendy et al. (1996) Kormendy, J., et al. 1996, ApJL, 473, L91
- Kormendy & Gebhardt (2001) Kormendy, J. & Gebhardt, K. 2001, in The 20th Texas Symposium on Relativistic Astrophysics, ed. H. Martel and J. C. Wheeler (Melville: AIP), 363
- Koski & Osterbrock (1976) Koski, A. T., & Osterbrock, D. E. 1976, ApJL, 203, L49
- Krist & Hook (2004) Krist, J., & Hook, R. 2004, The Tiny Tim User’s Guide (Baltimore:STScI)
- Laor (2003) Laor, A. 2003, ApJ, 590, 86
- Mould et al. (2000) Mould, J. R. 2000, ApJ, 529, 786
- Nelson & Whittle (1995) Nelson, C. H. & Whittle, M. 1995, ApJS, 99, 67
- Nelson & Whittle (1996) Nelson, C. H. & Whittle, M. 1996, ApJ, 465, 96
- Nelson et al. (2000) Nelson, C. H., Weistrop, D., Hutchings, J. B., Crenshaw, D. M., Gull, T. R., Kaiser, M. E., Kraemer, S. B., & Lindler, D. 2000, ApJ, 531, 257
- Neumayer et al. (2007) Neumayer, N., Cappellari, M., Reunanen, J., Rix, H.-W., van der Werf, P. P., de Zeeuw, P. T., & Davies, R. I. 2007, ApJ, 671, 1329
- Nicholson et al. (1998) Nicholson, K. L., Reichert, G. A., Mason, K. O., Puchnarewicz, E. M., Ho, L. C., Shields, J. C., & Filippenko, A. V. 1998, MNRAS, 300, 893
- Pelat et al. (1981) Pelat, D., Alloin, D., & Fosbury, R. A. E. 1981, MNRAS, 195, 787
- Peterson (1997) Peterson, B. M. 1997, An Introduction to Active Galactic Nuclei (Cambridge:Cambridge University Press)
- Pogge et al. (2000) Pogge, R. W., Maoz, D., Ho, L. C., & Eracleous, M. 2000, ApJ, 532, 323
- Raimond et al. (1981) Raimond, E., Faber, S. M ., Galagher, J. S., & Knapp, G. R. 1981, ApJ, 246, 708
- Reunanen et al. (2002) Reunanen, J., Kotilainen, J. K., & Prieto, M. A. 2002, MNRAS, 331, 154
- Rice et al. (2006) Rice, M. S., Martini, P., Greene, J. E., Pogge, R. W., Shields, J. C., Mulchaey, J. S., & Regan, M. W. 2006, ApJ, 636, 654
- Salviander et al. (2007) Salviander, S., Shields, G. A., Gebhardt, K., & Bonning, E. W. 2007, ApJ, 662, 131
- Sarzi et al. (2002) Sarzi, M., et al. 2002, ApJ, 567, 237
- Sarzi et al. (2006) Sarzi, M., et al. 2006, MNRAS, 366, 1151
- Schinnerer et al. (2000) Schinnerer, E., Eckart, A., & Tacconi, L. J. 2000, ApJ, 533, 826
- Schulz & Henkel (2003) Schulz, H., & Henkel, C. 2003, A&A, 400, 41
- Shields et al. (2003) Shields, G. A., Gebhardt, K., Salviander, S., Wills, B. J., Xie, B., Brotherton, M. S., Yuan, J., & Dietrich, M. 2003, ApJ, 583, 124
- Shields et al. (2007) Shields, J. C., et al. 2007, ApJ, 654, 125
- Sijacki et al. (2007) Sijacki, D., Springel, V., Di Matteo, T., & Hernquist, L. 2007, MNRAS, 380, 877
- Springel et al. (2005) Springel, V., Di Matteo, T., & Hernquist, L. 2005, MNRAS, 361, 776
- Sugai et al. (2005) Sugai, H., et al. 2005, ApJ, 629, 131
- Terlevich et al. (1990) Terlevich, E., Diaz, A. I., & Terlevich, R. 1990, MNRAS, 242, 271
- Tonry & Davis (1981) Tonry, J. L., & Davis, M. 1981, ApJ, 246, 666
- Tremaine et al. (2002) Tremaine, S., et al. 2002, ApJ, 574, 740
- van der Marel & van den Bosch (1998) van der Marel, R. .P., & van den Bosch, F. C. 1998, AJ, 116, 2220
- van der Marel et al. (1994) van der Marel, R. P., Rix, H.-W., Carter, D., Franx, M., White, S. D. M., & de Zeeuw, T. 1994, MNRAS, 268, 521
- van Dokkum (2001) van Dokkum, P. G. 2001, PASP, 113, 1420
- Verdoes Kleijn et al. (2000) Verdoes Kleijn, G. A., van der Marel, R. P., Carollo, C. M., & de Zeeuw, P. T. 2000, AJ, 120, 1221
- Verdoes Kleijn et al. (2006) Verdoes Kleijn, G. A., van der Marel, R. P., & Noel-Storr, J. 2006, AJ, 131, 1961
- Wegner et al. (2003) Wegner, G., et al. 2003, AJ, 126, 2268
- White et al. (1983) White, S. D. M., Huchra, J., Latham, D., & Davis, M. 1983, MNRAS, 203, 701
- Whittle (1992) Whittle, M. 1992, ApJS, 79, 49
| Galaxy | Morphological | Spectroscopic | log (H) | References | ||||
|---|---|---|---|---|---|---|---|---|
| Type | (km s-1) | (Mpc) | Classification | (km s-1) | () | (ergs s-1) | for | |
| NGC | E | L | ||||||
| NGC | S0 | L | ||||||
| NGC | S0 pec | L | ||||||
| NGC | SAB pec | S | aaDavies et al. 2006. | |||||
| NGC | S0 | T: | bbBarth et al. 2001b. | |||||
| NGC | S0 | L | ccde Francesco et al. 2006. | |||||
| NGC | S0 | L | ||||||
| NGC | E | L | ||||||
| NGC | SABb | SL | ||||||
| NGC | Sa | L | ddKormendy et al. 1996. | |||||
| NGC | E | L | eede Francesco et al. 2008. | |||||
| NGC | S pec | L | ||||||
| NGC | Sab | L | ||||||
| IC | E | L |
Note. — Morphological types and distances are taken from the NASA Extragalactic Database (NED), where the distances are derived using the Mould et al. (2000) Virgo + Great Attractor + Shapley Supercluster Infall velocity field model. Recession velocities come from the optical line measurement of the Third Reference Catalogue of Bright Galaxies (RC3) (de Vaucouleurs et al., 1991). Spectroscopic classifications come from Ho et al. (1997a), where S = Seyfert nucleus, L = LINER, T = Transition object, and the number next the class specifies the type. Type 2 objects have no detectable broad lines, type 1.9 objects show a broad H component, and type 1.5 objects exhibit broad H and H lines. An uncertain spectroscopic classification is given by “:”. The spectral classifications marked with an asterisk were based upon whether a broad H component was seen in the data from program GO-7354 and were not taken from Ho et al. (1997a). Black hole masses, unless marked, were estimated using the Tremaine et al. (2002) relation. The black hole masses for NGC 3227, NGC 3245, NGC 3998, NGC 4594, and NGC 5077 were determined through dynamical measurements. H luminosities were calculated using the distances listed in column (4) and the H flux taken from Ho et al. (1997a) and Ho et al. (2003), except for those objects marked with a cross: NGC 1497, NGC 3227, NGC 5635, and IC 989. The H luminosities for these four objects were calculated from the flux measured within the largest aperture that could be constructed given the number of STIS slit positions for the galaxy and the number of rows from which spectra could be extracted.
| Galaxy | Program | UT Date | Aperture | Binning | Slit | Number | Separation | Exposure |
|---|---|---|---|---|---|---|---|---|
| GO ID | Orientation | of | (Arcsec) | Time | ||||
| ( ∘ E of N) | Positions | (s) | ||||||
| NGC | –– | |||||||
| NGC | –– | |||||||
| NGC | –– | |||||||
| NGC | –– | |||||||
| NGC | –– | |||||||
| NGC | –– | |||||||
| NGC | –– | |||||||
| NGC | –– | |||||||
| NGC | –– | |||||||
| NGC | –– | |||||||
| NGC | –– | |||||||
| NGC | –– | |||||||
| NGC | –– | |||||||
| IC | –– |
Note. — The exposure time column gives the average of each slit position’s exposure time for each galaxy.