Kinematics and physical properties of Southern interacting galaxies: the minor merger AM 2306-721
Abstract
We present an observational study about the effects of the interactions in the kinematics, stellar population and abundances of the components of the galaxy pair AM 2306-721. Rotation curves for the main and companion galaxies were obtained, showing a deprojected velocity amplitude of 175 km s-1 and 185 km s-1, respectively. The interaction between the main and companion galaxies was modeled using numerical N-body/hydrodynamical simulations, with the result indicating that the current stage of the merger would be about 250 Myr after perigalacticum. The spatial variation in the distribution of the stellar population components in both galaxies was analysed by fitting combinations of stellar population models of different age groups. The central region of main galaxy is dominated by an old (5-10 Gyr) population, while significant contributions from a young (200 Myr) and intermediate (1 Gyr) components are found in the disk, being enhanced in the direction of the tidal features. The stellar population of the companion galaxy is overall much younger, being dominated by components with 1 Gyr or less, quite widely spread over the whole disk. Spatial profiles of the oxygen abundance were obtained from the a grid of photoionization models using the line ratio. The disk of the main galaxy shows a clear radial gradient, while the companion galaxy presents an oxygen abundance relatively homogeneous across the disk. The absence of an abundance gradient in the secondary galaxy is interpreted in terms of mixing by gas flows from the outer parts to the center of the galaxy due to the gravitational interaction with the more massive primary.
keywords:
galaxies: general – galaxies: stellar content – galaxies: abundances – galaxies: interactions – galaxies: kinematics and dynamics – galaxies: starburst1 Introduction
It is widely accepted by some time that merging and interaction events play an important role in the formation and evolution of galaxies. Mergers change the mass function of galaxies, creating a progression from small galaxies to larger ones; the merging process can also change the morphology of the constituents, transforming gas-rich spirals in quiescent ellipticals. Interactions can also trigger a wide set of physical and morphological phenomena, such as tidal tails, bridges and shells, kinematically decoupled cores and star formation enhancements (see review of Struck 1999).
Interacting galaxies also show enhanced star formation when compared with isolated galaxies. Such enhancement was initially proposed by Larson & Tinsley (1978) to explain the wider range of optical colors found in galaxies in pairs. Since then, numerous studies have confirmed these results, especially in the central regions, through measurements of optical emission lines (Kennicutt & Keel, 1984; Kennicutt et al., 1987; Donzelli & Pastoriza, 1997; Barton Gillespie et al., 2003; Woods & Geller, 2007), infrared emission (Joseph & Wright, 1985; Sekiguchi & Wolstencroft, 1992; Geller et al., 2006) and radio emission (Hummel, 1981). Recent studies have also shown that this enhancement is a function of the projected galaxy pair separation (e.g. Barton et al. 2000; Lambas et al. 2003; Nikolic et al. 2004), being stronger in low-mass than in high-mass galaxies (e.g. Woods & Geller 2007; Ellison et al. 2008). In particular, Ellison et al. (2008) found that the star formation rate as measured by the H equivalent width for galaxies in pairs selected from the Sloan Digital Sky Survey, is some 70% higher when compared to a control sample of galaxies with equal stellar mass distribution.
There is a connection between the interaction strength and the morphological distortion in binary galaxies. According to Mihos & Hernquist (1996) models, the response of the gas to a close passage depends dramatically on the mass distribution of the galaxy, with the irregularities in the gas velocity field tracing the disturbances in the gravitational potential of the galaxy as observed, for example, in some galaxies in the Virgo cluster (Rubin et al., 1999). Combined N-body/hydrodynamic simulations show that galaxy-galaxy mergers disturb the gas velocity field significantly, and hence lead to asymmetries and distortions in the rotation curves (Kronberger et al., 2006). However, according to these authors, no severe distortions are observable about 1 Gyr after the first encounter.
The gas motions created by the interaction can also significantly alter the chemical state of the galaxies (Koeppen & Arimoto, 1990; Dalcanton, 2007), and modify the usually smooth radial metallicity gradient often found in isolated disk galaxies (Henry & Worthey, 1999). Recently, Kewley et al. (2006) found that O/H abundance in the central region of nearby galaxy pairs is systematically lower that that of isolated objects. These authors suggest that the lower metallicity is a consequence of gas infall caused by the interaction, but very few observational studies have been published analysing in detail the influence of different levels of interactions in the metallicity distribution and enrichment properties of galaxies.
Ferreiro & Pastoriza 2004 (hereafter FP04), in a study of the integrated photometry and star formation activity in a sample of interacting systems from the Arp-Madore catalogue (Arp & Madore, 1987), found that the galaxies involved have bluer colours than those of isolated galaxies of the same morphological type, indicating an enhancement of star forming activity. This enhancement was also previously suggested by Donzelli & Pastoriza (1997) to explain the slightly larger values of H\textN ii equivalent widths found in these systems, when compared with normal isolated spiral galaxies. From their sample, we have selected several systems to start a more comprehensive study of the effects of the interactions in the kinematics, stellar population and abundances of the galaxies in the so-called “minor merger” systems, defined here as physical pairs with mass ratio in the range of .
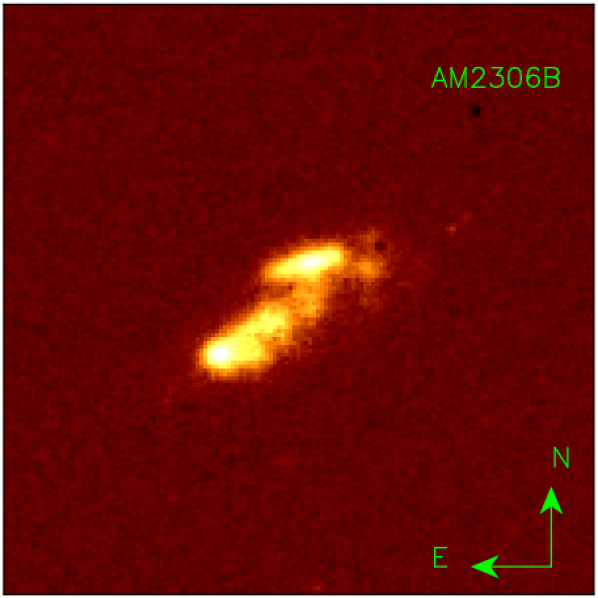
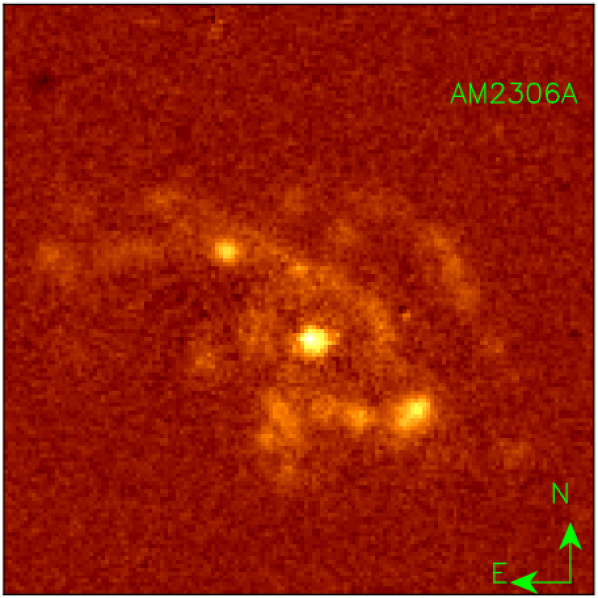
This paper presents the results for the system AM 2306-721. This pair is composed by a peculiar spiral with disturbed arms (hereafter, AM 2306A) in interaction with an irregular galaxy (hereafter, AM 2306B). Both galaxies contain very luminous \textH ii regions with H luminosity in the range of L(Herg s-1 as estimated from H images (Ferreiro et al., 2008); and high star formation rate in the range of 0.07 to 10 /yr (Ferreiro et al., 2008). The present paper is organized as follows: in Section 2, we summarize the observations and data reduction. Section 3 describes the gas kinematics of each galaxy and Section 4 present the numerical N-body/hydrodynamical simulations of the interaction. Section 5 presents the stellar population synthesis. The metallicity analysis is presented in Section 6, and the conclusions are summarized in Section 7.
2 Observations and data reduction
Long slit spectroscopic data was obtained in 20/21 June 2006 and 23/24 June 2007 with the Gemini Multi-Object Spectrograph at Gemini South, as part of poor weather programmes GS-2006A-DD-6 and GS-2007A-Q-76. Spectra in the range 3 350 to 7 130Å were taken in two settings with the B600 grating, and the 1 slit, yielding a spectral resolution of 5.5Å. The frames were binned on-chip by 4 and 2 pixels in the spatial and spectra directions, respectively, resulting in a spatial scale of 0.288 pxl-1, and 0.9Å pxl-1 dispersion.
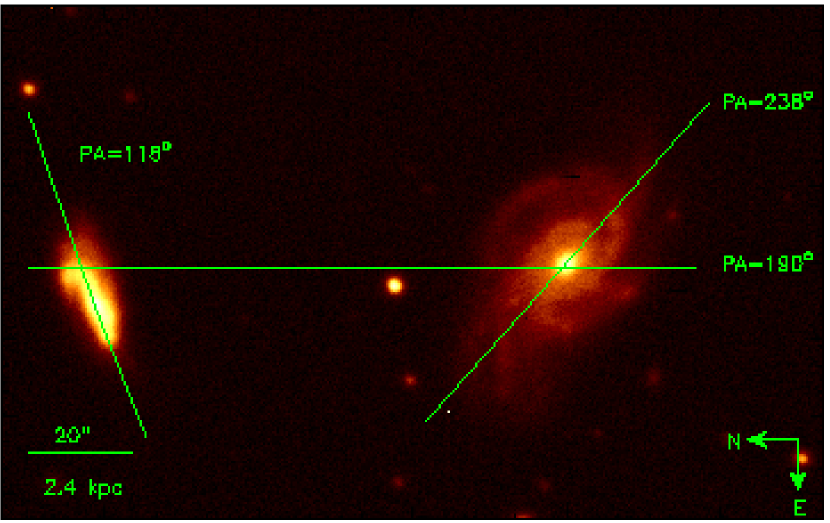
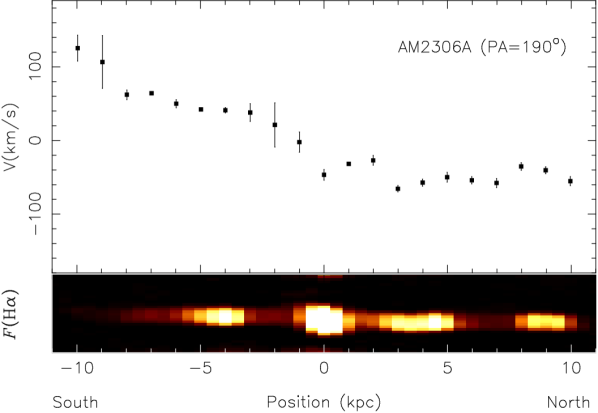
Spectra were taken at three different position angles on the sky: PA=238 and PA=118 corresponding to positions along the major axis of AM 2306A and AM 2306B, respectively; and PA=190, a position cutting across the disk of both galaxies. The exposure time on each single frame was limited to 700 seconds to minimize the effects of cosmic rays, with four frames being obtained for each slit position to achieve suitable signal. The slit positions are shown in Fig. 1, superimposed on the -band image of the pair. Table 1 gives the journal of observations. Conditions during both runs were not photometric, with thin cirrus and image quality in the range 1.0 to 2.5 (as measured from stars in the acquisition images taken just prior to the spectroscopic observations).
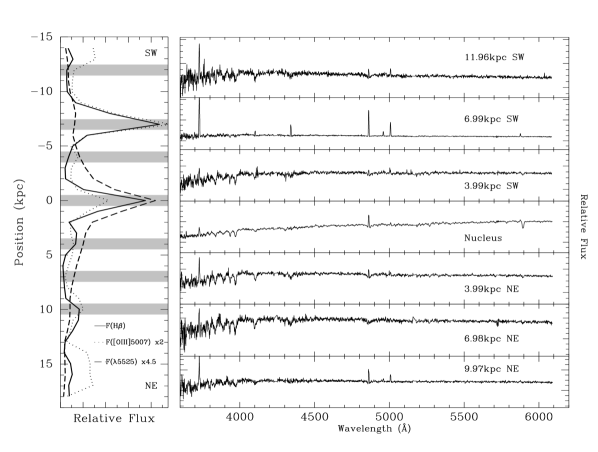
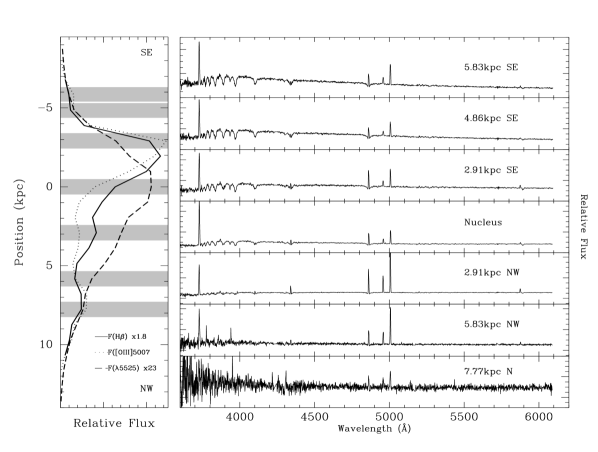
The spectroscopic data reduction was carried out using the gemini.gmos package as well as generic IRAF tasks. We followed the standard procedure for bias correction, flat-fielding, cosmic ray cleaning, sky subtraction, wavelength and relative flux calibrations. In order to increase the signal-to-noise ratio, the spectra were then extracted summing over six rows. Each spectrum thus represents an aperture of 1. For a distance of 119 Mpc for AM 2306A, and 116 Mpc for AM 2306B, (estimated from the radial velocities derived in Section 3 and adopting =75 km s-1 Mpc-1), this aperture corresponds to a region of 577 998 pc2 for AM 2306A; and 562 972 pc2 for AM 2306B. The nominal centre of each slit was chosen to be the continuum peak at . Fig. 3 and 4 shows a sample of spectra of AM 2306A and AM 2306B extracted along the slit for PA=238 and PA=118, respectively.
| Date (UT) | Exposure time(s) | PA (°) | |
|---|---|---|---|
| 2006/06/20 | 4700 | 190 | 4280-7130 |
| 2006/06/20 | 4700 | 238 | 4280-7130 |
| 2007/06/24 | 4700 | 190 | 3350-6090 |
| 2007/06/24 | 4700 | 238 | 3350-6090 |
| 2007/06/24 | 4700 | 118 | 3350-6090 |
3 Ionized gas kinematics
The radial velocity was estimated from the strongest emission lines present in the spectra, namely , ,[\textO iii] , , [\textN ii] , and [\textS ii] . The final radial velocity for each spectrum was obtained by averaging the individual measurements from the detected emission lines, and the errors estimated from the standard deviation of these measurements around that mean.
Using the acquisition images in the filter, we did a simple isophote fitting using the stsdas.ellipse task to obtain the position angle of the major and minor axes of both galaxies. We found that the major axis for AM2306A is at PA=, and for AM2306B at PA=. The inclination of each galaxy with respect to the plane of the sky was also computed as , where and are the minor and major semi-axes of the galaxy, respectively. We obtained for the main galaxy and for the secondary, in agreement with the values measured by FP04.
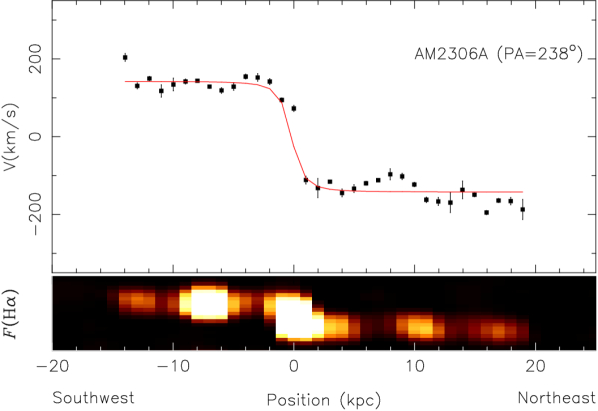
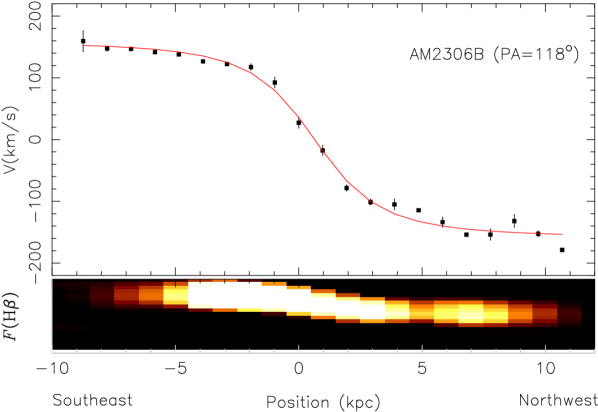
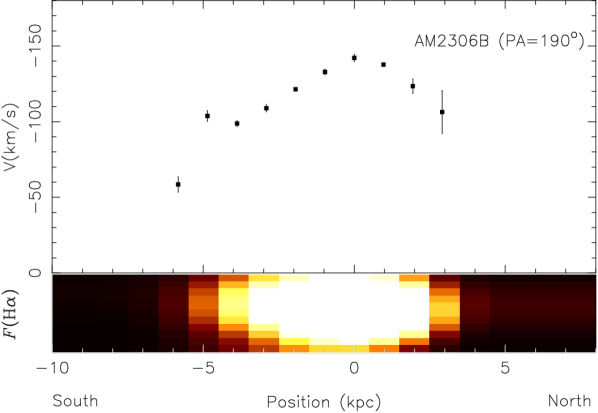
The rotation curves along the observed slit positions for both galaxies are presented in Figure 5, as well as the coresponding two-dimentsional spectra of H and/or H emission lines. The radial velocity values after subtraction of the systemic velocities (as determined from the rotation model described below) are listed in Table 3.
Both galaxies show a fairly symmetric rotation curve, so we adopted a very simple approximation for the observed velocity distribution, assuming that the gas moves under a logarithmic gravitational potential, following circular orbits close to a plane , characterized by its inclination to the plane of the sky and the position angle (PA) of the line of nodes . This assumption results in an observed radial circular velocity in the plane of the sky given by Bertola et al. (1991):
| (1) |
with
| (2) |
where is the systemic velocity, is the radius in the plane of the galaxy and and are parameters that define the amplitude and shape of the curve. The fit of the rotation curves for each galaxy are shown in Fig. 5 and the parameters obtained are listed in Table 2.
| AM 2306A (PA=238°) | AM 2306B (PA=118°) | ||
|---|---|---|---|
| Parameter | Model | Model | |
| (km/s) | 89195 | 86693 | |
| (km/s) | 175 | 185 6 | |
| (kpc) | 10.3 | 1.6 0.2 |
| AM 2306A | AM 2306B | |||||||||
| PA=238o | PA=190o | PA=118o | PA=190o | |||||||
| R (kpc) | V (km/s) | R (kpc) | V (km/s) | R (kpc) | V (km/s) | R (kpc) | V (km/s) | |||
| 13.96 SW | 20410 | 13.96 S | … | … | … | … | … | |||
| 12.96 SW | 1318 | 12.96 S | … | … | … | … | … | |||
| 11.96 SW | 1505 | 11.96 S | … | … | … | … | … | |||
| 10.97 SW | 11816 | 10.97 S | … | … | … | … | … | |||
| 9.97 SW | 13416 | 9.97 S | 12518 | … | … | … | … | |||
| AM 2306A | AM 2306B | |
| Number of points in disk | 2048 | 2048 |
| Disk mass | 0.5 | 0.17 |
| Disk radial scale length | 0.6 | 0.6 |
| Disk vertical scale thickness | 0.06 | 0.05 |
| Reference radius Rref | 0.06 | 1.2 |
| Toomre Q at Rref | 1.5 | 1.5 |
| Number of points in gas disk | 2048 | 2048 |
| Gas disk mass | 0.05 | 0.017 |
| Gas disk radial scale length | 1.0 | 0.75 |
| Gas disk vertical scale thickness | 0.02 | 0.03 |
| Toomre Q at Rref | 1.5 | 1.5 |
| Number of points in bulge | 256 | 256 |
| Bulge mass | 0.08 | 0.01 |
| Bulge radial scale length | 0.1 | 0.06 |
| Number of points in spherical halo | 2048 | 2048 |
| Halo mass | 3.5 | 1.7 |
| Halo cutoff radius | 8.0 | 4.0 |
| Halo core radius | 2.5 | 0.6 |
Notes: Simulations were done in a system of units with G=1. Model units scale to physical ones as: unit length is 3.5 kpc, unit velocity is 262 km s-1, unit mass is and unit time is 13.062 Myr.
The heliocentric velocity of the main galaxy is found to be 8 919 km s-1. The rotation curve obtained for AM 2306A along PA=238° is well represented by the simple model above. This rotation curve is typical of spiral disks, rising shallowly and flattening at an observed amplitude of 145 km s-1. As can be seen in Fig.5, there are pronounced velocity features indicating local deviations from a smooth rotational field. One of such well defined features is located towards the northeast along PA=238°, at about 8 kpc projected distance from the nucleus, with an amplitude (peak-to-peak) of about 100 km s-1. This feature is located where the slit crosses the the outer spiral arm as seen in the image (Fig. 2, right). This image also makes more obvious the disturbed spiral structure of the main component, very likely due to the interaction with AM 2306B.
For the secondary galaxy, the rotation curve model results in an heliocentric velocity of 8 669 km s-1. The observed radial velocities along PA=118° are also very well represented by the model. The rotation curve is quite similar to that of AM 2306A, rising shallowly and flattening at an observed amplitude of about 158 km s-1. Although the young star forming population of the secondary galaxy show clear morphological irregularities (Fig. 2, left), the rotation curve does not present significant deviations from the smooth representation of the velocity field.
Donzelli & Pastoriza (1997) estimated systemic velocities of 8 762 and 9 069 km s-1 for AM2306A and AM2306B, respectively. Following our results, we verified that the values presented by those authors were reversed, and therefore our estimates are found to agree to within 2 % with those previous determinations.
An estimate of the dynamical mass can be derived by assuming that the mass inside a certain radius is given by . For the main galaxy, the deprojected velocity amplitude is 175 km s-1 and its dynamical mass is within a radius of 18 kpc. For the companion galaxy, the deprojected velocity amplitude is 185 km s-1 and the dynamical mass within a radius of 10.7 kpc is . It is important to emphasize that the maximum radius to which we can observe the gas in emission is quite certainly smaller than the total radius of the galaxies, so our estimates of the dynamical mass give a lower limit to the actual dynamical mass of each system.
In determining the dynamical mass, the main source of error is in the estimation of the deprojected velocity, which in turn is highly dependent on the assumed inclination of the galaxies with respect to the plane of the sky. For AM 2306A the inclination angle is well determined from the isophote fitting, with an estimated error of about 1%, propagating to a 2% uncertainty in the resulting total mass. For AM 2306B, the irregular morphology of the disk in optical images implies that the calculated value of the inclination angle varies significantly with radius. In this case, if we considered the isophote fitting from the regions more perturbed of AM 2306B to estimate the inclination angle, a maximum angle inclination of about 12 % would be obtained, implying in a reduction of up to 18 % in the total mass.
4 Numerical Simulations
In order to reconstruct the history of the AM 2306-721 system and to predict the evolution of the encounter, we modeled the interaction between AM 2306A and AM 2306B through numerical simulations using the the N-body/SPH code GADGET-2 developed by Springel (2005). The galaxies were modeled following the prescription of Hernquist (1993), including a gaseous disk component. The observed morphology and rotation curves presented in Sec. 3 provide the constraints to the simulations.
As for any study of this kind, recreating the evolution of the AM 2306-721 system requires solving the reverse problem of calculating the orbit followed by the two galaxies from their observed properties. This, like most similar cases, is not a fully determined problem, since the observations do not provide all the necessary information to uniquely identify the solution. Therefore, in order to restrict the parameter space when setting up the initial conditions for the simulations, we first calculate orbits that satisfy the constraint given by the observed radial velocity difference, testing different eccentricities, pericenter and line-of-sight direction distances. From that subset, based on the observed morphology, we select a few orbits to run the full simulations, from which the one that best fits the observed properties is selected.
The orbit that best reproduces the observational properties is found to be hyperbolic, with an eccentricity and perigalacticum of kpc . The orbital plane is perpendicular to the plane of the sky, and intersects the later in the line that connects AM 2306A and AM 2306B as projected in the sky. In perigalacticum, AM 2306B was behind AM 2306A, along the line of sight. The parameters for the best fit model are presented in Table 4. The composite rotation curve, as well as the individual model components and observed circular velocity, corrected by the inclination of each galaxy as given in Section 3, are shown in Figure 6. The models indicate a total mass of for AM 2306A and of for AM 2306B. The mass of each individual component (disk, bulge, halo and gas) is quoted in Table 4.
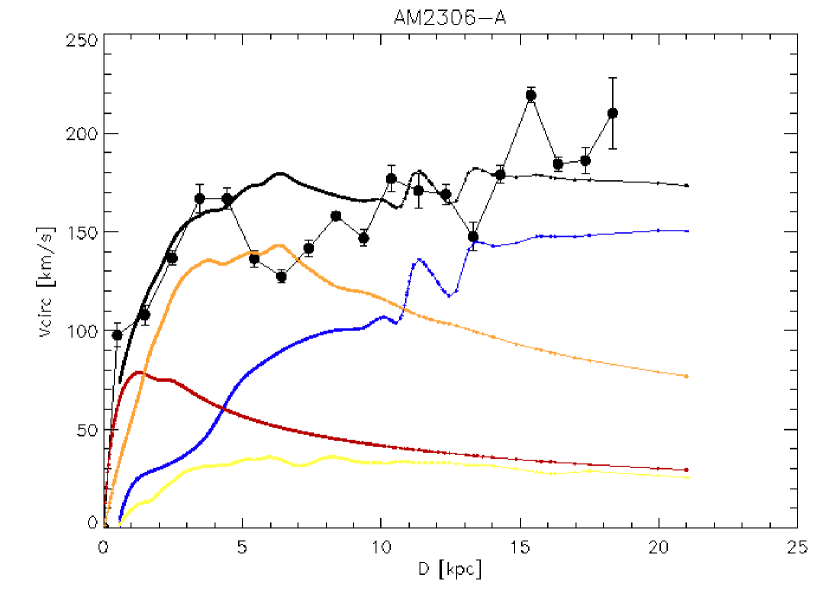
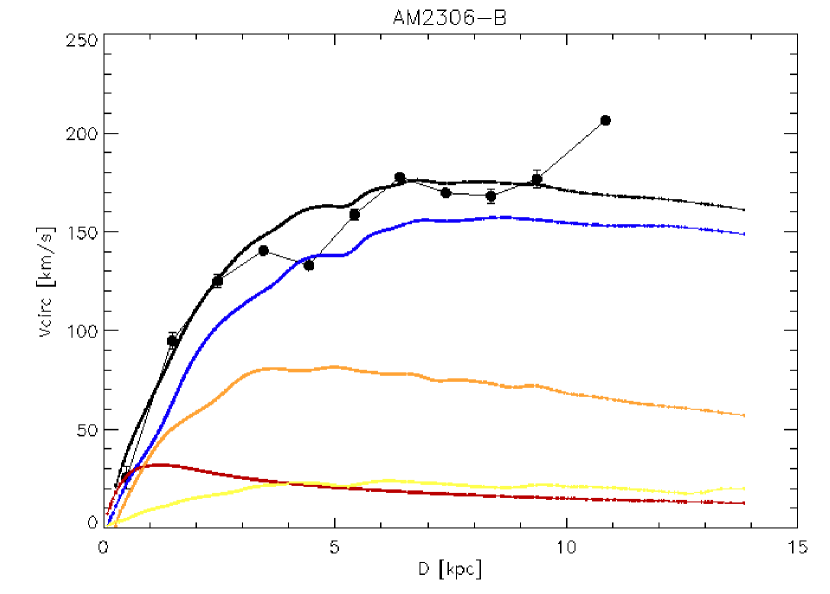
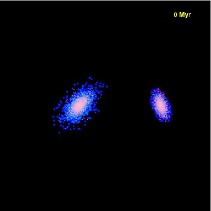
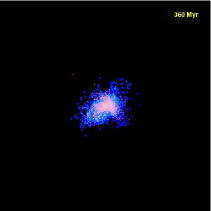
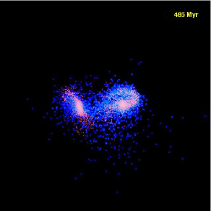
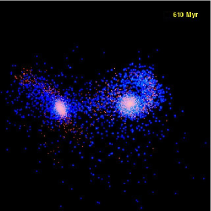
Figure 7 shows the time evolution of the encounter. Simulation starts 360 Myr before perigalacticum, and the time is shown in Myr in the upper right corner of each frame. The situation that best reproduces the morphology and kinematics of AM 2306-721 system at the current stage is Myr, or about 250 Myr after perigalacticum. The overall large scale morphology and kinematics agree well with observations, considering the low resolution of the simulation.
5 Stellar Population Synthesis
A detailed study of the star formation in minor merger galaxies is an important source of information not only on the age distribution of their stellar population components, but to better understand several aspects related to the interacting process, its effect in the properties of the individual galaxies and their later evolution. The absorption features arising from the stellar component also affect to different degrees the measured intensity of the emission line in the spectrum of the gaseous component. This effect is more prominent in, but not restricted to, the Balmer lines, so the stellar population contribution must be subtracted from each spectra in order to investigate the physical properties of the gas in these galaxies.
To investigate the star formation history of AM 2306A and AM 2306B we use the stellar population synthesis method developed by Bica (1998). This method employs the equivalent widths of several spectral absorption features and the measured continuum fluxes at different wavelengths, comparing them to those of a model computed from a base of simple stellar population (SSP) elements with known ages and metallicities. The algorithm generates all possible combinations of the base elements according to a given flux contribution step and compares the resulting and continuum points to the input ones. The allowed solutions are those which reproduce, within predefined limits, the observed and . All these possible solutions are then averaged, and this average is adopted as the final synthesis, with the uncertainty for each individual age component given by the standard deviation of the contribution from each allowed solution around the mean adopted value. The code used here is based on an upgraded version of the one presented by Schmitt et al. (1996), and includes a correction for the effect of the internal extinction.
The spectral windows for measuring are those defined in the Lick system (Worthey & Ottaviani, 1997; Trager et al., 1998), with the addition of the K \textCa ii (corresponding to the spectral window )), and H11 lines (spectral window ). Previous to the measurements of the and the spectra were corrected by the foreground (Galactic) reddening of mag taken from Schlegel et al. (1998); and normalized to Å. The were measured using the PACCE code kindly provided by Vale et al. (2007). The values measured for each galaxy at different galactocentric distances and position angles are listed in Table 5.
The SSP base was created from the Bruzual & Charlot (2003) evolutionary stellar population models, which are based on a high resolution library of observed stellar spectra. This library allows us to derive detailed spectral evolution of simple stellar populations across the wavelength range of 3 200 to 9 500 with a wide range of metallicities. We used the Padova 1994 tracks as recommended by Bruzual & Charlot (2003), with the initial mass function of Salpeter (Salpeter, 1955). The final base contains five spectra corresponding to SSPs with ages of 2.5 Myr, 200 Myr, 1 Gyr, 5 Gyr and 10 Gyr, and solar metallicity. The adopted number of elements in the base was defined by a compromise between having enough age resolution, having a limited number of features available to constrain the fit, and the desire to mantain a consistent base for all apertures in both galaxies. For the few positions with higher S/N spectra in each galaxy, we tested a more detailed age grid, including components with ages 2.5 Myr, 100 Myr, 200 Myr, 500 Myr 1 Gyr, 5 Gyr and 10 Gyr, and solar metallicity. All those converged to the same results obtained with the original five component base, with the contributions from the 100 and 500 Myr populations resulting always less than 5 %.
Figure 8 show an example of the observed spectra corrected for the reddening, the synthesized spectra and the pure emission spectra. Table 6 presents the result of the stellar population synthesis for the individual spatial bins in each galaxy, stated as the percentual contribution of each base element to the flux at . The values of derived from the synthesis are also given in Table 6.
| Equivalent width (Å) | |||||||
|---|---|---|---|---|---|---|---|
| R(kpc) | G | \textFe i | \textFe i | \textFe i | NaD | ||
| AM 2306A (PA=238o) | |||||||
| 3.99 SW | 2.850.40 | … | … | … | … | 0.690.05 | 1.470.01 |
| 2.99 SW | 2.320.19 | 5.460.09 | … | 2.350.03 | … | 0.600.03 | 1.500.01 |
| 1.99 SW | … | 6.660.07 | 3.800.20 | 2.410.07 | … | 0.610.02 | 2.150.02 |
| 1.00 SW | 1.120.12 | 5.690.23 | 4.000.31 | 2.150.08 | … | 0.720.04 | 3.310.02 |
| 0 | … | 4.620.09 | 3.100.28 | 1.990.01 | … | 0.750.02 | 4.290.02 |


The spatial variations in the contributions of the stellar population components are shown in Fig. 9. Large variations in the contribution from the different age components can be seen across the disk of both galaxies. The central regions of AM 2306A are dominated by the old (5-10 Gyr) population, with some significant contribution from a young 200 Myr and intermediate 1 Gyr component of the spiral arms and the disk . On the other hand, the stellar population in AM 2306B is overall much younger, being dominated by the 2.5 Myr, 200 Myr and 1 Gyr components, which are quite widely spread over the whole disk. The star formation episode occurred about 200 Myr ago in both galaxies could be related with the perigalactic passage.
| Flux fraction at Å | ||||||
| R(kpc) | 2.5 Myr | 200 Myr | 1 Gyr | 5 Gyr | 10 Gyr | |
| AM 2306-721A (PA=238°) | ||||||
| 3.99 SW | 151 | 522 | 312 | 1562 | 1543 | 0.420.21 |
| 2.99 SW | 21 | 141 | 779 | 11 | 610 | 0.160.03 |
| 1.99 SW | 21 | 11 | 7614 | 1342 | 825 | 0.130.02 |
| 1.00 SW | 21 | 81 | 294 | 1646 | 4528 | 0.180.05 |
| 0 | 21 | 221 | 79 | 1372 | 5647 | 0.290.10 |
| 1.00 NE | 11 | 233 | 11 | 527 | 7024 | 0.060.01 |
| 1.99 NE | 31 | 12 | 798 | 1222 | 513 | 0.140.03 |
| 2.99 NE | 31 | 212 | 751 | 11 | 01 | 0.200.05 |
| 3.99 NE | 21 | 246 | 729 | 12 | 11 | 0.070.01 |
| 4.98 NE | 01 | 301 | 4911 | 719 | 142 | 0.020.01 |
| 5.98 NE | 01 | 392 | 5418 | 411 | 37 | 0.130.03 |
| 6.98 NE | 01 | 356 | 6310 | 12 | 11 | 0.140.03 |
| 7.98 NE | 01 | 501 | 3110 | 932 | 1027 | 0.220.06 |
| AM 2306-721B (PA=118°) | ||||||
| 2.91 SE | 323 | 676 | 11 | 00 | 00 | 0.400.46 |
| 1.94 SE | 433 | 555 | 01 | 11 | 11 | 0.350.37 |
| 0.97 SE | 221 | 532 | 118 | 718 | 711 | 0.390.18 |
| 0 | 162 | 474 | 1314 | 1454 | 1030 | 0.230.07 |
| 0.97 NW | 211 | 452 | 306 | 25 | 23 | 0.390.18 |
| 1.94 NW | 201 | 412 | 366 | 25 | 13 | 0.310.12 |
| 2.91 NW | 191 | 422 | 373 | 13 | 12 | 0.280.09 |
| 3.88 NW | 151 | 442 | 364 | 34 | 23 | 0.160.04 |
| 4.86 NW | 351 | 633 | 11 | 11 | 01 | 0.310.12 |
| 5.83 NW | 191 | 441 | 346 | 25 | 14 | 0.010.01 |
| 6.80 NW | 231 | 251 | 4720 | 311 | 24 | 0.020.01 |
| 7.77 NW | 161 | 462 | 365 | 14 | 12 | 0.010.01 |


6 Emission line intensities and O/H abundance
Once the stellar population contribution has been determined, the underlying absorption line spectrum can be subtracted to allow the correct measurement and analysis of the line emission from the gaseous component. The line intensities were measured using Gaussian line profile fitting on the pure emission spectra. We used the IRAF splot routine to fit the lines, with the associated error being given as , where and are the continuum rms and the Poisson error of the line flux, respectively. The residual extinction associated with the gaseous component for each spatial bin was calculated comparing the observed and ratios to the theoretical values in Hummer & Storey (1987) for an electron temperature of 10 000 and a density of 100 . The observed emission line intensities were then corrected by this residual extinction using the Howarth (1983) reddening function. Table 7 present the main emission line intensities normalized to the flux in the line. We derived the electron densities for AM 2306A from the [\textS ii] intensity ratios, using the temden routine of the nebular package from STSDAS/IRAF, assuming an electron temperature of 10 000 K. The energy levels, transition probabilities and collisional strength values for [\textS ii] were taken respectively from Bowen (1960), Keenan et al. (1993) and Ramsbottom et al. (1996). The resulting electron density obtained for AM 2306A is in the low density limit for the [\textS ii] lines, with values below , compatible with the results for both galactic (Copetti et al., 2000), and giant extragalactic \textH ii regions (Castaneda et al., 1992).
| AM 2306A (PA=238°) | |||||||||||
| R (kpc) | c(H) | [\textO ii] | \textH i | \textH i | [\textO iii] | [\textO iii] | [\textN ii] | \textH i | [\textN ii] | [\textS ii] | [\textS ii] |
| 12.96 SW | 0 | … | … | 1003 | 402 | 1184 | 224 | 28619 | 605 | 7310 | 7310 |
| 11.96 SW | 0.10 | … | 479 | 1004 | … | 724 | 297 | 28625 | 9410 | 9414 | 8614 |
| 10.97 SW | 0 | … | … | 1005 | … | 624 | 5413 | 28633 | 11717 | … | … |
| 9.97 SW | 0 | … | … | 1004 | … | 553 | … | 28627 | 12115 | … | … |
| 8.97 SW | 0 | … | … | 1003 | … | 613 | 345 | 28618 | 1018 | 894 | 654 |
| Notes: all fluxes normalized to as listed in Column 5. | |||||||||||
The spatial metallicity variations across the disk of spiral galaxies is a fundamental parameter for understanding galaxy evolution. In isolated spiral galaxies, it is often found that the metallicity in the ionized interstellar medium decreases outwards (Vila-Costas & Edmunds, 1992), while a weaker or absent metallicity gradient in interacting galaxies of similar morphological type have been pointed out as evidence of radial gas inflows driven by tidal torques generated during the interaction (Henry & Worthey, 1999; Roy & Walsh, 1997).
Determining accurate element abundances from optical spectra is critically dependent on measuring temperature sensitive line ratios, such as [\textO iii]. However, when doing spectroscopy of \textH ii regions with high metallicity and/or low excitation, temperature sensitive lines such as [\textO iii] are found to be weak or unobservable, and empirical indicators based on more easily measured line ratios have to be used to estimate metal abundances. The line ratio =([\textO ii][\textO iii] [\textO iii] H, introduced by Pagel et al. (1979) has been widely used for determination of oxygen abundance in \textH ii regions (Vila-Costas & Edmunds, 1992; Zaritsky et al., 1994; Gil de Paz et al., 2007).
Although the indicator is sensitive to abundance variations, it is double valued, presenting high to low metallicity turnover in the range of (Pilyugin & Thuan, 2005). Another critical issue regarding the use of the is the fact that it is also sensitive to the ionization level of the emission gas, especially at low metallicities. These problems can be solved, by choosing either the low or high-metallicity branch of , and combining it with another line indicator sensitive to the ionization level, such as the ratio [\textO ii]([\textO iii] (McGaugh, 1991).
Since we do not detect any temperature-sensitive emission lines in our spectra, we used the indicator to estimate the metallicity comparing the observed values with a grid of photoionization models obtained from the code Cloudy/96.03 (Ferland, 2002). The grid was built following the same procedures as Dors & Copetti (2006), with metallicities of 2.0, 1.1, 1.0, 0.6, and 0.4 , and ionization parameter , , and . The solar value of is taken from Allende Prieto et al. (2001). For each model, the ionizing source was assumed to be a stellar cluster with energy distribution obtained using the stellar population synthesis code (Leitherer et al., 1999), with an upper mass limit of 100 and an age of 2.5 Myr. Figure 10 shows the versus [\textO ii]/[\textO iii] diagramme, with the observed values superposed in the computed models. Open squares correspond to regions in AM 2306A, filled triangles to regions in AM 2306B. Most of the points indicate gas with solar or less than solar abundance, with the exception of two spatial bins in AM 2306A, corresponding to the nuclear and the 1.0 kpc NE regions. Figures 11 and 12 shows the estimated O/H abundance distribution as a function of the galactocentric distance, , for AM 2306A and AM 2306B, respectively.


The disk of the main galaxy (Fig. 11) shows a clear radial oxygen abundance gradient, that can be fitted as a linear function , where is in kpc. This abundance gradient is typical of spiral galaxies, as found in M 101 (Kinkel & Rosa, 1994; Garnett et al., 1999), and in NGC 1365 (Pilyugin et al., 2004; Dors & Copetti, 2005). For AM 2306B the oxygen abundance is relatively homogeneous across the galaxy disk, not presenting a radial oxygen abundance gradient. The observed values are in the range .
The above results are in agreement with the luminosity-metallicity relation for gas rich galaxies (e.g. Zaritsky et al. 1994; Contini et al. 2002; Lamareille et al. 2004; Tremonti et al. 2004), in the sense that more luminous objects are more metallic. To investigate if the interaction affected the gas metallicity in both galaxies, we compare the central O/H value of AM2306A and Am2306B with isolated and pair galaxies from the sample of Kewley et al. (2006). We found the central O/H value for AM2306A is in agreement with the results obtained by Kewley et al. (2006) for field galaxies at same luminosity, indicating that the interaction has not significantly affected the gas abundance in AM2306A. On the other hand, the central O/H value obtained for AM2306B is about 0.1-0.2 dex lower than those estimated by Kewley et al. (2006) for field galaxies at same luminosity, but is in good agreement with the values obtained for galaxies in pairs.
Interestingly, the mean value for AM 2306B, , is similar to the values found in the outer parts of AM 2306A. If we assume that in AM 2306B there was an oxygen abundance gradient before the encounter with AM 2306A, and that this gradient was destroyed by gas flows from the outer parts to the center of the galaxy, mixing and homogenizing the chemical composition of the interstellar medium (Kewley et al., 2006), we can estimate the fraction of infalling gas that was required to produce the metallicities that are now observed in AM 2306B. For this, we assume that, before the interaction, AM 2306B presented the same O/H gradient observed now in AM 2306A. To reduce the initial abundance of in the central region to the current mean value of 8.39, it would be necessary that the central gas was diluted so as to contain a fraction of 56% of poor gas from the outer disk plus 44% of rich gas from the central region of the galaxy.
Another possible explanation to mix the interstellar medium and flatten the radial gradient would be the presence of a bar Friedli et al. (1994). However, the very disturbed luminosity profile of this galaxy in , and images (FP04) do not show any evidence of such feature.
We can estimate the amount of ionized gas associated with the central star-forming complex in AM 2306B from the H luminosity of this region as given by Testor (2001). For kpc, we have erg s-1 (FP04), and assuming a a filling factor of , we find a mass of ionized gas of . According to the above proposed scenario, 56% of this total mass () would be infalling gas from the outer parts of the galaxy. Since we do not see any evidence of ionized gas flows in the radial velocities, we have to assume that the process of gas infall has already stopped. Considering the result of the numerical simulations, we take a timescale of 100 Myr for the infall process (the gas motions were triggered by the perigalactic passage 250Myr ago, but are no longer observable), resulting in an infall rate of /yr. This infall rate is considerably smaller than the average gas inflow rate of /yr to the central 1-2 kpc predicted by recent merger models (Iono et al., 2004).
7 Conclusions
An observational study about the effects of the interactions in the kinematics, stellar population and abundances of the galaxy pair AM 2306-721 is performed. The data consist of long-slit spectra in the wavelength range of 3 350 to 7 130Å obtained with the Gemini Multi-Object Spectrograph at Gemini South. The main findings are the following:
-
1.
Rotation curves of the main and companion galaxies with an deprojected velocity amplitude of 175 km s-1 and 185 km s-1 respectively were obtained. An estimate of the dynamical mass was derived for each galaxy, using the deprojected velocity amplitude. For the main galaxy, its dynamical mass is within a radius of 18 kpc; and for the companion galaxy, the estimated dynamical mass is within a radius of 10.7 kpc.
-
2.
In the main galaxy, radial velocity deviations from the disk rotation of about 100 km s-1 were detected, which are probably due to the interaction with the companion galaxy.
-
3.
In order to reconstruct the history of the AM 2306-721 system and to predict the evolution of the encounter, we modeled the interaction between AM 2306A and AM 2306B through numerical N-body/hydrodynamical simulations. The orbit that best reproduces the observational properties is found to be hyperbolic, with an eccentricity and perigalacticum of kpc; the current stage of the system would be about 250 Myr after perigalacticum.
-
4.
The spatial variations of the stellar population components of the galaxies were analysed by fitting combinations of stellar population models of different ages (2.5 Myr, 200 Myr, 1 Gyr, 5 Gyr and 10 Gyr) and solar metallicity. The central regions of the main galaxy are dominated by the old (5-10 Gyr) population, with some significant contribution from a young 200 Myr and intermediate 1 Gyr component along the disk of the galaxy. On the other hand, the stellar population in the companion galaxy is overall much younger, being dominated by the 2.5 Myr, 200 Myr and 1 Gyr components, which are quite widely spread over the whole disk.
-
5.
Oxygen abundance spatial profiles were obtained using a grid of photoionization models and the =([\textO ii][\textO iii] [\textO iii] H line ratio. The disk of the main galaxy shows a clear radial oxygen abundance gradient, that can be fitted as a linear function ; in the companion galaxy the oxygen abundance is relatively homogeneous across the galaxy disk, with the observed mean value of
-
6.
The absence of an abundance gradient in the secondary galaxy is interpreted as it having been destroyed by gas flows from the outer parts to the center of the galaxy.
Acknowledgments
Based on observations obtained at the Gemini Observatory, which is operated by the Association of Universities for Research in Astronomy, Inc., under a cooperative agreement with the NSF on behalf of the Gemini partnership: the National Science Foundation (United States), the Science and Technology Facilities Council (United Kingdom), the National Research Council (Canada), CONICYT (Chile), the Australian Research Council (Australia), Ministério da Ciencia e Tecnologia (Brazil) and SECYT (Argentina)
We thank O. L. Dors, R.Riffel, R.R.Riffel and C. Bonatto for helpful discussions. The authors would like to thank Volker Springel for providing them with GADGET-2. This research has been partially supported by the Brazilian institution CNPQ and PRONEX/FAPERGS(05/11476).
References
- Allende Prieto et al. (2001) Allende Prieto, C., Lambert, D. L., & Asplund, M. 2001, ApJ, 556, L63
- Arp & Madore (1987) Arp, H. C., & Madore, B. F. 1987, A Catalogue of Southern Peculiar Galaxies and Associations 2 volume set, by Halton C. Arp and Barry F. Madore, pp. 504. ISBN 0521343364. Cambridge, UK: Cambridge University Press, May 1987
- Barnes & Hernquist (1996) Barnes, J. E., & Hernquist, L. 1996, ApJ, 471, 115
- Barton et al. (2000) Barton, E. J., Geller, M. J., & Kenyon, S. J. 2000, ApJ, 530, 660
- Barton Gillespie et al. (2003) Barton Gillespie, E., Geller, M. J., & Kenyon, S. J. 2003, ApJ, 582, 668
- Bertola et al. (1991) Bertola, F., Bettoni, D., Danziger, J., Sadler, E., Sparke, L., & de Zeeuw, T. 1991, ApJ, 373, 369
- Bica (1998) Bica, E. 1988, A & A, 195, 9
- Bushouse (1986) Bushouse, H. A. 1986, AJ, 91, 255
- Bowen (1960) Bowen, I. S. 1960, ApJ, 132, 1
- Bruzual & Charlot (2003) Bruzual, G., & Charlot, S. 2003, MNRAS, 344, 1000
- Castaneda et al. (1992) Castaneda, H. O., Vilchez, J. M., & Copetti, M. V. F. 1992, A & A, 260, 370
- Contini et al. (2002) Contini, T., Treyer, M. A., Sullivan, M., & Ellis, R. S. 2002, MNRAS, 330, 75
- Copetti et al. (2000) Copetti, M. V. F.,Mallmann, J. A. H., Schmidt, A. A., & Castañeda, H. O. 2000, A & A, 357, 621
- Dalcanton (2007) Dalcanton, J. J. 2007, ApJ, 658, 941
- Donzelli & Pastoriza (1997) Donzelli, C. J., & Pastoriza, M. G. 1997, ApJS, 111, 181
- Dors & Copetti (2005) Dors, O. L., Jr., & Copetti, M. V. F. 2005, A&A, 437, 837
- Dors & Copetti (2006) Dors, O. L., Jr., & Copetti, M. V. F. 2006, A&A, 452, 473
- Dutil & Roy (1999) Dutil, Y., & Roy, J.-R. 1999, ApJ, 516, 62
- Ellison et al. (2008) Ellison, S. L., Patton, D. R., Simard, L., & McConnachie, A. W. 2008, AJ, 135, 1877
- Ferland (2002) Ferland, G. J. 2002, Hazy, a brief introduction to Cloudy 96.03, Univ. Kentucky, Dept. Phys., Astron. internal report
- Ferreiro & Pastoriza (2004) Ferreiro, D. L., & Pastoriza, M. G. 2004, A & A, 428, 837
- Ferreiro et al. (2008) Ferreiro, D. L., Pastoriza, M. G., & Rickes, M. 2008, A & A , 481, 645
- Friedli et al. (1994) Friedli, D., Benz, W., & Kennicutt, R. 1994, ApJ, 430, L105
- Garnett et al. (1999) Garnett, D. R., Shields, G. A., Peimbert, M., Torres-Peimbert, S., Skillman, E. D., Dufour, R. J., Terlevich, E., & Terlevich, R. J. 1999, ApJ, 513, 168
- Geller et al. (2006) Geller, M. J., Kenyon, S. J., Barton, E. J., Jarrett, T. H., & Kewley, L. J. 2006, AJ, 132, 2243
- Gil de Paz et al. (2007) Gil de Paz, A., et al. 2007, ApJ, 661, 115
- Keenan et al. (1993) Keenan, F. P., Hibbert, A., Ojha, P. C., & Conlon, E. S. 1993, Phys. Scr. A., 48, 129
- Kennicutt & Keel (1984) Kennicutt, R. C., Jr., & Keel, W. C. 1984, ApJ, 279, L5
- Kennicutt et al. (1987) Kennicutt, R. C., Jr., Roettiger, K. A., Keel, W. C., van der Hulst, J. M., & Hummel, E. 1987, AJ, 93, 1011
- Kewley et al. (2006) Kewley, L. J., Geller, M. J., & Barton, E. J. 2006, AJ, 131, 2004
- Koeppen & Arimoto (1990) Koeppen, J., & Arimoto, N. 1990, A&A, 240, 22
- Henry & Worthey (1999) Henry, R. B. C., & Worthey, G. 1999, PASP, 111, 919
- Hernquist (1993) Hernquist, L. 1993, ApJS, 86, 389
- Hernquist & Mihos (1995) Hernquist, L., & Mihos, J. C. 1995, ApJ, 448, 41
- Howarth (1983) Howarth, I. D. 1983, MNRAS, 203, 301
- Hummel (1981) Hummel, E. 1981, A&A, 96, 111
- Hummer & Storey (1987) Hummer, D. G., & Storey, P. J. 1987, MNRAS, 224, 801
- Iono et al. (2004) Iono, D., Yun, M. S., & Mihos, J. C. 2004, ApJ, 616, 199
- Joseph & Wright (1985) Joseph, R. D., & Wright, G. S. 1985, MNRAS, 214, 87
- Lamareille et al. (2004) Lamareille, F., Mouhcine, M., Contini, T., Lewis, I., & Maddox, S. 2004, MNRAS, 350, 396
- Lambas et al. (2003) Lambas, D. G., Tissera, P. B., Alonso, M. S., & Coldwell, G. 2003, MNRAS, 346, 1189
- Larson & Tinsley (1978) Larson, R. B., & Tinsley, B. M. 1978, ApJ, 219, 46
- Leitherer et al. (1999) Leitherer, C., et al. 1999, ApJS, 123, 3
- Kinkel & Rosa (1994) Kinkel, U., & Rosa, M. R. 1994, A&A, 282, L37
- Kronberger et al. (2006) Kronberger, T., Kapferer, W., Schindler, S., Böhm, A., Kutdemir, E., & Ziegler, B. L. 2006, A & A, 458, 69
- McGaugh (1991) McGaugh, S. S. 1991, ApJ, 380, 140
- Mihos & Hernquist (1996) Mihos, J. C., & Hernquist, L. 1996, ApJ, 464, 641
- Nikolic et al. (2004) Nikolic, B., Cullen, H., & Alexander, P. 2004, MNRAS, 355, 874
- Noguchi (1988) Noguchi, M. 1988, A&A, 203, 259
- Pagel et al. (1979) Pagel, B. E. J., Edmunds, M. G., Blackwell, D. E., Chun, M. S., & Smith, G. 1979, MNRAS, 189, 95
- Pastoriza et al. (1999) Pastoriza, M. G., Donzelli, C. J., & Bonatto, C. 1999, A&A, 347, 55
- Pilyugin et al. (2004) Pilyugin, L. S., Contini, T., & Vílchez, J. M. 2004, A&A, 423, 427
- Pilyugin & Thuan (2005) Pilyugin, L. S., & Thuan, T. X. 2005, ApJ, 631, 231
- Ramsbottom et al. (1996) Ramsbottom, C. A., Bell, K. L., & Stafford, R. P. 1996, ADNDT, 63, 57
- Roy & Walsh (1997) Roy, J.-R., & Walsh, J. R. 1997, MNRAS, 288, 715
- Rubin et al. (1999) Rubin, V. C., Waterman, A. H., & Kenney, J. D. P. 1999, AJ, 118, 236
- Salpeter (1955) Salpeter, E. E. 1955, ApJ, 121, 161
- Schmitt et al. (1996) Schmitt, H. R., Bica, E., & Pastoriza, M. G. 1996, MNRAS, 278, 965
- Schlegel et al. (1998) Schlegel, D. J., Finkbeiner, D. P., & Davis, M. 1998, ApJ, 500, 525
- Sekiguchi & Wolstencroft (1992) Sekiguchi, K., & Wolstencroft, R. D. 1992, MNRAS, 255, 581
- Springel (2005) Springel, V. 2005, MNRAS, 364, 1105
- Struck (1999) Struck, C. 1999, Phys. Rep., 321, 1
- Testor (2001) Testor, G. 2001, A&A, 372, 667
- Trager et al. (1998) Trager, S. C., Worthey, G., Faber, S. M., Burstein, D., & Gonzalez, J. J. 1998, ApJS, 116, 1
- Tremonti et al. (2004) Tremonti, C. A., et al. 2004, ApJ, 613, 898
- Vale et al. (2007) Vale, T. B., Riffel, R., Pastoriza, M. G., Santiago, B. X., Rickes, M. G., 2007, In preparation
- Vila-Costas & Edmunds (1992) Vila-Costas, M. B., & Edmunds, M. G. 1992, MNRAS, 259, 121
- Woods & Geller (2007) Woods, D. F., & Geller, M. J. 2007, AJ, 134, 527
- Worthey & Ottaviani (1997) Worthey, G., & Ottaviani, D. L. 1997, ApJS, 111, 377
- Zaritsky et al. (1994) Zaritsky, D., Kennicutt, R. C., Jr., & Huchra, J. P. 1994, ApJ, 420, 87
SUPPLEMENTARY MATERIAL
The following supplementary material is available for this article:
Table 3. Radial velocities.
Table 5. Equivalent widths of the absorption lines.
Table 7. Dereddened line fluxes .
This material is available as part of the online article from: http://www.blackwell-synergy.com/ (this link will take you to the article abstract).