Interstellar Krypton Abundances: The Detection of Kiloparsec-scale Differences in Galactic Nucleosynthetic History111Based on observations with the NASA/ESA Hubble Space Telescope (HST) and the NASA-CNES-CSA Far-Ultraviolet Spectroscopic Explorer (FUSE). HST spectra were obtained at the Space Telescope Science Institute, which is operated by the Association of Universities for Research in Astronomy, Inc. under NASA contract No. NAS 5-26555; FUSE is operated for NASA by the John Hopkins University under NASA contract NAS-32985.
Abstract
We present an analysis of Kr I 1236 line measurements from 50 sight lines in the Hubble Space Telescope Space Telescope Imaging Spectrograph and Goddard High Resolution Spectrograph data archives that have sufficiently high resolution and signal-to-noise ratio to permit reliable krypton-to-hydrogen abundance ratio determinations. The distribution of Kr/H ratios in this sample is consistent with a single value for the ISM within 5900 pc of the Sun, log10(Kr/H) = , apart from a rough annulus from between 600 and 2500 pc distant. The Kr/H ratio toward stars within this annulus is elevated by approximately 0.11 dex, similar to previously noted elevations of O/H and Cu/H gas-phase abundances beyond 800 pc. A significant drop in the gas-phase N/O ratio in the same region suggests that this is an artifact of nucleosynthetic history. Since the physical scale of the annulus’ inner edge is comparable to the radius of the Gould Belt and the outer limit of heliocentric distances where the D/H abundance ratio is highly variable, these phenomena may be related to the Gould Belt’s origins.
1 Introduction
Where krypton is detectable, its interstellar abundance has the capacity to be a singularly reliable gauge of the degree of nucleosynthesis in a given region of the interstellar medium (ISM). Krypton is a noble gas whose outer electron shell is spherically symmetric. Consequently, it is not prone to forming either mechanical or chemical bonds in diffuse interstellar clouds where, given its ionisation potential relative to that of hydrogen (13.999 eV versus 13.598 eV), it should be predominantly in neutral form. These properties imply that a constant krypton to hydrogen interstellar abundance ratio is synonymous with a well-mixed ISM on the length scale over which the gas is sampled. Conversely, any significant departures from an established large-scale mean represent nucleosynthetic artifacts that mixing has not yet erased. Identifying such artifacts is crucial to understanding topics as varied as the details of dust composition and the large-scale processes of galactic chemical evolution. In particular, analyses of abundance departures from interstellar means constrain the observed efficacy of mixing at different Galactic length scales, the influence of isolated and/or prolonged but localized star formation events on elemental abundance ratios, the yields of supernovae, and the amount and composition of material available for dust formation. Because it is undepleted in the diffuse ISM, elemental abundance ratios involving krypton can be very sensitive probes for these fields of study.
Krypton to hydrogen abundance ratios have been well-studied within a kiloparsec of the Sun. The krypton line at 1235.838 Å was first detected using the Goddard High Resolution Spectrograph (GHRS) aboard Hubble Space Telescope (HST) during observations of Oph (Cardelli et al., 1991). A comprehensive study of GHRS detections of Kr I 1236 later demonstrated that the Kr/H abundance ratio within 500 pc of the Sun is constant at the level of log10(Kr/H) = (Cardelli & Meyer, 1997). This conclusion was consistent with GHRS results from oxygen (Meyer et al., 1998) and nitrogen (Meyer et al., 1997), two of the most abundant elements in the ISM, which also exhibited a constant local abundance relative to hydrogen. Moreover, since the interstellar krypton abundance ratio is roughly 50% of the Solar value (; Lodders 2003), this study established that the deficit in the interstellar krypton abundance with respect to its Solar value was similar to the deficits for other elements (e.g., carbon, oxygen, and nitrogen), using the then-accepted Solar abundances. Myriad spectral observations using the Space Telescope Imaging Spectrograph (STIS) and revisions both to oscillator strengths and Solar abundances have lessened the similarity between the interstellar abundance deficits for these elements; nevertheless the uniformity of their elemental abundances in the local ISM has only gained further support from the new data. Indeed, since krypton does not readily deplete into grains or form molecules, the constancy of its abundance relative to hydrogen, independent of molecular hydrogen fraction [(H2)] or mean hydrogen sight line density [], has been used to establish that the diffuse ISM is well-mixed on lengthscales of a few hundred parsecs (Cartledge et al., 2003, 2006). This result is independently supported by other analyses, specifically some involving the composition of stellar atmospheres (Reddy et al., 2003) and pre-solar meteoritic dust grains (Nittler, 2005). As a result, it can be concluded that significant deviations from the mean interstellar Kr/H abundance ratio identify sites or regions within the Galaxy where the nucleosynthetic history differs from that of the local ( 500-700 pc) ISM.
In order to apply this tool to exploring the limits of this well-mixed interstellar region and to probe for variations in the Kr/H abundance ratio based on physical conditions not found locally, it was necessary to search for krypton along a wider variety of paths than were previously studied. Thus, we have plumbed the depths of the MAST Archive at STScI for detections of Kr I 1236, measuring the krypton abundance for each sight line with a significant absorption feature. In this paper, we discuss the relevant GHRS, STIS, and Far Ultraviolet Spectroscopic Explorer (FUSE) observations (§ 2), then examine the uniformity of the Kr/H abundance ratio with respect to key sight line properties (§ 3). Finally, in § 4, variations in Kr/H, O/H, O/Kr, N/O, and Cu/H are compared, in search of reinforcement for the identified Kr/H trends, and possible explanations.
2 Observations and Abundance Measurements
The study of interstellar krypton abundances using GHRS initially established our knowledge of the uniformity of the Kr/H ratio within 500 pc of the Sun (Cardelli & Meyer, 1997). When STIS data were added to the analysis, the case for a singular interstellar Kr/H abundance ratio was broadened to include 26 sight lines covering a range of nearly five orders of magnitude in (H2) and over two orders of magnitude in , as only two exceptions to the remarkably narrow distribution around log10(Kr/H) = were identified (Cartledge et al., 2003). Since the majority of the combined GHRS and STIS sample were relatively short sight lines ( 600 pc) and the two exceptions (HD 116852 and HD 152590) were the only paths to penetrate neighboring spiral arms, these deviations were thought to be related to this circumstance. Seeking to investigate this hypothesis, we proposed to use STIS to observe eight Galactic OB stars (GO9855), at distances up to 4.8 kpc, that intersect neighboring spiral arms. The targets included both HD 116852 and HD 152590, so that the previous krypton measurements could be compared with results derived from new higher signal-to-noise ratio spectra. Each observation was designed to generate spectra with S/N = 50 per resolution element for the E140H echelle grating centered at 1271 Å using the 0.2″0.9″ aperture. The equivalent width of an unsaturated feature detected at 5 would thus be 1.1 mÅ, permitting the measurement of log10(Kr/H) values as small as ; this limit is a factor of three smaller than the smallest ratio reported to that date.
Unfortunately, STIS ceased to operate in mid-2004, after only four of our planned targets were observed. Although we were now able to re-examine both previously observed targets, only two new sight lines, one each directed toward and away from the Galactic centre, were added. To achieve the stated goals of GO9855, we were forced to search the STIS archive for all observations that might possess unreported detections of krypton in either the 1164.8672 or 1235.838 Å resonance lines. Since this search was well-matched to our archival proposal to investigate the abundances of rare elements (AR10643; Lauroesch et al. 2008), particularly those produced by slow and rapid neutron capture processes, the searches were conducted concurrently. The relevant search criteria were sufficient spectral resolution to distinguish components from different spiral arms and limit contamination from unresolved saturation (no datasets with resolution less than = 45000 were used), and wavelength coverage that included one or both of the krypton resonance lines previously mentioned. Among the archival datasets, 35 sight lines exhibit some evidence of a krypton absorption feature associated with Kr I 1236; observational details for the 26 sight lines with reliable detections and the four GO9855 targets are given in Table 1. The table includes specifications for all GHRS, STIS, and FUSE observations of these stars upon which the abundance measurements are based. Unfortunately, the poor signal-to-noise ratios for spectral orders covering 1164.8672 Å do not permit reliable column density determinations from these data. Please note that seven sight lines with marginal krypton detections (HD 3827, HD 93205, HD 93222, HD 168941, HD 202347, HD 218915, and CPD 59 2603) have been rejected because in each case the absorption feature’s equivalent width was less than a factor of 4 greater than the associated uncertainty. HD 36408B and HD 121968 have better than 5 features, but these are omitted for the reasons outlined below.
The spectral type for HD 36408 B, B7IV, is unsuitable for the direct measurement of an interstellar atomic hydrogen abundance, so this quantity must instead be gauged using the well-known empirical linear relationship between and (H) (e.g., see Spitzer 1978). Using the Rachford et al. (2002) calibration indicates an oxygen abundance of log10(O/H) = , about 0.24 dex above the interstellar mean for low-density sight lines (Cartledge et al., 2004). The gas-phase abundances of other elements, notably Mg II, P II, Ni II, Cu II, Ge II, and especially Kr I, range from 0.30 dex to 0.60 dex higher than their respective low-density interstellar means, while Mn II is roughly at the interstellar value (for interstellar abundance references at log, see Cartledge et al. 2006). Due to the lack of (H) and the unusual depletion pattern along this sight line compared with sight lines analyzed by Cartledge et al. (2006), we identify this path as a subject for future study but omit it from the current analysis.
We also identify HD 121968 as a sight line whose ambiguous krypton abundance warrants further study. A strong absorption component is evident near km/s in line profiles of O I 1355, Si I 1425, P II 1301, all Mn II lines, Cu II 1358, Ga II 1414, Ge II 1237, all C I lines, and Cl I 1347. The Kr I 1235 profile contains a similar feature at the same helocentric velocity; however, an absorption spike of equal strength is situated 5 km/s to the blue. In none of the other line profiles mentioned above does a comparable component appear, which would make this sight line unique among those studied to date if the krypton profile were accepted without further consideration. Several nickel lines are the only profiles to exhibit strong absorption at velocities removed from the central component; the feature most closely approximating the second krypton absorption spike is at km/s with nearly 75% depth relative to the main component. However, this feature is merely one of the strongest in a very complex profile that bears very little resemblance to the line profile of krypton or any other element. Lastly, there is no blueward component to match the hint of absorption that corresponds to the main absorption feature in the the Kr I 1164 profile, although this spectral order is compromised by noise spikes comparable to the profile depth. Consequently, we conjecture that the apparent Kr I 1235 absorption profile is contaminated by noise, and omit the HD 121968 sight line from further analysis.
Adding 30 new krypton gas-phase abundance measurements to previous detections, there now exists a database of 56 Galactic sight lines with published krypton column densities. Unfortunately, for three of these paths there are no observations at short enough wavelengths to assess the amount of molecular hydrogen intersected by the line of sight. Toward HD 37021 and HD 37061, however, Cartledge et al. (2001) argued that the low Cl I abundance toward each star implies that these sight lines do not have large H2 column densities. In the current sample, HD 208947 lacks this evidence for a small (H2) but its krypton abundance is near the low end of the distribution and we include it provisionally in the Kr/H abundance ratio analysis. However, six stars whose spectra exhibit krypton absorption features also have interstellar Lyman- absorption profiles that are contaminated by significant stellar absorption, hence the sample of Kr/H abundance ratios contain values for only 50 of the 56 sight lines with krypton. The krypton abundance for each path was determined using the methods established by Cartledge et al. (2001), with a slight alteration to the calibration procedure. The new spectra were calibrated using the standard STSDAS STIS data reduction routine CALSTIS (v.2.13), with the two-dimensional scattered-light correction algorithm SC2DCORR applied automatically. Although this procedure produces slightly different calibrated spectra than the stisextract method (Howk & Sembach, 2000) we used in previous krypton analyses (Cartledge et al., 2001, 2003), a comparison of the abundances derived when the data are calibrated using each method indicates that the results generally agree within 0.02 dex. In view of this accord, and since it is more efficient to process the data through a single algorithm, we calibrated the new data using CALSTIS alone.
In order to alleviate concerns of unresolved saturation, we followed the same abundance determination procedures used in our previous work. Specifically, both apparent optical depth (AOD) and profile-fitting methods were applied to the data to check consistency, then the profile-fitting results were adopted while AOD uncertainties were folded into the listed column density errors to explicitly account for continuum placement uncertainty. For the majority of the new sight lines, the spectral coverage included wavelengths from shortward of 1200 Å to longward of 1250 Å so that the neutral hydrogen column density could be assessed by continuum reconstruction near the Ly- line. FUSE data were also available for nearly all of these paths, so the same method was used to determine the molecular hydrogen column density toward each target star. The krypton and hydrogen abundance data for the newly identified krypton sight lines are given in Table 2. For more detail on the techniques mentioned here in brief, please see Cartledge et al. (2003) and references therein. All previously-published krypton and hydrogen abundances for sight lines where Kr I 1236 has been detected are compiled in Table 2 of that paper.
3 The Gas-Phase Kr/H Ratio Distribution
The mean interstellar krypton gas-phase abundance level that Cardelli & Meyer (1997) derived, represented by the Kr/H ratio log10(Kr/H) = [Kr/H = ], was remarkable in that each and every measurement of the ratio agreed with this value within its 1 error bar. Nine of the ten spectra compiled in that study were observations of stars within 500 pc of the Sun, indicating that the ISM within this region is very well mixed. This evidence for an homogeneous local ISM was supported by the analysis of GHRS observations of two N I absorption lines near 1160 Å and an O I line at 1356 Å in the spectra of stars with similar distances, many of them the same stars toward which krypton was detected. Gas-phase abundance levels of log10(N/H) = (Meyer et al., 1997) and log10(O/H) (Meyer et al. 1998; this value has been adjusted to reflect updates in the oxygen line’s oscillator strength) were identified by these studies and although both nitrogen and oxygen, unlike krypton, are susceptible to depletion from the gas phase, no deviation from the interstellar means by more than 1.5 were evident. These data indicated that the degree of mixing in the local ISM is independent of the elements’ different nucleosynthetic origins.
Cartledge et al. (2001) added 10 STIS-observed spectra into the discussion of krypton abundance, probing denser and longer sight lines. Regardless of the much broader volume of parameter space being studied, in terms of total column density, , extinction, and distance, each of their new Kr/H data points also agreed with the unchanged overall interstellar mean within 1. Most recently, Cartledge et al. (2003) added 12 more paths to the sample. Their data indicated that among the 22 sight lines less than 800 pc in length, all but one were consistent with a singular interstellar Kr/H ratio, while the exception deviated by no more than 1.3. Of the 4 paths between 1.5 and 4.8 kpc in length, however, only the two directed along the curve of the Orion Spur (the local spiral arm situated between the Carina/Sagittarius and Perseus Arms) agreed with the otherwise ubiquitous Kr/H ratio already established. The exceptional sight lines, toward HD 116852 and HD 152590, both intersected the Carina/Sagittarius Arm and it was suggested that their roughly solar krypton abundances might be related to this property. It should be noted, however, that the abundance measurements for these paths were among the most uncertain, given complications with distinguishing weak absorption components from the noise in the HD 116852 spectrum and the unusually steep curvature of the HD 152590 stellar background near 1236 Å.
Both stars were re-observed for GO9855, with the following results: log10(Kr/H)HD116852 = ; log10(Kr/H)HD152590 = . The new observations have provided spectra integrated for more than 15 and 7 times the previous exposure times, respectively. As a result, the difficulties with the first measurements of krypton abundance along these sight lines were dramatically reduced. Perhaps unsurprisingly, the Kr/H ratios for both sight lines are closer to the interstellar mean than previously determined; the krypton abundance toward HD 116852 matches log10(Kr/H)ISM = within error, while the HD 152590 path is only the second, after HD 37367, to deviate by as much as an amount approaching 1.3. The remaining two sight lines successfully observed for the GO9855 program, HD 40893 and HD 165246, agree within their respective uncertainties with the interstellar mean krypton abundance (see Table 2). So before the results from the STScI Archive (by way of AR10643) are considered, the picture we have constructed is of a remarkably uniform sample of 28 Kr/H ratios which differ from a single value by no more than 1.3 (see Figure 1). Since krypton is undepleted along the sight lines that can be probed using ultraviolet absorption features, this tight distribution is strong evidence that the diffuse ISM is very well mixed on length scales of several hundred parsecs. Combining the krypton result with data for other elements (e.g., O, Mg, P, Mn, Ni, Cu, Ge) has implied that the composition of the diffuse ISM is homogeneous to a limit of order 0.04 dex (Cartledge et al., 2006) on this same spatial scale.
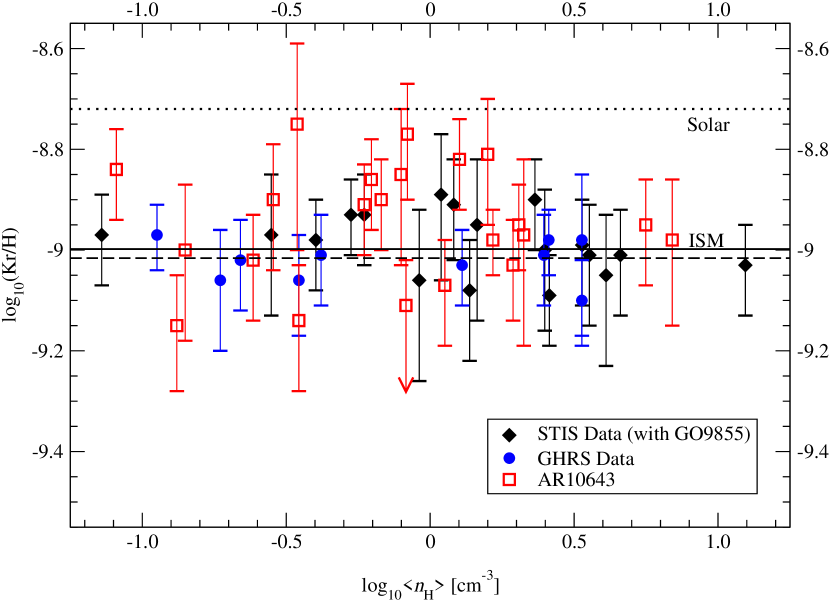
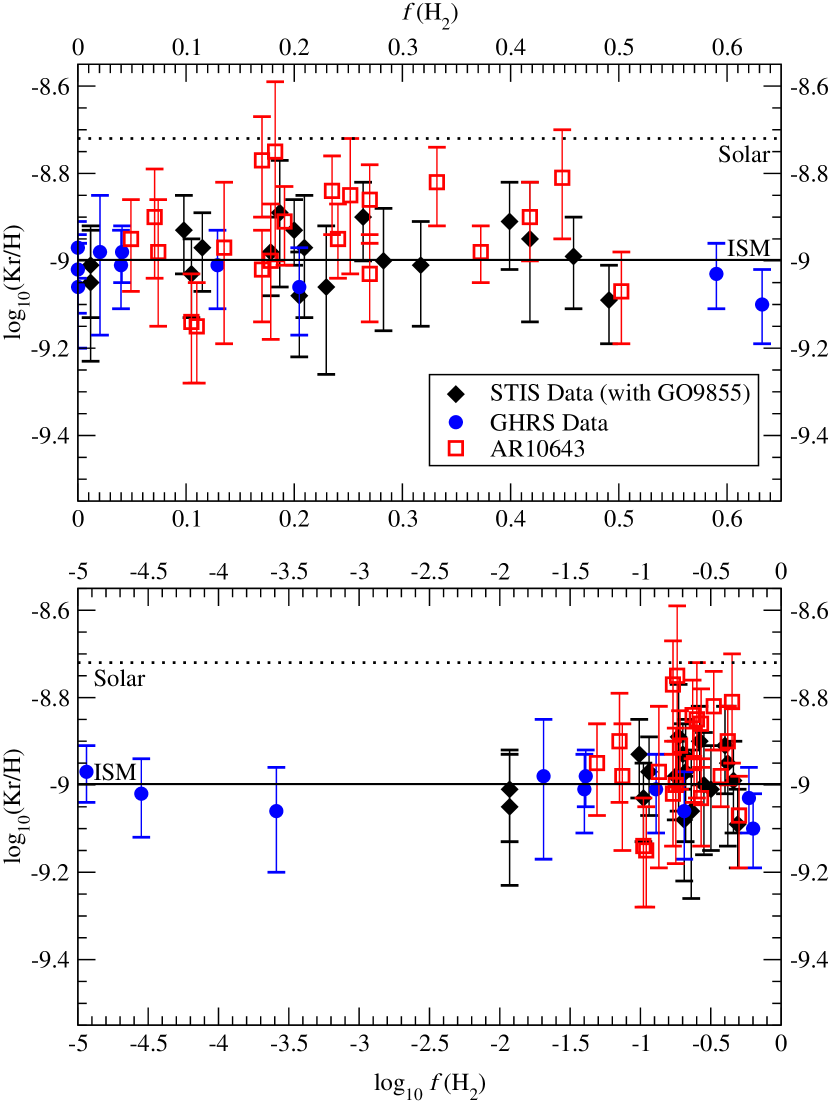
However, this krypton abundance sample of 28 sight lines is dominated by short paths extending less than a kiloparsec through the Galactic disk. To more fully comment on the singular krypton level, and hopefully identify regions with distinct nucleosynthetic histories, it became necessary to consider all possible unpublished Kr I 1236 detections in the Archive. The data from Table 2 and all previous krypton abundance measurements have been encapsulated in Figures 1, 2, 3 and 4, which describe the fluctuations in Kr/H with the sight line properties mean sight line hydrogen density [], molecular hydrogen fraction [(H2)], Galactocentric radius (), and sight line pathlength (), respectively.
The first two plots serve to re-iterate and emphasize previous conclusions regarding the state of krypton in the interstellar medium. In Figure 1, the Kr/H gas-phase abundance ratio distribution does not depend on , the mean hydrogen sight line density. Previously-published data are more uniform than the newer data in their collective agreement, differing by less than 1.3 from the mean on a point-by-point basis, but the 26 Archive-based Kr/H ratios were derived from spectra not designed to measure krypton abundance and so generally suffer from larger uncertainties and are more widely distributed. Nevertheless, upon including these new data the overall interstellar mean shifts only slightly to log10(Kr/H)ISM = [or Kr/H = ] from the previous determination, and there are no coherent trends with . Figure 2 clearly shows that the measured Kr/H ratio is also independent of a sight line’s molecular hydrogen fraction. This property is evident whether the molecular hydrogen fraction is expressed strictly as a number, emphasizing the uniform distribution of Kr/H ratios for (H2) , or in logarithmic form, which stresses the singular nature of the Kr/H ratio across several orders of magnitude to very small values of (H2). In other words, the shielded conditions that at the same time favor the enhancement of H2 abundances relative to H I and elemental depletion into dust grains do not affect the gas-phase abundance of krypton. Thus krypton is undepleted in the ISM, within the density range and spatial regions probed to date by Galactic sight lines.
The broad density-parameter strokes used to define this portrait of kiloparsec-scale krypton abundance uniformity and lack of depletion into dust, however, mask some subtler features. In particular, the scatter among the older measurements is only 0.06 dex, compared with a typical Kr/H ratio uncertainty of 0.09 dex. Encompassing the new and Archival data into the sample increases this scatter to 0.10 dex. And although the Archival Kr/H ratios are in general less precise than earlier measurements, it should be noted that they are also largely derived from longer paths through the Galactic disk. In fact, according to Figures 3 and 4, the increased Kr/H ratio scatter is not due solely to greater inherent uncertainty in the Archival measurements, but is perhaps dominantly produced by variations dependent on spatial sight line properties.
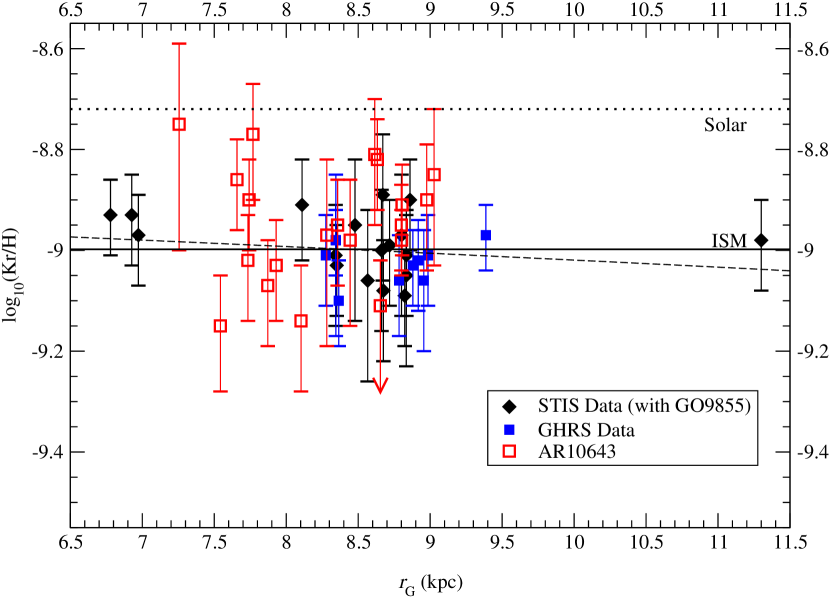
Consider Figure 3, which examines Kr/H as a function of the galactocentric radius () of the observed OB star. In studies of stellar atmospheres (e.g., Rolleston et al. 2000) and planetary nebulae (e.g., Martin-Hernández et al. 2002), a clear abundance trend with is apparent. As a star’s, or planetary nebula’s, distance from the Galactic center increases, elemental abundances steadily fall. For example, the oxygen radial abundance gradient is determined by these studies to be about dex/kpc, attributed to enhanced nucleosythesis in the central regions of the Galaxy relative to outlying areas. It is more difficult to measure such trends using abundances determined from UV absorption line profiles because these profiles are convolutions of features from individual clouds along the line of sight to which the distances are rarely known. Nevertheless, the Kr/H data are plotted as a function of in Figure 3 to search for this trend. Unfortunately, only a few stars are situated beyond 500 pc from the Sun’s radial location in the disk, either closer to or farther from the Galactic center (the adopted Solar galactocentric radius for this analysis is 8.5 kpc). Moreover, the bulk of stars outside the annulus are to be found nearer the Galactic centre than away from it. A weighted linear regression to the radial dependence of Kr/H gives a slope of dex/kpc, which becomes a krypton radial abundance gradient of 0.027 dex/kpc under the crude approximation that all absorbing material is situated at the midpoint of each sight line (i.e., the radial gradient is double the measured slope). The slope, however, includes zero within its 1 uncertainty and the trend is not very visually compelling. Consequently, these data are also consistent with a flat gradient.
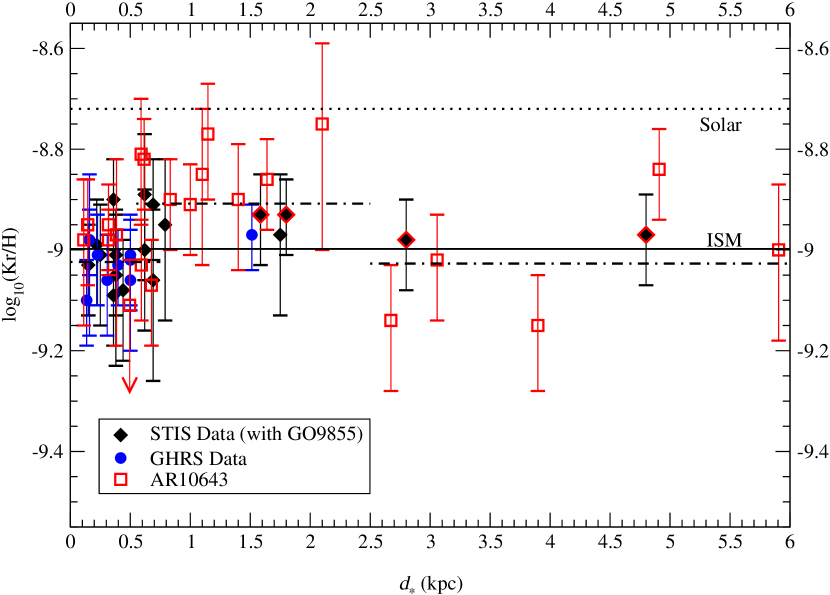
The small apparent slope with may simply be a secondary result of the striking spatial pattern in krypton abundance that becomes clear when Kr/H is plotted against the distance to the observed star, as in Figure 4. Previously published data are consistent with krypton abundance being independent of the target distance, yet they conform to a pattern of elevated Kr/H ratios for 750 pc 2500 pc when combined with measurements of features found in Archival spectra. Note that the four GO9855 sight lines are those black diamonds limned in red and that they are consistent with both patterns. There is some overlap for targets at distances between 550 and 750 pc from the Sun, where a fraction of the sight lines exhibit elevated krypton abundances and the remainder match the level of the previously published interstellar mean. The dot-dashed lines in this plot indicate the mean Kr/H ratios for each distance interval. If the sight lines with pathlengths between 550 and 750 pc are allotted by their krypton abundances to the groups with pathlengths less than 550 pc and those between 750 and 2500 pc long, then paths with endpoints in the defined annulus are elevated in Kr/H by 0.11 dex with respect to the local ISM mean (see Table 3). Notably, the Kr/H ratios interior and exterior to the annulus are identical within their errors, each differing from the value within the annulus by roughly 3.
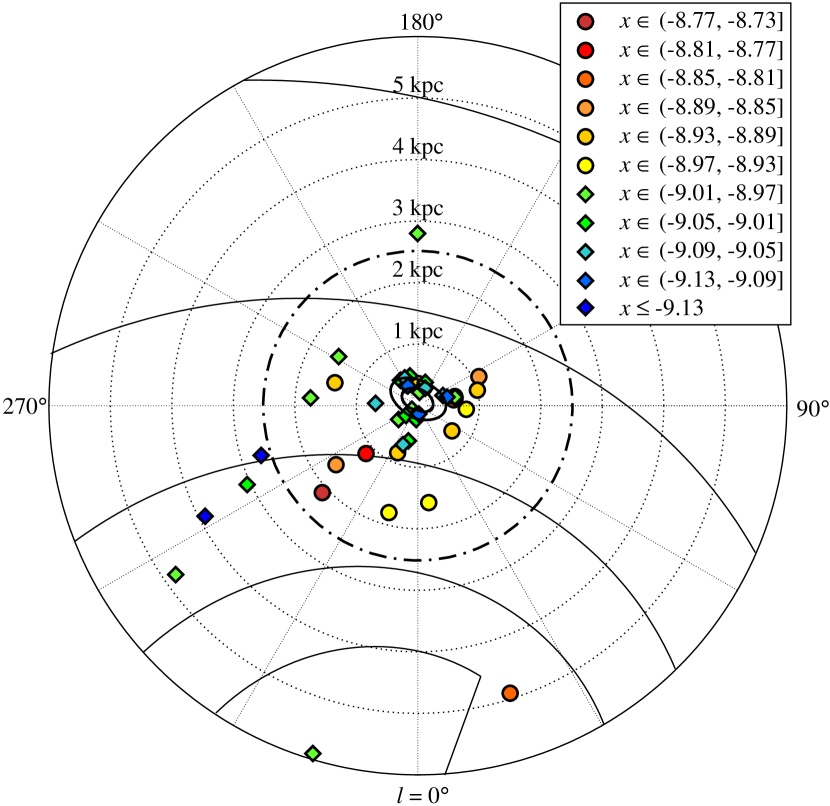
Although the difference between weighted Kr/H ratio means for the annulus and non-annulus sets provide strong evidence that the Kr/H abundance ratio changes with heliocentric distance, the effect is just at the 3 level and the sample sizes are small. To quantitatively confirm the reality of the annulus of elevated krypton abundances, we have applied the Student’s t-test to the data. The t-test is a statistical measurement that determines the likelihood that two datasets are merely random samplings of the same underlying population—in this case that of Kr/H abundance ratios. Expressing the data as sets of log10(Kr/H) values, we find that the annulus and non-annulus groups are both reasonable approximations of normal distributions, that the probability that they are derived from the same underlying population is 0.000034%, and that at the 95% confidence level the difference between the means for these two samples is at least 0.09 dex. Therefore, we conclude that these groups of sight lines indeed represent distinct populations. This analysis blends seamlessly with a more qualitative description of the distinctions between the two distributions. Specifically, the breadth of the krypton abundance distribution interior to the annulus is characterized by a scatter of 0.06 dex, indicating a particularly tight grouping given the typical uncertainty of 0.09 dex in this measurement. The scatters for the groups of sight lines both ending within the annulus and exterior to it are larger, reflecting the larger typical uncertainties for the corresponding paths, but the annulus group is still scattered to a lesser degree than would be indicated by the typical abundance ratio uncertainty. Thus, an annulus of inner radius roughly 600 pc centered near the Sun defines a region of enhanced krypton abundance relative to the interstellar mean for the Galactic disk within 6 kpc. See Figure 5 for an illustration of this region in terms of Kr/H abundance ratios, looking down on the Galactic plane from above.
4 Is the Effect Only Evident for Krypton?
This annulus of krypton abundance enhancement has previously been detected in the abundance data for other elements, although its interpretation in these instances has been different. Two independent compilations of O/H abundance ratios based on the weak 1356 intersystem line (André et al., 2003; Cartledge et al., 2004) noted that this quantity is generally constant except for two effects: enhanced depletion along dense sight lines and an elevation in the ratio for paths longer than about 800 pc and less dense than . Cartledge et al. (2006) showed that copper to hydrogen abundance ratios also exhibit the latter dependence on a sight line’s length. Unfortunately, the database of element-to-hydrogen abundance ratios that they compiled for the other elements being studied (Mg, P, Mn, Ni, and Ge) did not include enough short low-density sight lines to rigorously establish that these elements also conformed to the same trend, and including denser sight lines would have confused any distance effect with the observed depletion enhancement with density. Nevertheless, there was some support for elevated abundance ratios beyond 800 pc in these data as well.
The interpretation of the heliocentric distance trend for these studies and the earlier GHRS investigations has been guided by simple spatial arguments. When the first high spectral resolution data from GHRS were compiled, the goal was to explain the apparent constancy of interstellar C, O, N, and Kr abundance levels within 500 pc of the Sun at a common level relative to their Solar values. Meyer et al. (1998) posited three possible explanations: early solar system enrichment by a local supernova; a recent infall of metal-poor gas in the local Milky Way; or an outward diffusion of the Sun from a smaller Galactocentric distance. Each possibility would have the effect of reducing elemental abundances in the Solar neighborhood by a common factor relative to the Sun, provided that radial abundance gradients for these elements were also similar. For the effects observed by both oxygen compilations and Cartledge et al. (2006), the abundance reduction is not tied to the Sun, so the simplest mechanism to reduce abundances by a common factor over a large region, and moreover reduce the abundances of several elements by the same factor, is recent infall of metal-poor gas.
For other abundance analyses, however, alternate explanations have also been considered. The abundance of nitrogen, ranking along with oxygen as one of the five most abundant elements in the galaxy, also exhibits unexpected variations in the local ISM, for which possible explanations may be nucleosynthetic or related to differential mixing. Specifically, GHRS observations of the weak N I 1160 Å doublet described a constant N/H ratio within 500 pc of the Sun, with negligible depletion into dust grains (Meyer et al., 1997), but Interstellar Medium Absorption Profile Spectrograph, STIS, and FUSE data have altered this picture by enlarging the sample to probe more diverse environments. From these data, Knauth et al. (2003) found that N/H varied significantly as a function of (H) without showing any evidence of N2 formation or depletion into dust. Combining nitrogen and oxygen abundances for the most robustly determined of these N column densities, Knauth at al. (2006) determined that locally the N/O ratio is 0.2170.011, but that beyond 500 pc the ratio drops to 0.1420.008 . Eight of the 13 sight lines from which this pattern is deduced are also among those with krypton abundances, and the two paths added in proof to that paper bring the total to ten whose Kr/H ratios can be checked against the distance pattern noted here. Toward each star that was reported by Knauth at al. (2006) as being situated within 500 pc of the Sun, the krypton abundance is in agreement with the local mean [log10(Kr/H)ISM = ]. And furthermore, those paths assigned lengths between 750 and 2500 pc agree with log10(Kr/H)ISM = , the mean abundance for the annulus of enhancement. In this paper, however, we have adopted a distance of 3.06 kpc for HD 99857 rather than the sub-500 pc Hipparcos value used by Knauth at al. (2006). The parallax error on the latter value is of order 80%, and the distance we adopt is more consistent with the star’s spectroscopic parallax and previous literature estimates of its distance. But regardless of whether the path is less than 500 pc or longer than 2.5 kpc, the krypton abundance means in these two regions are in agreement (see Table 3).
A similar distinction between local ISM abundances and those determined using paths longer than a few hundred pc has been noted for deuterium, although the transition distance cannot be as cleanly defined. Wood et al. (2004) compiled D/H measurements from a variety of instruments, finding that both within 100 pc of the Sun and beyond about 600 pc the ratio was well-defined but that the levels were roughly a factor of two (0.30 dex) different. Between 100 and 600 pc, there is a complicated distribution including data spanning a much wider range than is delineated by the near and far average D/H values. Subsequent analyses have expanded upon this description with new data, considering scenarios of infall, variable astration, and density-dependent depletion as explanations for the significant D/H ratio variability among paths between 100 and 600 pc long (e.g., Oliveira et al. 2006; Linsky et al. 2006). However, the possibility of infall has been regarded as doubtful for that situation because it would need to be confined to particular individual sight lines, both since the theoretical ISM mixing timescale of 350 Myr suggests that variabilities are likely to have been removed on these lengthscales in the same time as those within 100 pc of the Sun (de Avillez & Mac Low, 2002) and because empirical evidence suggests that mixing is efficient in this region of the ISM (Cartledge et al., 2006). Nevertheless, it is apparent that the interstellar deuterium abundance also is subject to anomalies dependent on heliocentric distance, and that the scale of the pattern is similar to that evident in oxygen, copper, and other elements, particularly since the lengthy Galactic sight lines of D/H studies generally would meet the definition of the annulus group in this paper.
The spatial extent of the abundance enhancement in heavy elements is made obvious with the current krypton data because measurement of the gas-phase abundance of this element is not subject to complication by depletion—UV absorption profiles permit the total amount of neutral krypton along a given sight line to be determined. For elements that play a role in interstellar dust, spatial variations in abundance can be rivalled or exceeded in magnitude by those related to density-dependent depletion. Using oxygen as an example, the distinction between the derived warm and cold ISM depletion levels is 0.10 dex, comparable to the location-based abundance enhancement identified here in krypton. This complication made it easy to miss the trend in the Cartledge et al. (2004, 2006) oxygen and copper data; specifically, to note that beyond a distance of order 2.5 kpc, elemental abundances largely return to the lower levels measured within 750 pc of the Sun. In order to confirm the reality of this spatial abundance pattern, though, it is necessary to show that the effect is not just distinguishable in the separate sight line samples for more than one element, but that it is apparent using the same sight lines for each element being considered.
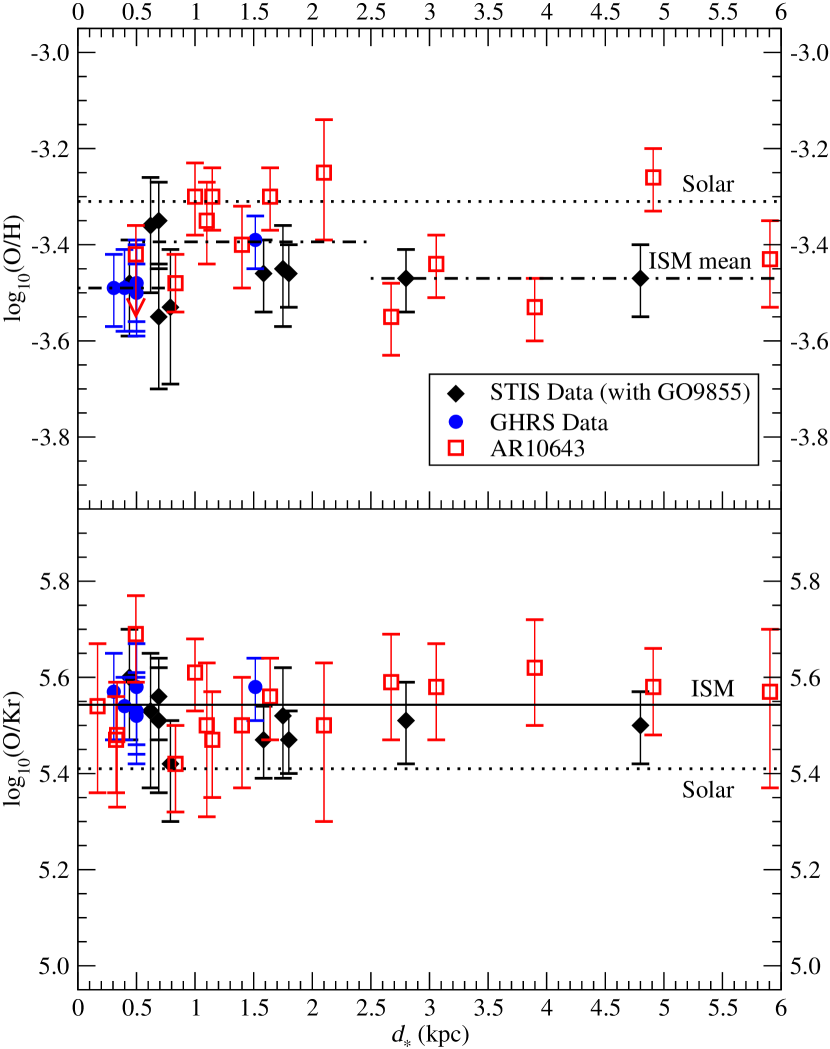
Since the distance effect has previously been observed in gas-phase O/H abundance ratios and O I 1356 features are similar in optical depth to Kr I 1236, given their respective interstellar abundances, we measured the oxygen abundance for each sight line presented in this paper. The oxygen measurements were made using the same techniques, with the same underlying profile solutions, applied to the corresponding krypton features and the results are presented in Table 4. Note that in cases where the profile is very broad, oxygen abundances are only tallied over radial velocities consistent with the krypton profile, so that O/Kr ratios are representative of the reliable features in each spectrum. Also, the ionization potential of neutral oxygen (13.618 eV) is very close to that of krypton and just larger than the corresponding hydrogen value, ensuring that oxygen and krypton will both be neutral in neutral gas. Care has been taken when plotting the gas-phase O/H ratios in the top panel of Figure 6 to avoid paths with , above which the data are likely to be contaminated by enhanced oxygen depletion into grains (Cartledge et al., 2004). Using the same groupings adopted in the analysis of Kr/H variation with pathlength, O/H and O/Kr abundance ratio means for each distance range are given in Table 3; the individual O/Kr abundance ratios are plotted in the bottom panel of Figure 6. Notably, the same distance pattern identified in Kr/H can easily be discerned in gas-phase O/H ratios using the same sight lines. Numerically speaking, the two abundance ratio increases are also similar: the Kr/H ratio is elevated by 0.11 dex (, using the quadrature sum of the uncertainties in annulus and non-annulus weighted means) for sight lines ending within the 550—2500 pc annulus relative to the value both inside and outside, while the gas-phase O/H ratio is elevated by 0.08 dex (2.5) in the same manner.
Underlining this evidence for a nearly identical heliocentric distance dependence for the krypton and oxygen abundances relative to hydrogen is an extremely tight distribution when the ratio of oxygen to krypton is plotted against pathlength in the bottom panel of Figure 6. Leaving out sight lines subject to enhanced oxygen depletion, but including those paths with significant krypton detections excluded from the Kr/H analysis for lack of rigorously-determined hydrogen column densities (e.g., HD 94454), the overall weighted mean O/Kr is with a scatter of 0.06 dex. It should be noted that the breadth of this distribution is significantly smaller than what would be expected given the typical abundance ratio uncertainty for these data ( 0.09 dex). Similar numbers were derived by Cartledge et al. (2003) for the Kr/H ratio, and used by Cartledge et al. (2006) to demonstrate that the ISM within several hundred parsecs of the Sun is very well mixed. Delving further into the details of Table 3, the mean gas-phase O/Kr abundance ratios for paths both entirely within the annulus and those extending well beyond it agree within their errors at a level somewhat larger than the mean for paths in the annulus sample; however, the annulus and non-annulus values agree within the quadrature sum of their 1 errors. Consequently, the abundance enhancement observed in krypton for sight lines between 750 and 2500 pc in length is also proven detectable in oxygen, and at a similar level.
Combining these results, it appears that the spatial abundance enhancement is nucleosynthetic in nature. While krypton, oxygen, and copper abundances all rise by a similar amount among paths with a characteristic range of lengths, nitrogen apparently does not. Specifically, we infer that if the O/H ratio is elevated for the annulus sample by 0.08 dex, the N/H ratio for the same sight lines must fall by 0.10 dex in order to reproduce the mean N/O abundance ratios observed by Knauth at al. (2006). The scenario suggested by these properties would be described as follows: paths shorter than 550 pc would probe a well-mixed ISM; local ISM gas intermingles with material that has experienced more recent nucleosynthetic activity at distances from the Sun beyond about 500 pc, to the point where this more heavy-element-rich gas dominates in a ring perhaps a few hundred parsecs wide; finally, more than 1000 pc away from the Sun, the ISM appears to again resemble the local ISM in terms of elemental abundance.
Such a configuration would give rise to the observed abundance ratio dependencies, given that the total hydrogen column densities for the entire database of sight lines with krypton detections range only from log(H) = 20.46—21.77 and about 80% of these are within a factor of 4 of one another, ranging from log(H) = 21.20—21.77 . Specifically, paths shorter than 550 pc and some with lengths in the 550—750 pc range would be dominated by the well-mixed local ISM. Other sight lines up to 750 pc long would intersect gas dominated by more recently processed material. The paths in this dataset with lengths of 750—2500 pc are exclusively of lower densities () and their elemental abundance ratios might readily be dominated by processed gas concentrated in an annulus centered near the Sun whose inner radius is about 500—600 pc. And beyond 2500 pc, sight lines with similar overall (H) to shorter paths are on average more rarified and less likely to be dominated by gas in the implied ring, and so evince elemental abundance ratios apparently characteristic of both the well-mixed local gas and more distantly situated material.
The suggested annulus of enriched interstellar gas around the Sun is difficult to explain without considering a link to the Gould Belt. The Belt is a disk-like concentration of young stars, OB associations, neutral gas, molecular clouds and dust in a plane intersecting the Galactic disk near the Sun, that is inclined by approximately 20∘ with respect to the stars in the Galactic disk (Torra et al., 2000). Its dominant stellar feature is a ring of OB associations bounding this disk; the inner and outer edges of this ring are approximated in Figure 5 by elliptical annuli whose dimensions and location are set by the Perrot & Grenier (2003) fit with an annulus width of about 80–100 pc. The Gould Belt’s origins have generally been ascribed to a combination of explosive events or the impact of a massive high velocity cloud in the Solar neighborhood (Comerón & Torra, 1994; Pöppel, 1997). Regardless of the cause, the Gould Belt includes OB associations formed in the last 30—60 Myr (Torra et al., 2000) at distances up to about 500 pc from the Sun, as well as gas distributed throughout the region bounded by the OB associations in the form of diffuse H I and molecular clouds (Pöppel, 1997; Perrot & Grenier, 2003). The similarity between distances associated with the closer edge of the observed annulus of abundance enhancements and those indicative of the outer reaches of the Gould Belt is very suggestive, given that OB associations such as the ones ringing Gould’s Belt produce Type II supernovae. SN II are important production sites for krypton, oxygen, and copper that leave nitrogen essentially unenhanced (e.g., Chieffi & Limongi 2004). In fact, the supernova rate for the Gould Belt has been estimated at 3–5 times that of the local Galactic disk (Grenier, 2000). The observed outward flow of gas away from the Belt’s central regions (Perrot & Grenier, 2003) is consistent with both an explosive origin for the Belt or the impact of a high velocity cloud (Comerón & Torra, 1994). The flow is also patchy, which is consistent with the pattern of abundance enhancements identified in this paper. Since the Belt was formed only a few tens of millions of years ago, there has not been sufficient time for mixing to erase any abundance variations introduced into interstellar gas by recent supernovae in the Belt.
It is worthwhile to note that analyses of abundances based on weak UV absorption lines can be influenced by the selection effect alluded to in the last few paragraphs. If the databases are restricted only to spectra with absorption features strong enough to be detected but weak enough to avoid concerns of unresolved saturation, and also to observations of stars bright enough for the exposure time to be relatively short, then the analyses will tend to be limited in the range of total hydrogen column density being sampled. Consequently, as longer sight lines are included, more rarefied gas is being probed. This tends to restrict the study of depletion variations to the local ISM. In order to fully explore current Galactic elemental abundances and depletion levels with a revitalized STIS and new Cosmic Origins Spectrograph, as well as search for features such as the spatial abundance pattern noted in this paper or other effects at large distances, it will be important to make long exposure time observations of distant stars an important part of the analysis.
5 Conclusions
This paper has combined new observations from an HST observing program abbreviated by the STIS power failure with Archival detections and previously published measurements of Kr I 1236 to compile a database of 50 Kr/H abundance ratios for sight lines up to 5.9 kpc in length and with average hydrogen densities from less than 0.10 cm-3 to more than 10.0 cm-3. Collectively, the data strengthen earlier evidence that krypton is undepleted in the ISM and that the Kr/H ratio is remarkably uniform within 750 pc of the Sun. Furthermore, these two properties underline the significance of an apparent enhancement of 0.10 dex in krypton abundance for sight lines of length 750—2500 pc. This abundance elevation is matched by enhanced O/H abundance ratios for the same sight lines, and similar distance dependencies in both gas-phase oxygen and copper abundances among other sight lines. However, N/O abundance ratios are reduced by a factor of two thirds in the same annulus. These disparate pieces of evidence suggest a nucleosynthetic origin for the abundance variations, while their spatial extent is comparable to the size of the Gould Belt. It is possible that the noted elemental abundance variations for Kr, O, Cu, and N arise out of star formation engendered as the Gould Belt was formed. Given the spatial extent of D/H variations, the Gould Belt may be at the bottom of this trend as well.
References
- André et al. (2003) André, M. K., Oliveira, C. M., Howk, J. C., Ferlet, R., Désert, J.-M., Hébrard, G., Lacour, S., Lecavelier des Étangs, A., Vidal-Madjar, A., Moos, H. W. 2003, ApJ, 591, 1000
- Cardelli et al. (1991) Cardelli, J. A., Savage, B. D., & Ebbets, D. C. 1991, ApJ, 393, L23
- Cardelli & Meyer (1997) Cardelli, J. A., & Meyer, D. M. 1997, ApJ, 477, L57
- Cartledge et al. (2004) Cartledge, S. I. B., Lauroesch, J. T., Meyer, D. M., & Sofia, U. J. 2004, ApJ, 613, 1037
- Cartledge et al. (2006) Cartledge, S. I. B., Lauroesch, J. T., Meyer, D. M., & Sofia, U. J. 2006, ApJ, 641, 327
- Cartledge et al. (2003) Cartledge, S. I. B., Meyer, D. M., & Lauroesch, J. T. 2003, ApJ, 597, 408
- Cartledge et al. (2001) Cartledge, S. I. B., Meyer, D. M., Lauroesch, J. T., & Sofia, U. J. 2001, ApJ, 562, 394
- Chieffi & Limongi (2004) Chieffi, A., & Limongi, M. 2004, ApJ, 608, 405
- Comerón & Torra (1994) Comerón, F., & Torra, J. 1994, A&A, 281, 35
- de Avillez & Mac Low (2002) de Avillez, M. A., & Mac Low, M.-M. 2002, ApJ, 581, 1047
- Grenier (2000) Grenier, I. A. 2000, A&A, 364, L93
- Howk & Sembach (2000) Howk, J. C., & Sembach, K. R. 2000, AJ, 119, 2481
- Knauth et al. (2003) Knauth, D. C., Andersson, B.-G., McCandliss, S. R., & Moos, H. W. 2003, ApJ, 596, L51
- Knauth at al. (2006) Knauth, D. C., Meyer, D. M. & Lauroesch, J. T. 2006, ApJ, 647, L115
- Lauroesch et al. (2008) Lauroesch, J. T., Cartledge, S. I. B., Clayton, G. C., Sofia, U. J., & Meyer, D. M. 2008, ApJ, submitted
- Linsky et al. (2006) Linsky, J. L., Draine, B. T., Moos, H. W., Jenkins, E. B., Wood, B. E., Oliveira, C. M., Blair, W. P., Friedman, S. D., Gry, C., Knauth, D., Kruk, J. W., Lacour, S., Lehner, N., Redfield, S., Shull, J. M., Sonneborn, G., & Williger, G. M. 2006, ApJ, 647, 1106
- Lodders (2003) Lodders, K. 2003, ApJ, 591, 1220
- Martin-Hernández et al. (2002) Martin-Hernández, N. L., Peeters, E., Morisset, C., Tielens, A. G. G. M., Cox, P., Roelfsema, P. R., Baluteau, J. -P., Schaerer, D., Mathis, J. S., Damour, F., Churchwell, E., & Kessler, M. F. 2002, A&A, 381, 606
- Meyer et al. (1997) Meyer, D. M., Cardelli, J. A., & Sofia, U. J. 1997, ApJ, 490, L103
- Meyer et al. (1998) Meyer, D. M., Jura, M., & Cardelli, J. A. 1998, ApJ, 493, 222
- Nittler (2005) Nittler, L. R. 2005, ApJ, 618, 281
- Oliveira et al. (2006) Oliveira, C. M., Moos, H. W., Chayer, P., & Kruk, J. W. 2006, ApJ, 642, 283
- Perrot & Grenier (2003) Perrot, C. A., & Grenier, I. A. 2003, A&A, 404, 519
- Pöppel (1997) Pöppel, W. G. L. 1997, Fundamentals of Cosmic Physics, 18, 1
- Rachford et al. (2002) Rachford, B. L., Snow, T. P., Tumlinson, J., Shull, J. M., Blair, W. P., Ferlet, R., Friedman, S. D., Gry, C., Jenkins, E. B., Morton, D. C., Savage, B. D., Sonnentrucker, P., Vidal-Madjar, A., Welty, D. E., & York, D. G. 2002, ApJ, 577, 221
- Reddy et al. (2003) Reddy, B. E., Tomkin, J., Lambert, D. L., & Allende Prieto, C. 2003, MNRAS, 340, 304
- Rolleston et al. (2000) Rolleston, W. R. J., Smartt, S. J., Dufton, P. L., & Ryans, R. S. I. 2000, A&A, 363, 537
- Spitzer (1978) Spitzer, L. 1978, Physical Processes in the Interstellar Medium (New York: John Wikey & Sons)
- Torra et al. (2000) Torra, J., Fernández, D., & Figueras, F. 2000, A&A, 359, 82
- Vallée (2002) Vallée, J. P. 2002, ApJ, 566, 261
- Wood et al. (2004) Wood, B. E., Linsky, J. L., Hébrard, G., Williger, G. M., Moos, H. W., & Blair, W. P. 2004, ApJ, 609, 838
| HST | STIS | Time | FUSE | Time | |||
|---|---|---|---|---|---|---|---|
| Sight Line | Program | Data Set | Date | (s) | Data Set | Date | (s) |
| HD 23478 | GO9505 | O6LJ01020 | 2002 Aug 20 | 2945 | A1200202000 | 2001 Jan 02 | 1871 |
| HD 24190 | GO9505 | O6LJ02020 | 2003 Mar 28 | 2940 | A1200101000 | 2000 Sep 11 | 4721 |
| HD 40893 | GO9855 | O8NA02010 | 2004 Feb 20 | 2162 | P2160101000 | 2001 Oct 14 | 7138 |
| O8NA02020 | 2004 Feb 20 | 7902 | |||||
| HD 69106 | GO8484 | O5LH03010 | 2000 Jun 08 | 660 | P1022301000 | 2001 Apr 04 | 58 |
| O5LH03020 | 2000 Jun 08 | 625 | P1022302000 | 2002 Dec 31 | 404 | ||
| HD 94454 | GO9505 | O6LJ0H010 | 2002 Dec 17 | 1780 | A1200501000 | 2000 Apr 04 | 7622 |
| HD 99857 | GO8043 | O54301010 | 1999 Feb 20 | 1307 | P1024501000 | 2000 Feb 05 | 4267 |
| O54301020 | 1999 Feb 20 | 1307 | |||||
| O54301030 | 1999 Feb 20 | 1307 | |||||
| HD 99872 | GO9505 | O6LJ0I020 | 2002 May 06 | 1890 | A1200606000 | 2000 Apr 09 | 3270 |
| HD 102065 | GO7509 | O4O001010 | 1998 Mar 28 | 7679 | Q1010101000 | 2000 May 28 | 6793 |
| HD 104705 | GO7270 | O57R01010 | 1998 Dec 24 | 2400 | P1025701000 | 2000 Feb 05 | 4482 |
| HD 108639 | GO9505 | O6LJ0A020 | 2002 Oct 19 | 1860 | A1201301000 | 2000 Mar 20 | 4980 |
| HD 112999 | GO9505 | O6LJ0C010 | 2002 Oct 21 | 1620 | A1202001000 | 2000 May 15 | 7544 |
| O6LJ0C020 | 2002 Oct 21 | 1650 | |||||
| HD 114886 | GO9505 | O6LJ0D010 | 2003 Apr 03 | 1560 | A1201801000 | 2000 Apr 06 | 4450 |
| O6LJ0D020 | 2003 Apr 03 | 1590 | |||||
| HD 115071 | GO9505 | O6LJ0E010 | 2003 Mar 31 | 1890 | P1025901000 | 2000 May 14 | 5796 |
| O6LJ0E020 | 2003 Mar 31 | 1890 | |||||
| HD 116852 | GO8241 | O5C01C010 | 2000 Jun 25 | 360 | P1013801000 | 2000 May 27 | 7212 |
| GO9855 | O8NA03010 | 2003 Aug 08 | 2522 | ||||
| O8NA03020 | 2003 Aug 08 | 3200 | |||||
| HD 122879 | GO8241 | O5C037010 | 2000 May 08 | 360 | B0710501000 | 2002 Mar 03 | 1532 |
| GO8484 | O5LH07010 | 2000 Aug 29 | 708 | ||||
| O5LH07020 | 2000 Aug 29 | 708 | |||||
| HD 124314 | GO8043 | O54307010 | 1999 Apr 10 | 1466 | P1026201000 | 2000 Mar 22 | 4382 |
| HD 137595 | GO9505 | O6LJ03010 | 2002 Aug 21 | 1200 | A1201213000 | 2000 Jul 10 | 5715 |
| HD 144965 | GO9505 | O6LJ05010 | 2003 Feb 01 | 1510 | A1201601000 | 2000 Mar 21 | 1195 |
| A1201602000 | 2001 Aug 08 | 7220 | |||||
| HD 147165 | GO5891 | Z34R0407T | 1996 Mar 23 | 108.8 | |||
| HD 147683 | GO9505 | O6LJ06020 | 2003 Mar 27 | 2940 | A1200909000 | 2000 Jul 10 | 7367 |
| HD 151805 | GO9434 | O6LZ63010 | 2003 Apr 03 | 1200 | P1026602001 | 2000 Jul 14 | 2741 |
| HD 152590 | GO8241 | O5C08P010 | 2000 Mar 03 | 1440 | B0710601000 | 2001 Jul 08 | 1389 |
| GO9855 | O8NA04010 | 2003 Sep 17 | 2240 | B0710602000 | 2001 Aug 12 | 2773 | |
| O8NA04020 | 2003 Sep 17 | 8076 | |||||
| HD 165246 | GO9855 | O8NA05010 | 2003 Aug 13 | 2158 | P1050301000 | 2000 Sep 01 | 7782 |
| O8NA05020 | 2003 Aug 13 | 2626 | |||||
| HD 177989 | GO7270 | O57R03010 | 1999 May 28 | 1660 | P1017101000 | 2000 Aug 28 | 10289 |
| O57R03020 | 1999 May 28 | 2897 | |||||
| HD 203374 | GO848 | O5LH08010 | 2000 Mar 23 | 1325 | B0300101000 | 2001 Aug 02 | 10170 |
| O5LH08020 | 2000 Mar 23 | 1325 | B0300102000 | 2001 Aug 02 | 8483 | ||
| O5LH08030 | 2000 Mar 23 | 1325 | |||||
| HD 206267 | GO8484 | O5LH09010 | 2000 Mar 24 | 711 | B0460301000 | 2002 Jun 30 | 4869 |
| O5LH09020 | 2000 Mar 24 | 711 | |||||
| HD 208947 | GO8484 | O5LH0A010 | 2000 Jul 14 | 714 | |||
| O5LH0A020 | 2000 Jul 14 | 714 | |||||
| HD 209339 | GO8484 | O5LH0B010 | 2000 May 18 | 708 | B0300501000 | 2001 Jul 21 | 2044 |
| O5LH0B020 | 2000 May 18 | 708 | |||||
| HD 224151 | GO8043 | O54308010 | 1999 Feb 18 | 1496 | P1224101000 | 2000 Aug 11 | 6023 |
| S3040201000 | 1999 Dec 09 | 7092 | |||||
| S3040202000 | 2000 Aug 13 | 9202 | |||||
| HD 303308 | GO7301 | O4QX04010 | 1998 Mar 19 | 2220 | P1221601000 | 2000 May 25 | 6105 |
| P1221602000 | 2000 May 27 | 7692 |
| log10[(Kr)] | log10[(H)] | log10[(H I)] | log10[(H2)] | Spectral | log | ||||||||||||
|---|---|---|---|---|---|---|---|---|---|---|---|---|---|---|---|---|---|
| Star | (mÅ) | [cm-2] | [cm-2] | [cm-2] | [cm-2] | log10[Kr/H] | Type | (kpc) | [cm-3] | log(H2) | |||||||
| HD 23478aaThe spectral type for the star associated with this sight line suggests that the interstellar Ly- profile is potentially contaminated by stellar neutral hydrogen. These Kr/H ratios are used in the analysis with caution. | 4.16 | (0.33) | 12.23 | (0.05) | 21.21 | (0.04) | 21.01 | (0.06) | 20.48 | (0.07) | 8.98 | B3IV | 0.32 | 0. | 22 | 0.43 | |
| HD 24190 | 5.87 | (0.72) | 12.35 | (0.06) | 21.30 | (0.05) | 21.18 | (0.06) | 20.38 | (0.07) | 8.95 | B2V | 0.32 | 0. | 31 | 0.62 | |
| HD 40893 | 9.52 | (1.35) | 12.56 | (0.07) | 21.54 | (0.05) | 21.45 | (0.09) | 20.49 | (0.07) | 8.98 | B0IV | 2.80 | 0. | 40 | 0.75 | |
| HD 69106 | 4.06 | (0.76) | 12.19 | (0.09) | 21.09 | (0.06) | 21.06 | (0.06) | 19.64 | (0.07) | 8.90 | B0.5II | 1.40 | 0. | 55 | 1.15 | |
| HD 94454bbThe (H), (H I), , and (H2) values are undetermined, due to obvious contamination of the interstellar Ly- line by stellar material. These sight lines are omitted from the Kr/H ratio analysis. | 5.37 | (0.85) | 12.36 | (0.08) | 20.70 | (0.07) | B8III | 0.33 | |||||||||
| HD 99857 | 5.47 | (0.94) | 12.34 | (0.08) | 21.36 | (0.05) | 21.28 | (0.06) | 20.29 | (0.07) | 9.02 | B1Ib | 3.06 | 0. | 61 | 0.77 | |
| HD 99872bbThe (H), (H I), , and (H2) values are undetermined, due to obvious contamination of the interstellar Ly- line by stellar material. These sight lines are omitted from the Kr/H ratio analysis. | 4.27 | (0.47) | 12.25 | (0.07) | 20.55 | (0.11) | B3V | 0.23 | |||||||||
| HD 102065bbThe (H), (H I), , and (H2) values are undetermined, due to obvious contamination of the interstellar Ly- line by stellar material. These sight lines are omitted from the Kr/H ratio analysis. | 3.76 | (0.52) | 12.16 | (0.11) | 20.47 | (0.08) | B2V | 0.17 | |||||||||
| HD 104705 | 2.99 | (0.54) | 12.05 | (0.09) | 21.20 | (0.05) | 21.15 | (0.06) | 19.94 | (0.06) | 9.15 | B0III/IV | 3.90 | 0. | 88 | 0.96 | |
| HD 108639 | 6.72 | (1.34) | 12.40 | (0.10) | 21.38 | (0.08) | 21.35 | (0.09) | 19.95 | (0.07) | 8.98 | B1III | 0.11 | 0. | 84 | 1.13 | |
| HD 112999bbThe (H), (H I), , and (H2) values are undetermined, due to obvious contamination of the interstellar Ly- line by stellar material. These sight lines are omitted from the Kr/H ratio analysis. | 4.50 | (0.65) | 12.27 | (0.09) | 19.99 | (0.07) | B6IIIn | 0.34 | |||||||||
| HD 114886 | 8.31 | (2.01) | 12.43 | (0.14) | 21.40 | (0.05) | 21.34 | (0.06) | 20.23 | (0.07) | 8.97 | O9V | 0.38 | 0. | 32 | 0.87 | |
| HD 115071 | 10.77 | (1.56) | 12.64 | (0.07) | 21.50 | (0.05) | 21.36 | (0.06) | 20.63 | (0.07) | 8.86 | O9.5V | 1.64 | 0. | 20 | 0.57 | |
| HD 116852 | 3.02 | (0.38) | 12.06 | (0.06) | 21.03 | (0.06) | 20.98 | (0.06) | 19.79 | (0.11) | 8.97 | O9III | 4.80 | 1. | 14 | 0.94 | |
| HD 122879 | 9.27 | (1.26) | 12.60 | (0.13) | 21.35 | (0.10) | 21.26 | (0.12) | 20.31 | (0.08) | 8.75 | B0Ia | 2.10 | 0. | 46 | 0.74 | |
| HD 124314 | 12.72 | (2.50) | 12.70 | (0.09) | 21.47 | (0.05) | 21.39 | (0.06) | 20.40 | (0.07) | 8.77 | O7 | 1.15 | 0. | 08 | 0.77 | |
| HD 137595aaThe spectral type for the star associated with this sight line suggests that the interstellar Ly- profile is potentially contaminated by stellar neutral hydrogen. These Kr/H ratios are used in the analysis with caution. | 5.50 | (0.63) | 12.34 | (0.07) | 21.24 | (0.04) | 21.00 | (0.06) | 20.56 | (0.06) | 8.90 | B3Vn | 0.83 | 0. | 17 | 0.38 | |
| HD 144965aaThe spectral type for the star associated with this sight line suggests that the interstellar Ly- profile is potentially contaminated by stellar neutral hydrogen. These Kr/H ratios are used in the analysis with caution. | 4.79 | (0.70) | 12.30 | (0.08) | 21.37 | (0.05) | 21.07 | (0.06) | 20.77 | (0.07) | 9.07 | B3Vne | 0.68 | 0. | 05 | 0.30 | |
| HD 147165 | 6.71 | (0.41) | 12.45 | (0.05) | 21.40 | (0.08) | 21.38 | (0.08) | 19.79 | (0.06) | 8.95 | B1III | 0.15 | 0. | 75 | 1.31 | |
| HD 147683aaThe spectral type for the star associated with this sight line suggests that the interstellar Ly- profile is potentially contaminated by stellar neutral hydrogen. These Kr/H ratios are used in the analysis with caution. | 8.32 | (1.03) | 12.52 | (0.06) | 21.55 | (0.07) | 21.41 | (0.08) | 20.68 | (0.12) | 9.03 | B4V | 0.59 | 0. | 29 | 0.57 | |
| HD 151805 | 6.54 | (1.30) | 12.41 | (0.08) | 21.41 | (0.05) | 21.32 | (0.06) | 20.36 | (0.07) | 9.00 | B1Ib | 5.91 | 0. | 85 | 0.75 | |
| HD 152590 | 8.49 | (1.05) | 12.54 | (0.05) | 21.47 | (0.05) | 21.37 | (0.06) | 20.47 | (0.07) | 8.93 | O7.5V | 1.80 | 0. | 30 | 0.70 | |
| HD 165246 | 7.95 | (0.78) | 12.53 | (0.06) | 21.46 | (0.06) | 21.41 | (0.07) | 20.15 | (0.08) | 8.93 | O9III | 1.59 | 0. | 23 | 1.01 | |
| HD 177989 | 4.70 | (0.72) | 12.25 | (0.07) | 21.09 | (0.05) | 20.98 | (0.06) | 20.16 | (0.08) | 8.84 | B2II | 4.91 | 1. | 09 | 0.63 | |
| HD 203374 | 9.36 | (0.95) | 12.56 | (0.06) | 21.38 | (0.06) | 21.20 | (0.08) | 20.60 | (0.09) | 8.82 | B0IVpe | 0.62 | 0. | 10 | 0.48 | |
| HD 206267 | 11.16 | (1.47) | 12.65 | (0.10) | 21.46 | (0.04) | 21.20 | (0.06) | 20.81 | (0.05) | 8.81 | O6e | 0.59 | 0. | 20 | 0.35 | |
| HD 208947ccNo H2 data are available; this sight line is omitted from the Kr/H ratio analysis. | 2.53 | (0.40) | 11.99 | (0.08) | 21.10 | (0.06) | 21.10 | (0.06) | 9.11 | B2V | 0.50 | 0. | 08 | ||||
| HD 209339 | 5.81 | (0.55) | 12.35 | (0.06) | 21.26 | (0.06) | 21.17 | (0.07) | 20.24 | (0.08) | 8.91 | B0IV | 1.00 | 0. | 23 | 0.72 | |
| HD 224151 | 9.87 | (2.82) | 12.58 | (0.12) | 21.43 | (0.05) | 21.30 | (0.06) | 20.53 | (0.06) | 8.85 | B0.5II | 1.10 | 0. | 10 | 0.60 | |
| HD 303308 | 5.36 | (0.96) | 12.32 | (0.09) | 21.46 | (0.06) | 21.41 | (0.06) | 20.18 | (0.12) | 9.14 | O3V | 2.67 | 0. | 46 | 0.98 | |
| Distance | ||||||||||||
|---|---|---|---|---|---|---|---|---|---|---|---|---|
| Range | Error | Scatter | Sample | Error | Scatter | Error | Scatter | Sample | ||||
| (kpc) | log10[Kr/H]ISM | (dex) | (dex) | Size | log10[O/H]ISM | (dex) | (dex) | log10[O/Kr]ISM | (dex) | (dex) | Size | |
| 0 | 0.75 | 0.02 | 0.05 | 27 | 0.03 | 0.04 | 5.59 | 0.04 | 0.07 | 6 | ||
| 0.55 | 2.50 | 0.02 | 0.08 | 16 | 0.02 | 0.08 | 5.53 | 0.03 | 0.06 | 11 | ||
| 2.50 | 6.00 | 0.04 | 0.10 | 7 | 0.03 | 0.10 | 5.56 | 0.04 | 0.04 | 7 | ||
| Near+Far | 0.02 | 0.06 | 34 | 0.02 | 0.08 | 5.57 | 0.03 | 0.05 | 13 | |||
| log10[(O)] | log10[(Kr)] | log10[(H)] | |||||||||||
|---|---|---|---|---|---|---|---|---|---|---|---|---|---|
| Star | (mÅ) | [cm-2] | [cm-2] | [cm-2] | log10[O/Kr] | log10[O/H] | (kpc) | ||||||
| HD 23478aaPotential Ly- contamination; hydrogen abundance ratios used with caution. | 9.58 | (0.57) | 17.79 | (0.09) | 12.23 | (0.05) | 21.21 | (0.04) | 5.56 | 3.42 | 0.32 | ||
| HD 24190 | 13.51 | (0.96) | 17.91 | (0.05) | 12.35 | (0.06) | 21.30 | (0.05) | 5.56 | 3.39 | 0.32 | ||
| HD 40893 | 19.94 | (1.06) | 18.07 | (0.03) | 12.56 | (0.07) | 21.54 | (0.05) | 5.51 | 3.47 | 2.80 | ||
| HD 69106 | 8.34 | (0.67) | 17.69 | (0.05) | 12.19 | (0.09) | 21.09 | (0.06) | 5.50 | 3.40 | 1.40 | ||
| HD 94454bbThere is apparent Ly- contamination; hydrogen abundance ratios are unavailable. | 10.12 | (0.80) | 17.83 | (0.04) | 12.36 | (0.08) | 5.47 | 0.33 | |||||
| HD 99857 | 13.32 | (0.89) | 17.92 | (0.04) | 12.34 | (0.08) | 21.36 | (0.05) | 5.58 | 3.44 | 3.06 | ||
| HD 99872bbThere is apparent Ly- contamination; hydrogen abundance ratios are unavailable. | 9.10 | (0.72) | 17.78 | (0.05) | 12.25 | (0.07) | 5.53 | 0.23 | |||||
| HD 102065bbThere is apparent Ly- contamination; hydrogen abundance ratios are unavailable. | 7.63 | (0.51) | 17.70 | (0.07) | 12.16 | (0.11) | 5.54 | 0.17 | |||||
| HD 104705ddThe given oxygen abundance is tallied over radial velocities consistent with the krypton profile; the measurement does not represent the total oxygen abundance for this sight line. | 7.82 | (0.47) | 17.67 | (0.06) | 12.05 | (0.09) | 21.20 | (0.05) | 5.62 | 3.53 | 3.90 | ||
| HD 108639 | 20.81 | (1.79) | 18.09 | (0.06) | 12.40 | (0.10) | 21.38 | (0.08) | 5.69 | 3.29 | 0.11 | ||
| HD 112999bbThere is apparent Ly- contamination; hydrogen abundance ratios are unavailable. | 9.01 | (1.04) | 17.75 | (0.07) | 12.27 | (0.09) | 5.48 | 0.34 | |||||
| HD 114886 | 15.61 | (1.67) | 17.95 | (0.06) | 12.43 | (0.14) | 21.40 | (0.05) | 5.52 | 3.45 | 0.38 | ||
| HD 115071 | 26.12 | (1.53) | 18.20 | (0.03) | 12.64 | (0.07) | 21.50 | (0.05) | 5.56 | 3.30 | 1.64 | ||
| HD 116852 | 6.41 | (0.65) | 17.56 | (0.04) | 12.06 | (0.06) | 21.03 | (0.06) | 5.50 | 3.47 | 4.80 | ||
| HD 122879 | 22.39 | (2.07) | 18.10 | (0.04) | 12.60 | (0.13) | 21.35 | (0.10) | 5.50 | 3.25 | 2.10 | ||
| HD 124314 | 24.32 | (1.53) | 18.17 | (0.04) | 12.70 | (0.09) | 21.47 | (0.05) | 5.47 | 3.30 | 1.15 | ||
| HD 137595aaPotential Ly- contamination; hydrogen abundance ratios used with caution. | 9.15 | (0.78) | 17.76 | (0.04) | 12.34 | (0.07) | 21.24 | (0.04) | 5.42 | 3.48 | 0.83 | ||
| HD 144965aaPotential Ly- contamination; hydrogen abundance ratios used with caution. | 8.74 | (0.68) | 17.80 | (0.06) | 12.30 | (0.08) | 21.37 | (0.05) | 5.50 | 3.57 | 0.68 | ||
| HD 147165 | 14.62 | (0.58) | 17.97 | (0.10) | 12.45 | (0.05) | 21.40 | (0.08) | 5.52 | 3.43 | 0.15 | ||
| HD 147683aaPotential Ly- contamination; hydrogen abundance ratios used with caution. | 15.06 | (0.90) | 18.00 | (0.05) | 12.52 | (0.06) | 21.55 | (0.07) | 5.48 | 3.55 | 0.59 | ||
| HD 151805ddThe given oxygen abundance is tallied over radial velocities consistent with the krypton profile; the measurement does not represent the total oxygen abundance for this sight line. | 16.57 | (1.58) | 17.98 | (0.07) | 12.41 | (0.08) | 21.41 | (0.05) | 5.57 | 3.43 | 5.91 | ||
| HD 152590 | 16.80 | (0.85) | 18.01 | (0.03) | 12.54 | (0.05) | 21.47 | (0.05) | 5.47 | 3.46 | 1.80 | ||
| HD 165246 | 15.63 | (1.20) | 18.00 | (0.04) | 12.53 | (0.06) | 21.46 | (0.06) | 5.47 | 3.46 | 1.59 | ||
| HD 177989 | 11.92 | (0.89) | 17.83 | (0.04) | 12.25 | (0.07) | 21.09 | (0.05) | 5.58 | 3.26 | 4.91 | ||
| HD 203374 | 17.36 | (0.84) | 18.02 | (0.04) | 12.56 | (0.06) | 21.38 | (0.06) | 5.46 | 3.36 | 0.62 | ||
| HD 206267 | 19.59 | (0.82) | 18.11 | (0.03) | 12.65 | (0.10) | 21.46 | (0.04) | 5.46 | 3.35 | 0.59 | ||
| HD 208947ccNo H2 data are available; ratios involving hydrogen refer to H I only. | 10.11 | (1.02) | 17.68 | (0.03) | 11.99 | (0.08) | 21.10 | (0.06) | 5.69 | 3.42 | 0.50 | ||
| HD 209339 | 14.99 | (0.80) | 17.96 | (0.04) | 12.35 | (0.06) | 21.26 | (0.06) | 5.61 | 3.30 | 1.00 | ||
| HD 224151 | 20.28 | (2.27) | 18.08 | (0.06) | 12.58 | (0.12) | 21.43 | (0.05) | 5.50 | 3.35 | 1.10 | ||
| HD 303308ddThe given oxygen abundance is tallied over radial velocities consistent with the krypton profile; the measurement does not represent the total oxygen abundance for this sight line. | 13.09 | (0.55) | 17.91 | (0.04) | 12.32 | (0.09) | 21.46 | (0.06) | 5.59 | 3.55 | 2.67 | ||