75282
M. Schartmann
55email: schartmann@mpe.mpg.de
Turbulent AGN tori
Abstract
Recently, the MID-infrared Interferometric instrument (MIDI) at the VLTI has shown that dust tori in the two nearby Seyfert galaxies NGC 1068 and the Circinus galaxy are geometrically thick and can be well described by a thin, warm central disk, surrounded by a colder and fluffy torus component. By carrying out hydrodynamical simulations with the help of the TRAMP code (Klahr et al., 1999), we follow the evolution of a young nuclear star cluster in terms of discrete mass-loss and energy injection from stellar processes. This naturally leads to a filamentary large scale torus component, where cold gas is able to flow radially inwards. The filaments open out into a dense and very turbulent disk structure. In a post-processing step, we calculate observable quantities like spectral energy distributions or images with the help of the 3D radiative transfer code MC3D (Wolf, 2003). Good agreement is found in comparisons with data due to the existence of almost dust-free lines of sight through the large scale component and the large column densities caused by the dense disk.
keywords:
Galaxies: nuclei – Galaxies: Seyfert – ISM: dust, extinction – Radiative transfer – Hydrodynamics – ISM: evolution1 Introduction
Within the current model of Active Galactic Nuclei (AGN), two observed classes of galaxies can be explained by one intrinsically unique AGN model, the so-called Unified Scheme of Active Galactic Nuclei: a hot accretion disk surrounds the central black hole and crosses over into a geometrically thick torus. Nowadays, it is thought that the gap between these two is filled by the so-called Broad Line Region, see Gaskell (2008). The optically thick torus blocks the sight towards the centre, when viewed edge-on and enables the viewing of the characteristic emission peak of the accretion disk and the Broad Line Region clouds when viewed face-on. Numerous observations back this model and also hint towards a clumpy nature of the gas and dust torus.
2 Our hydrodynamical model
| Parameter | Value | Parameter | Value | Parameter | Value |
|---|---|---|---|---|---|
| 5 pc | K | ||||
| 165 km/s | |||||
| 0.5 | |||||
| 25 pc | SNR |
Mass of the black hole (), stellar mass within the core radius of the distribution (), initial gas mass (), cluster core radius (), torus radius (), stellar velocity dispersion (), exponent of the angular momentum distribution (), adiabatic exponent (), initial gas temperature (), normalised mass injection rate (), mass of a single injection () and the supernova rate (SNR).
As was recently shown by Davies et al. (2007) with the help of adaptive optics techniques, a large number of Seyfert galaxies possess young nuclear star clusters. We assume that they are built-up in a short-duration starburst and are interested in the effects of the evolution of their stars after the violent phase of supernova type II explosions is already over, after approximately 40 Myrs. After this phase, energy input into the interstellar medium is dominated by the ejection of planetary nebulae and energy input is provided by supernova type Ia explosions. We model both of these processes by discrete input of mass and energy into a number of grid cells. The gas blobs resembling planetary nebulae additionally get a certain bulk velocity, made up of the turbulent velocity of the hot stellar system and the rotational velocity of the stars. For the rate of mass loss, we use the approximative calculations of Jungwiert et al. (2001). The supernova rate is difficult to determine and hence a more or less free parameter in our simulations, constrained by observations and a large parameter study. The third major ingredient of our simulations is optically thin cooling, where we employ an effective cooling curve calculated with the help of the CLOUDY code (Ferland, 1993) by Plewa (1995). The parameters of our standard model are summarised in Table 1.
3 Resulting structure
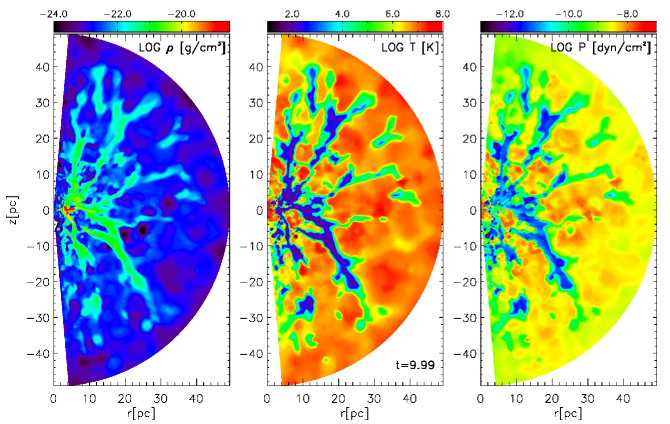
Within the first few percent of a global orbit of the simulation, single ejected planetary nebulae are visible, as well as shock fronts due to recent supernova explosions. The turbulent nature of these processes, together with cooling instability soon leads to the formation of long filaments of cold gas and voids of hot gas in-between, as evident from Fig. 1(a). Gas moves mainly radially inwards within the cold filaments, leading to a separation of gas velocities between different temperature phases. The largest infall velocities are reached by the cold material and the smallest by the hot gas between the filaments. This is caused by the larger support against gravity by thermal pressure in the hot phase and the additional turbulent pressure, arising from the perpetual stirring by supernova explosions and the input of mass with high random velocities. Therefore, cold gas moves radially inwards, until the angular momentum barrier is reached and a disk forms. Due to the infall of gas within the filaments from different directions, it shows turbulent behaviour. From Fig. 1(a,b) it is also evident that density and temperature are complementary, which results from the implemented optically thin cooling, which scales proportional to the square of the gas density. Pressure equilibrium is not reached, because of cooling instability in the filaments as well as recent supernova input, both acting on smaller timescale than relaxation processes (Fig. 1c). The resulting multi-phase medium reflects the shape of the cooling function as well as the local imbalance with energy and momentum input by supernovae and planetary nebulae.
4 Comparison with observations
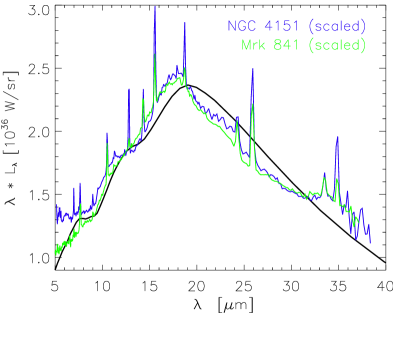
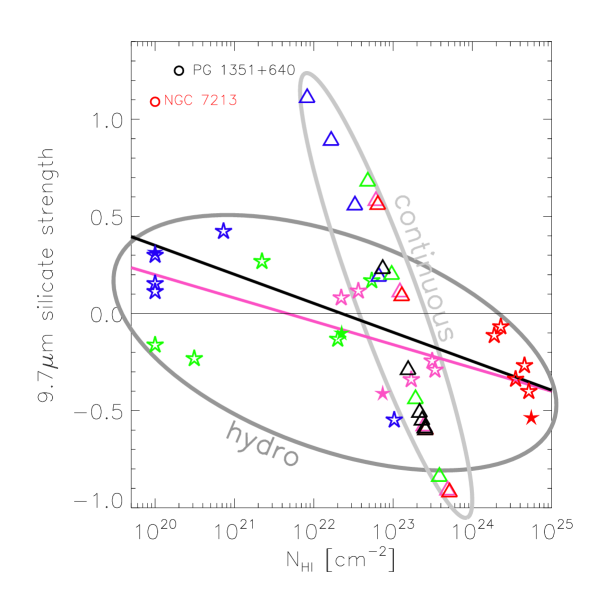
With the help of a constant dust-to-gas ratio, we convert the resulting gas density distribution (see Fig. 1a) into the corresponding dust density distribution. The latter is used in radiative transfer calculations with MC3D to calculate observable quantities like spectral energy distributions or images at various wavelengths. Fig. 2 shows the comparison of our standard model at inclination angle with two intermediate type Seyfert galaxies (scaled) observed with the Spitzer satellite. The largest deviations at around m are caused by crystalline forsterite in emission, which is currently not included in our dust model. As was shown by Shi et al. (2006), AGN follow a linear relation between neutral hydrogen column density and the m silicate feature strength. We determine the latter as the difference between the simulated spectral energy distribution (SED) and the underlying (spline-fitted) continuum. Fig. 2 shows the comparison of the observed relation for the whole Shi et al. (2006) sample (black line) and the Seyfert galaxies alone (magenta) and the relation resulting from our hydrodynamical simulations described above. We obtain a shallow slope and scatter comparable to the observations. In contrast to this, our previous continuous torus models as described in Schartmann et al. (2005) are not able to explain the full range of neutral hydrogen column densities without resulting in unphysically silicate feature strengths. Additionally, continuous models are in disagreement with the observed large scatter of the relation. Therefore, it can be taken as a further observational indication for clumpiness of AGN tori. The reason for the good comparison of our hydrodynamical models is caused by the two component structure, made up of a dense thin disk and a fluffy large scale torus. The filamentary structure guarantees the existence of more or less unobscured lines of sight towards the funnel region, where the silicate feature in emission is produced and thereby relativises the silicate feature in absorption. The smearing out of the silicate feature in emission due to clumpy dust distributions is already a well known issue (see e. g. Nenkova et al., 2002, Hönig et al., 2006 or Schartmann et al., 2008). The dense disk component enables also large hydrogen column densities.
5 Summary
A physical model for the built-up and evolution of gas tori in Seyfert galaxies is presented. We follow the evolution of a young nuclear star cluster, during the phase, where the ejection of planetary nebulae is the dominant process for mass input. Together with supernova energy input and the onset of cooling instability yield a large scale, filamentary torus component with cavities of hot gas in-between. Within the filaments, gas cools and gets accreted in radial direction. Close to the angular momentum barrier, it opens out into a dense disk component with turbulent character due to the inflow of filaments and clumps of gas from random directions. This two component structure enables a good comparison with observations.
Acknowledgements.
We are grateful to H.W.W.Spoon for providing us the reduced Spitzer SED of Mrk 841 and K.R.W.Tristram for helpful discussion.References
- Davies et al. (2007) Davies, R. I., Mueller Sánchez, F., Genzel, R., et al. 2007, Astrophys. J., 671, 1388
- Ferland (1993) Ferland, G. J. 1993, Hazy, A Brief Introduction to Cloudy 84 (University of Kentucky Internal Report, 565 pages)
- Gaskell (2008) Gaskell, C. 2008, in these proceedings
- Hönig et al. (2006) Hönig, S. F., Beckert, T., Ohnaka, K., & Weigelt, G. 2006, Astron. Astrophys., 452, 459
- Jungwiert et al. (2001) Jungwiert, B., Combes, F., & Palouš, J. 2001, Astron. Astrophys., 376, 85
- Klahr et al. (1999) Klahr, H. H., Henning, T., & Kley, W. 1999, Astrophys. J., 514, 325
- Nenkova et al. (2002) Nenkova, M., Ivezić, Ž., & Elitzur, M. 2002, Astrophys. J., Lett., 570, L9
- Plewa (1995) Plewa, T. 1995, Mon. Not. R. Astron. Soc., 275, 143
- Schartmann et al. (2005) Schartmann, M., Meisenheimer, K., Camenzind, M., Wolf, S., & Henning, T. 2005, Astron. Astrophys., 437, 861
- Schartmann et al. (2008) Schartmann, M., Meisenheimer, K., Camenzind, M., et al. 2008, Astron. Astrophys., 482, 67
- Shi et al. (2006) Shi, Y., Rieke, G. H., Hines, D. C., et al. 2006, Astrophys. J., 653, 127
- Weedman et al. (2005) Weedman, D. W., Hao, L., Higdon, S. J. U., et al. 2005, Astrophys. J., 633, 706
- Wolf (2003) Wolf, S. 2003, Computer Physics Communications, 150, 99