A method to correct IACT data for atmospheric absorption due to the Saharan Air Layer
Abstract
Context. Using the atmosphere as a detector volume, Imaging Air Cherenkov Telescopes (IACTs) depend highly on the properties and the condition of the air mass above the telescope. On the Canary Island of La Palma, where the Major Atmospheric Gamma-ray Imaging Cherenkov telescope (MAGIC) is situated, the Saharan Air Layer (SAL) can cause strong atmospheric absorption affecting the data quality and resulting in a reduced gamma flux.
Aims. To correlate IACT data with other measurements, e.g. long-term monitoring or Multi-Wavelength (MWL) studies, an accurate flux determination is mandatory. Therefore, a method to correct the data for the effect of the SAL is required.
Methods. Three different measurements of the atmospheric absorption are performed on La Palma. From the determined transmission, a correction factor is calculated and applied to the MAGIC data.
Results. The different transmission measurements from optical and IACT data provide comparable results. MAGIC data of PG 1553+113, taken during a MWL campaign in July 2006, were analyzed using the presented method, providing a corrected flux measurement for the study of the spectral energy distribution of the source.
Key Words.:
Methods: data analysis – Atmospheric effects – Techniques: photometric – Gamma rays: observations1 Introduction
The Earth’s atmosphere plays an important role in all ground-based observations because it is traversed by light from all objects observed. Scattering and absorption of light by the atmosphere is variable and reduces the flux measured at the telescope. On the Canary Island of La Palma, very strong atmospheric absorption can occur, in case the meteorologic phenomenon Saharan Air Layer (SAL) takes place. A warm air mass, consisting of mineral dust, travels from the Sahara westward; this becomes the so-called SAL, when it is undercut by a cool and moist air layer from the sea. Located between 1.5 km and 5.5 km above sea level (a.s.l.), the SAL, also known as Calima, can extend above the North Atlantic Ocean as far as the United States and the western Caribbean Sea (Dunion & Velden 2004).
Variable absorption can cause apparent flux variations, and the absolute flux level is in all cases reduced. To to correct for this reduction, the atmospheric absorption is measured. On La Palma, three measurements are available. The Carlsberg Meridian Telescope (CMT) provides nightly values of extinction. From the optical data of the KVA and also from the MAGIC data itself, the atmospheric transmission can be determined. The results of these measurements are discussed and compared for the nights between July 15th 2006 and July 28th 2006.
A correction method was developed for the MAGIC telescope: From the absorption measurements, a factor is calculated and used in the analysis to correct for the effect of SAL.
2 Feasibility Study
Before the development of the method, the feasibility of a correction based on the transmission measurement had to be checked. After explaining the principle of the Imaging Air Cherenkov Technique, the effect of the SAL on the Cherenkov data is explained, discussing in particular the vertical shower development.
2.1 Imaging Air Cherenkov Technique
Particles enter the atmosphere, interact with nuclei and produce electromagnetic or particle cascades. The Cherenkov light emitted by these secondary particles traverses the remainder of the atmosphere and is measured by a camera equipped with photon detectors. The morphology of the recorded shower images is used to distinguish the images of gamma-induced showers from those initiated by other particles, such as protons. Therefore, the shower images are parameterized (Hillas 1985), and cuts in the corresponding distributions are used to suppress the background (Riegel & Bretz 2005). The energy spectrum is calculated by comparing the parameters of the measured to those of the simulated data, for which the energy is known. The most important parameter to reconstruct the energy of a primary photon is SIZE, i.e. the total amount of light in the shower image. Apart from minor dependences on other properties, the energy is mainly proportional to the SIZE.
2.2 Effect of Atmospheric Absorption
The atmospheric absorption reduces the number of measured photons and therefore the SIZE of the shower images. Consequently, the energy of the primary particle is underestimated when comparing the SIZE of affected data to that of showers simulated for an ideal atmosphere. For an accurate energy reconstruction, the shower images have to be corrected for the loss of light due to absorption, or the atmospheric absorption has to be included in the simulation. As different amounts of atmospheric absorption in the single nights would require different sets of simulated data, a correction method for the data is preferred.
2.3 Dependence on the Height in the Atmosphere
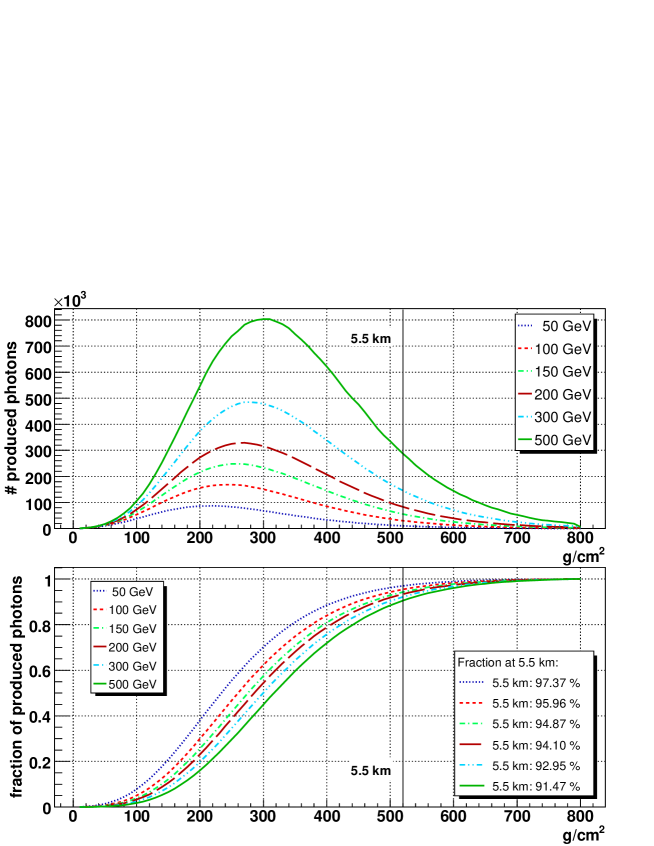
Based on optical data, the values for transmission provided by CMT and KVA correspond to light passing the whole atmosphere. The Cherenkov light of a shower originates in a height between 20 km a.s.l. and the ground. While the first interaction occurs at about 20 km a.s.l., the shower maximum is at around 10 km a.s.l. Figure 1 shows the number of produced Cherenkov photons (upper plot) and the fraction of produced light (lower plot) versus height. From the integral fraction of light (lower plot), it can be concluded that, for primary particles with an energy below 500 GeV, more than 90 % of the shower light is produced above 5.5 km a.s.l. Consequently, less than 10 % of the overall emitted light is absorbed by a slightly lower amount, because it does not traverse the entire SAL. To a first-order approximation, this small effect can be neglected, implying that a factor calculated from the measured atmospheric transmission can be used to correct the affected data.
3 Measurements of the Atmospheric Absorption
Absorption measurements are available from three different instruments at the Observatorio del Roque de los Muchachos (ORM).
3.1 CMT - Extinction Measurements
The CMT (Evans et al. 2002) is one of the optical telescopes in the ORM. Since 1984, it provides a value for the atmospheric extinction for each night. Since April 1999, the measurement is completed in the r’-band at an effective wavelength of 625 nm (CMT 2007). For a dust-free night, the extinction for the passband r’ was determined to be 0.09 mag. The atmospheric transmission can be calculated with the following formula, where is the extinction in a dust-free night and the observed one:
| (1) |
While the Cherenkov spectrum extends between 280 nm and 700 nm and peaks at about 320 nm, the optical measurements are above 600 nm. Since the effect of SAL is dominated by Mie scattering, which is independent of wavelength, the measured absorption can be used to complete the correction.
Since the values of the CMT are provided at zenith, i.e. airmass , they must be corrected for the higher airmass when using them for data of higher zenith distance. For the IACT data presented here, the zenith distance is between 18∘ and 35∘ (), which corresponds to a difference for the atmospheric transmission of less than 5 % for the range of extinction values shown here.
3.2 KVA - Optical Data
The KVA telescope111http://tur3.tur.iac.es/ consists of two telescopes with 60 cm and 35 cm apertures. The latter is used for photometric observations of TeV blazars in the R-band (effective wavelength 640 nm). The flux of the blazar is determined by measuring the counts inside a circular aperture and comparing this to several calibrated comparison stars in the field of the blazar, measured with the same aperture radius. In this way, any influence of atmospheric extinction is effectively eliminated. However, the comparison stars can also be used to estimate the atmospheric extinction during the night. In principle, the extinction could be determined by fitting a straight line to an airmass–magnitude plot; the photometric accuracy of the comparison star data in the literature (0.02 mag-0.05 mag) is, however, insufficient for this. Only stars observed at low airmass (X1.2) were instead selected and, for each star, the zero point value was determined individually, where Rinstr was the measured magnitude (scaled to an exposure time of one second) and Rcal was the calibrated R-band magnitude. Averaging for each night, a value of 5.16 was found to provide a good approximation of a photometric night. During nights affected by the SAL, was higher. The transmission relative to a dust-free night was computed by Eq. 1, where was 5.16 and was taken to be the average for the night.
3.3 MAGIC Data
In addition to optical measurements, the atmospheric transmission can be determined directly from the IACT data.
A simple way is to use the absolute light yield measure obtained from muon images as described in Goebel et al. (2005). This method is based on the fact that the spectral shape and flux of muons at the telescope are well known. For a well-determined muon sample, only showers where the telescope is inside the Cherenkov light cone are selected. As these showers produce ring-like images in the camera, the background can be completely suppressed. Comparing the measured light yield distribution to that of a corresponding simulated sample, a ratio is determined that can be used for an absolute light calibration to correct for changes in the light efficiency of the telescope, e.g. mirror degradation. Since this correction is completed on a monthly basis, short time variations in the atmosphere are not taken into account. Consequently, the effect of SAL is still evident in the measured muons. Having an impact parameter smaller than the diameter of the mirror (17 m), the selected muons produce their light between 700 m above the telescope and the ground, i.e. between 2900 m a.s.l. and 2200 m a.s.l. in case of the MAGIC telescope. To account for the fact that this light passes only part of the SAL, the determined ratio is multiplied by a factor of ten to estimate the absorption, assuming an effective production height of 350 m for Cherenkov light. Without any additional measurements, the layering of the SAL is unknown. Accordingly, the results from the muons are not very precise and should therefore not be used for correction, but can serve as an independent crosscheck and first-order approximation.
The absorption can instead be determined directly from the images of the showers themselves by comparing the SIZE distributions of the affected data with those of a dust-free night. The transmission is calculated from the shift in the peak of these distributions, where is the position of the peak either for a dust-free night () or for a night affected by the SAL ():
| (2) |
For each night of affected data, one value was determined. Since the observations used have almost the same zenith angle distributions and the zenith distance is only between 18∘ and 35∘, the dependence on the zenith angle can be neglected.
A similar method was studied for the Whipple telescope (Lebohec & Holder 2003) using the measured cosmic ray background for a relative calibration of the detector response.
4 Correction Method
In the analysis of MAGIC, there are several levels at which possible corrections can be applied:
-
1.
the factor in the absolute light calibration can be adapted to correct for the additional absorption.
-
2.
the SIZE of the shower can be increased according to the absorption
-
3.
the correction can be included in the energy reconstruction.
The last two possibilities obviously do not correct for changes in the shower morphology. Losses of light at the shower margin might change the shape of the image after cleaning. Consequently, common background-suppression cuts, normally applied to all data, will give less accurate results, since the morphology of the showers is different from the one assumed by the cuts. Inter-night changes in the atmospheric absorption complicate adapting the cuts to the changing shower shape. In contrast, a correction applied before cleaning, i.e. to the raw signal of all pixels, also correctly recovers the image shape and parameters accordingly.
For this approach, an additional factor is applied in the conversion from FADC counts to photo-electrons (phe). The correction is applied according to the following formula:
| (3) |
Applying this correction, obviously non-detected showers cannot be recovered, but the SIZE distributions are not affected significantly for an atmospheric absorption up to 40 %. For simulated data (including absorption), the SIZE distributions agree well after applying the correction for an absorption smaller than 40 %. In cases of higher absorption, a more detailed Monte Carlo study is required, and a more complex correction might be considered.
Furthermore, the fluctuations in signals, such as those from night-sky background light, increase. Comparing corrected dark-time observations with data taken in strong moonlight (Albert et al. 2007), the fluctuations after correction are found to remain well below those for extreme light conditions. By including arrival-time information in the image cleaning, it could also be shown (Tescaro et al. 2007) that even data with strong fluctuations are properly handled. Hence, no further correction is necessary to account for this effect if the correction is applied to data taken under normal light conditions. Consequently, the calculated image parameters are not skewed by the increase in the amplitude of the fluctuations and therefore do not influence the efficiencies obtained from simulated showers.
5 Results
To check the method, a source of constant flux is ideally used. However, no affected MAGIC data of a steady source are available. Data affected by the SAL are difficult to schedule, since these rare weather conditions are hardly predictable and difficult to identify for the support astronomers.
In July 2006, the MAGIC telescope observed the Active Galactic Nucleus PG 1553+113 contemporaneously with the X-ray satellite Suzaku, the IACT array H.E.S.S. and the optical telescope KVA during a MWL campaign. Due to the SAL, the absorption for the single nights from July 15th to July 28th varied between 5 % and 30 % according to the SIZE measurement. Therefore, the discussed correction was applied to the MAGIC data.
5.1 Measurements of the Atmospheric Transmission
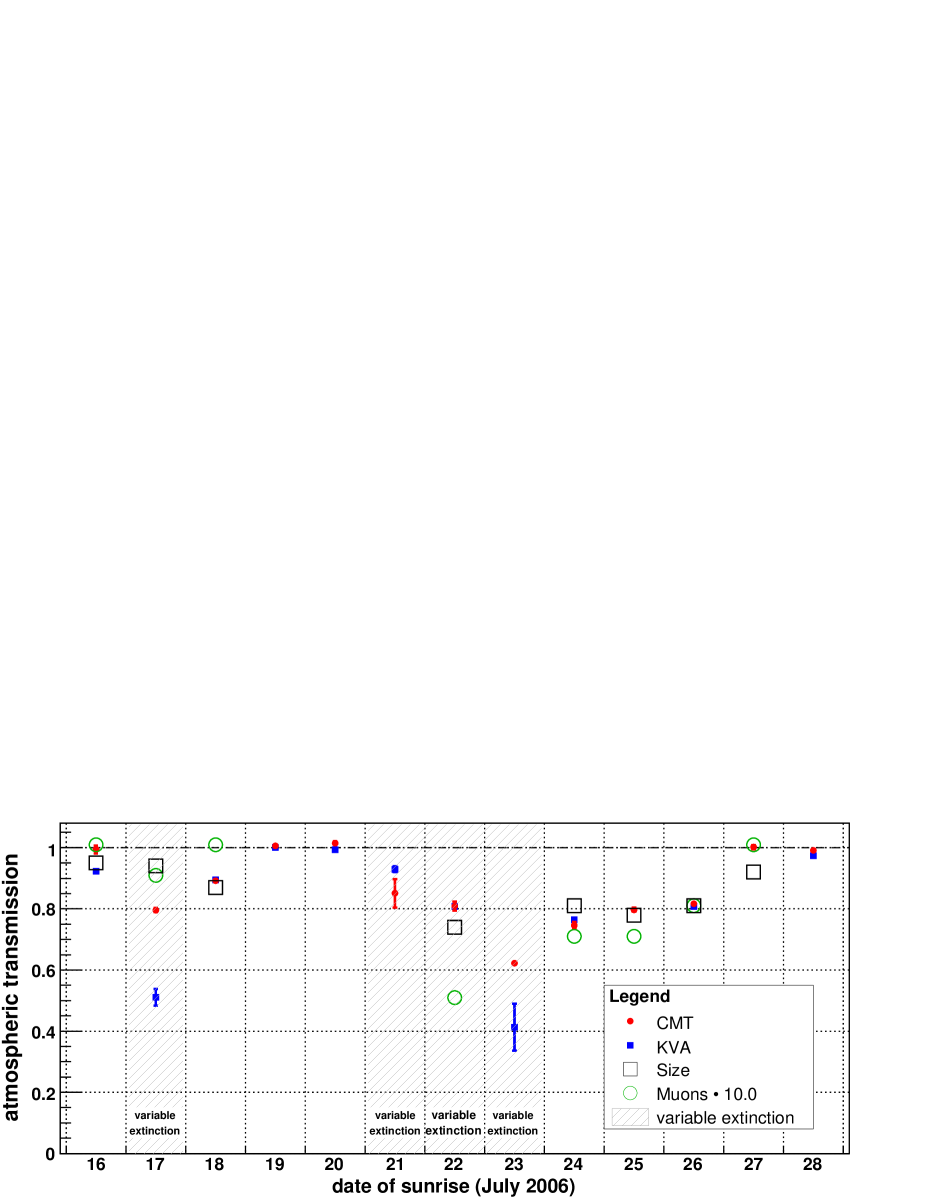
With the atmospheric transmission determined from the presented measurements, comparable results were achieved for the eight nights of observation of PG 1553+113 in July 2006 (Fig. 2). From the MAGIC data, the transmission was determined only for the nights in which data of PG 1553+113 were available. During some nights, the atmospheric transmission was changing, as seen both by the CMT and KVA. The KVA reports considerable changes even within a few minutes. Consequently, the different measurements agree less than for nights with stable extinction, since they were probably acquired not precisely simultaneously. Unstable conditions during the observations worsened the accuracy of the correction. The remaining differences between the values from the KVA and the CMT can be explained by the fact that the intrinsic errors in magnitude for the comparison stars are larger in the case of KVA. Deviations of the SIZE may come from the limited accuracy of the method. For the muon measurements, the systematic uncertainties in the values are larger due to the strong dependence on the vertical distribution of the sand-dust in the SAL. Apart from small deviations and the differences in the nights with variable extinction, the measurements agree well.
Since the CMT measurements are the most accurate, they were used for the calculation of the correction factors.
5.2 SIZE Distributions
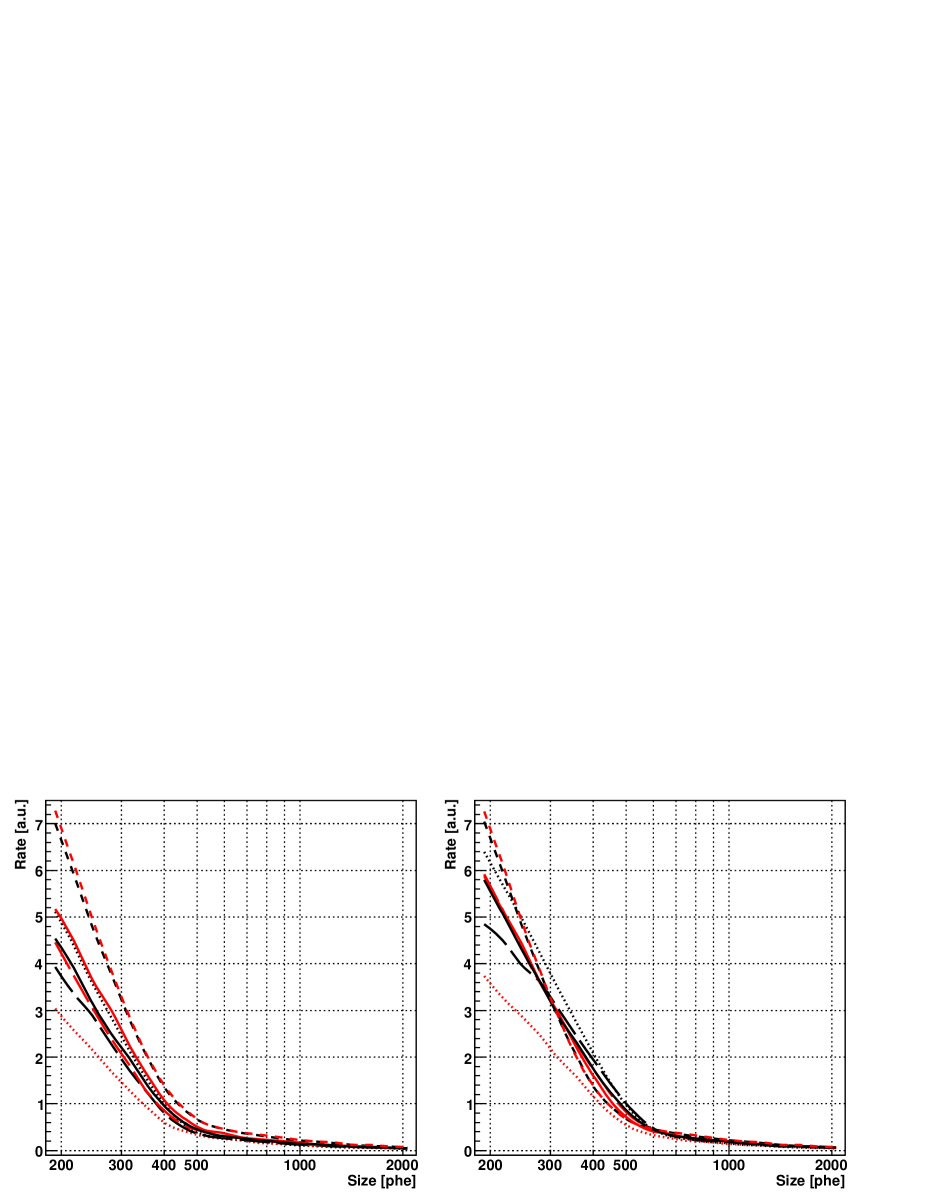
As explained in Sect. 2.1, the atmospheric extinction influences mainly the SIZE of the showers. Figure 3 shows the SIZE distributions for the range used for the analysis before (left) and after (right) applying the correction with the values from the CMT. For the shown distributions, special cuts were applied to remove non-physical and muon events. Each curve corresponds to data of one night.
Before the correction, the SIZE distributions spread between 2.8 a.u. and 7 a.u. at 200 phe. After the correction, the spread was reduced to the interval between 4.7 a.u. and 7 a.u. apart from one outlier, corresponding to one night of variable extinction (red dotted line, 22.7.2006). Apart from this and a second curve (black dotted line, 17.7.2006) with a deviation at around 300 phe, the SIZE distributions agree well after the correction for SIZE > 200 phe, i.e. in the range used in the analysis.
5.3 Signal Reconstruction
The cuts for the background suppression mentioned in Sect. 2.1 include an intrinsic lower cut in SIZE, i.e. events with small SIZE are removed. Consequently, events with reduced SIZEs due to atmospheric absorption are cut away, resulting in a lower significance of the signal if the same standard cuts are applied.
For PG 1553+113, a significant number of events are expected at low energies due to the measured steep spectrum of the source. The expected effect of reduced significance due to the SAL is observed for data taken in July 2006: Without correction, a signal is obtained with 3.2 significance, improving to 5.0 with correction, using identical cuts for the background suppression in both cases.
5.4 Flux Determination
Applying the correction as explained in Sect. 4, the 8.5 hours of MAGIC data of PG 1553+113 from July 2006 were analyzed. Fitting a power law to the differential spectrum, a flux of at 200 GeV and a spectral index of were determined. A daily light curve shows a flux consistent with a constant flux within the errors. The results were shown in detail in Albert et al. (2008) and were used for MWL studies by Reimer et al. (2008).
Correcting the flux for the effect of the SAL, the systematic uncertainty in the method of 5 % results in an additional error of in the absolute flux.
6 Conclusion and Outlook
The different measurements of the atmospheric transmission from stellar photometry (KVA, CMT) and IACT data (MAGIC) agree well for nights with stable extinction. Since more than 90 % of the shower light originates above the SAL, the measurements can be used directly to correct the IACT data. By applying a correction factor in the calibration, the data of PG 1553+113 taken during the MWL campaign in July 2006 for example were corrected successfully. This shows that the loss of observation time due to atmospheric absorption can be reduced.
For additional checks, affected data of a steady source are required. When such data become available within scheduled MAGIC observations, the presented method can be tested further.
The correction should not be applied blindly to data affected by atmospheric absorption of another kind. For those, the vertical distribution of the atmospheric conditions should be studied e.g. with a Lidar (light detection and ranging), i.e. a device shooting a laser beam into the atmosphere and measuring the backscattered light. The possible use of information provided by a Lidar, however, still has to be investigated.
In cases of strong absorption, i.e. above 40 %, the method is limited by the fluctuations in the night-sky background light and the effect cannot be corrected completely.
Acknowledgements.
We would like to thank the IAC for the excellent working conditions at the Observatorio del Roque de los Muchachos in La Palma. The support of the German BMBF is gratefully acknowledged. We thank Dafydd Wyn Evans for his help and fruitful discussions about the data of the Carlsberg Meridian Telescope and Dorota Sobzyncska for her help with the simulated showers.References
- Albert et al. (2007) Albert, J., Aliu, E., Anderhub, H., et al. 2007, Very high energy gamma-ray observations during moonlight and twilight with the MAGIC telescope
- Albert et al. (2008) Albert, J., Aliu, E., Anderhub, H., et al. 2008, MAGIC Observations of PG 1553+113 during a Multi-Wavelength Campaign in July 2006
- CMT (2007) CMT. 2007, http://www.ast.cam.ac.uk/~dwe/SRF/camc_extinction.html
- Dunion & Velden (2004) Dunion, J. & Velden, C. 2004, Bull. Amer. Meteor. Soc., 85, 353
- Evans et al. (2002) Evans, D., Irwin, M., & Helmer, L. 2002, A&A, 395, 347
- Goebel et al. (2005) Goebel, F., Mase, K., Meyer, M., et al. 2005, in International Cosmic Ray Conference, Vol. 5, 179–182
- Hillas (1985) Hillas, A. M. 1985, in International Cosmic Ray Conference, 445–448
- Knapp & Heck (2004) Knapp, J. & Heck, D. 2004, EAS Simulation with CORSIKA: A Users Manual (Version 6.023)
- Lebohec & Holder (2003) Lebohec, S. & Holder, J. 2003, Astroparticle Physics, 19, 221
- Reimer et al. (2008) Reimer, A., Costamante, L., Reimer, O., Madejski, G., & Dorner, D. 2008, ApJ, 682, 775
- Riegel & Bretz (2005) Riegel, B. & Bretz, T. 2005, in International Cosmic Ray Conference, Vol. 5, 215–218
- Tescaro et al. (2007) Tescaro, D., Bartko, H., Galante, N., et al. 2007, in International Cosmic Ray Conference